


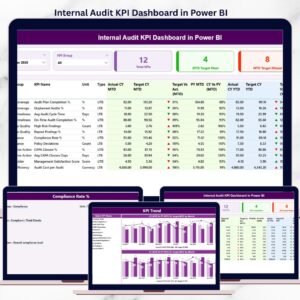
The Media & Entertainment KPI Dashboard in Power BI is a comprehensive and dynamic tool designed to help businesses in the media, entertainment, and broadcasting industries track key performance indicators (KPIs) related to content production, viewership, engagement, and revenue generation. This Power BI-based dashboard offers insightful data visualizations that allow you to monitor critical metrics such as audience reach, ad revenue, subscriber growth, content performance, and much more.
Whether you are managing a media network, a content creation studio, or an entertainment platform, this dashboard provides a centralized view of your business’s performance, helping you make data-driven decisions, optimize content strategies, and improve engagement with your target audience.

Key Features of the Media & Entertainment KPI Dashboard in Power BI
📊 Comprehensive KPI Tracking
Track essential media and entertainment metrics such as audience reach, viewership, subscriber growth, and ad revenue. Gain insights into how your content is performing and identify areas for improvement.
📈 Content Performance Analysis
Monitor the performance of individual pieces of content, whether videos, articles, or shows. Track key metrics like watch time, engagement rates, and content popularity to optimize your content strategy.
💰 Revenue & Advertising Metrics
Monitor ad revenue and other income sources, such as subscription fees and pay-per-view sales. Track the financial performance of your media and entertainment assets to ensure profitability.
🎯 Audience Insights
Analyze your audience demographics, preferences, and behavior. Use this data to improve content targeting, enhance user experience, and increase viewer engagement.
⚙️ Customizable & Scalable Dashboard
Customize the dashboard to reflect the unique KPIs of your media or entertainment business. Whether you are tracking YouTube views, podcast downloads, or television ratings, you can tailor the dashboard to fit your needs.
🔑 Real-Time Data Integration
Integrate real-time data from multiple sources, including social media platforms, streaming services, and content management systems. Get up-to-date insights for better decision-making.
Why You’ll Love the Media & Entertainment KPI Dashboard in Power BI
✅ Comprehensive Insights at Your Fingertips
Monitor all the essential metrics related to content performance, audience engagement, revenue, and more—all in one centralized location.
✅ Optimized Content Strategy
Track how individual pieces of content perform and analyze audience feedback to optimize your content strategy and improve engagement.
✅ Maximized Revenue & Profitability
Monitor your advertising revenue, subscription growth, and other income streams to ensure your media business remains financially sustainable and profitable.
✅ Data-Driven Decisions for Business Growth
Leverage the insights from the dashboard to make informed decisions that help grow your media or entertainment business and reach your target audience more effectively.
✅ Customizable & Flexible
Tailor the dashboard to reflect your business’s goals and objectives. It’s fully customizable to meet the needs of various media and entertainment companies, regardless of size or type.
What’s Inside the Media & Entertainment KPI Dashboard in Power BI?
-
Comprehensive KPI Tracking: Monitor audience reach, viewership, and engagement.
-
Content Performance Analysis: Track the performance of individual content pieces.
-
Revenue & Advertising Metrics: Monitor ad revenue, subscriptions, and other income sources.
-
Audience Insights: Gain valuable insights into audience demographics and behavior.
-
Customizable Features: Tailor the dashboard to your specific media or entertainment goals.
-
Real-Time Data Integration: Connect real-time data from various platforms and services.
How to Use the Media & Entertainment KPI Dashboard in Power BI
1️⃣ Download the Template: Access the Media & Entertainment KPI Dashboard in Power BI instantly.
2️⃣ Integrate Your Data Sources: Connect your data sources, including content management systems, streaming platforms, and social media.
3️⃣ Monitor KPIs & Performance: Track key metrics like audience reach, viewership, ad revenue, and more.
4️⃣ Analyze Content & Audience: Dive deep into content performance and audience behavior.
5️⃣ Optimize Your Media Strategy: Use the insights to adjust your content strategy, maximize revenue, and enhance user engagement.
Who Can Benefit from the Media & Entertainment KPI Dashboard in Power BI?
🔹 Media Networks & Broadcasting Companies
🔹 Content Creation Studios & Agencies
🔹 Streaming Platforms & OTT Services
🔹 Marketing & Ad Agencies in Media
🔹 Digital Media Managers & Analysts
🔹 Entertainment Executives & Business Owners
🔹 Data Analysts & Business Intelligence Professionals
Optimize your media and entertainment business with the Media & Entertainment KPI Dashboard in Power BI. Track content performance, audience engagement, ad revenue, and more, all in one easy-to-use dashboard.
Click here to read the Detailed blog post
Visit our YouTube channel to learn step-by-step video tutorials
Youtube.com/@PKAnExcelExpert


Reviews
There are no reviews yet.