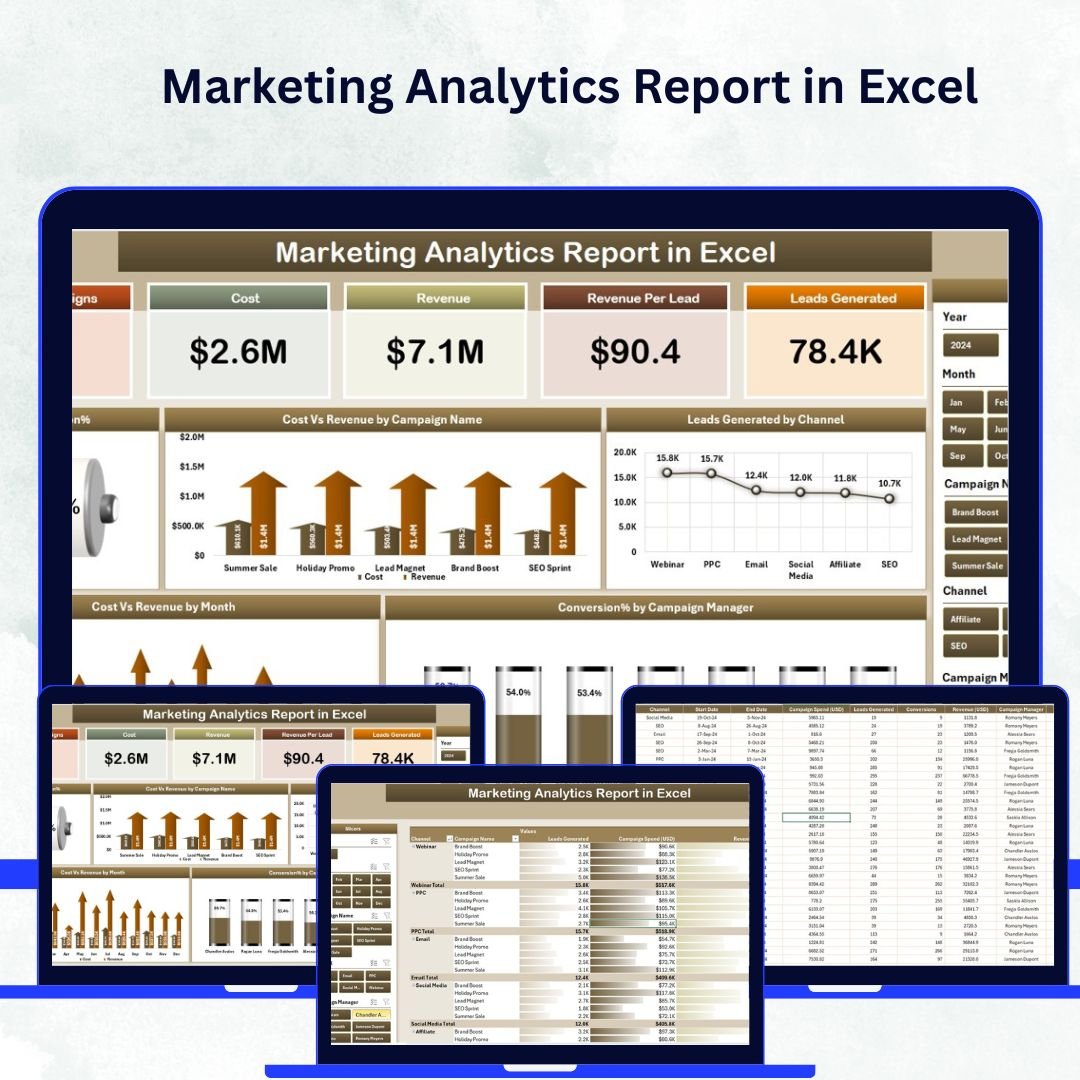
In the modern marketing landscape, data is everything — but without the right tools, it can quickly turn into chaos. The Marketing Analytics Report in Excel is your all-in-one, ready-to-use solution to simplify campaign tracking, performance analysis, and ROI measurement — all inside Microsoft Excel.
Whether you’re managing digital campaigns, social media ads, or multi-channel promotions, this dashboard transforms your marketing data into actionable insights. Designed for professionals who want clarity without complexity, it combines Excel’s power with interactive visuals to give you a 360° view of your marketing performance.
🚀 Key Features of the Marketing Analytics Report in Excel
📈 Comprehensive KPI Dashboard:
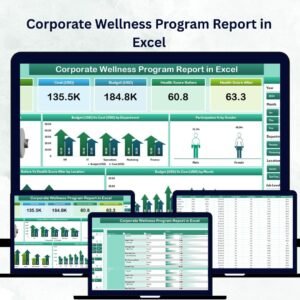
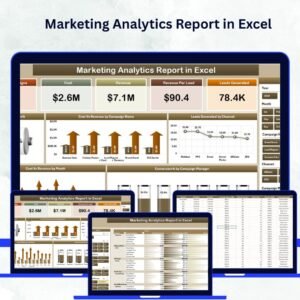
Get a snapshot of your marketing performance with cards showing Total Leads, Total Revenue, Total Cost, ROI, and Conversion Rate.
🎯 Campaign Performance Comparison:
Quickly identify high-performing and underperforming campaigns using Cost vs Revenue and Conversion charts.
📊 Interactive Slicers:
Filter data by campaign name, channel, month, or manager for personalized insights in real time.
💡 Detailed Report View:
Dive deeper into campaign details like start date, channel, cost, revenue, ROI, and conversions — all in a clean table layout.
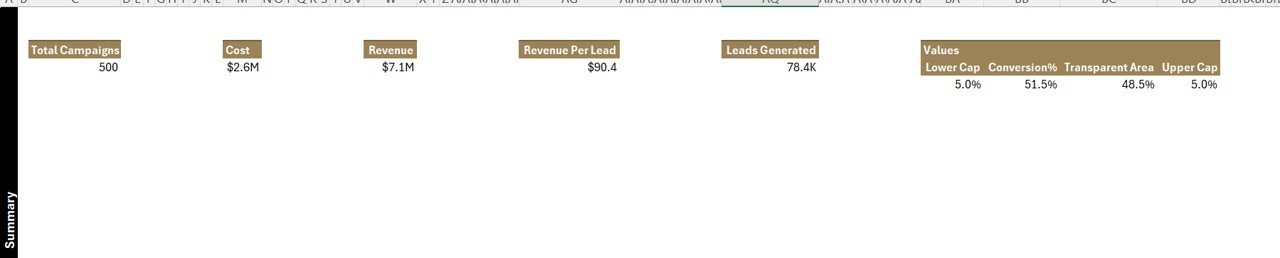
🧮 Automated KPI Calculations:
Built-in Excel formulas calculate ROI %, Conversion %, and Cost per Lead automatically — no manual effort needed.
🧭 Multi-Channel Analysis:
Compare lead generation and ROI across channels such as email, social media, paid ads, or referral campaigns.
📅 Monthly Trend Tracking:
View performance changes across months with Cost vs Revenue trend charts for smarter budget allocation.
⚙️ Support Sheet for Drop-downs:
Maintain clean, error-free data with pre-defined lists for campaigns, channels, and managers.
🎨 Professional Visual Design:
Engage stakeholders with modern charts, color-coded KPIs, and clear layouts optimized for readability.
💰 No Extra Software Required:
Enjoy all these insights without any subscription — 100% Excel-based and customizable.
📂 What’s Inside the Marketing Analytics Report in Excel
This Excel template comes with three main pages and a support sheet, making marketing analytics simple and efficient:
1️⃣ Summary Page – Executive Dashboard:
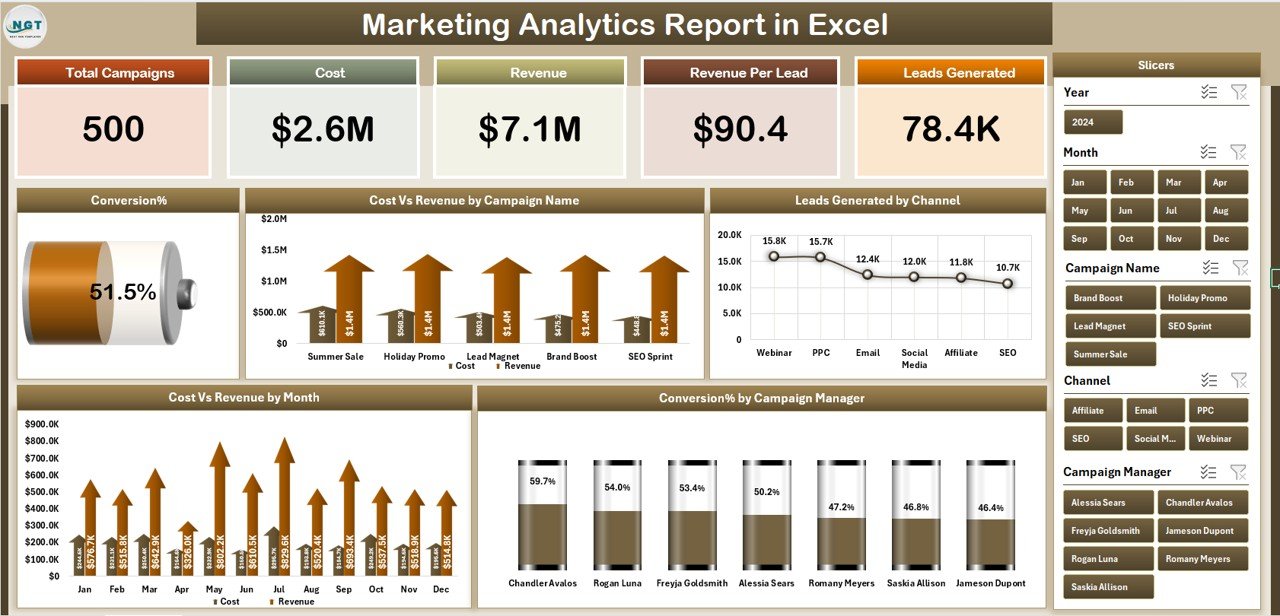
The visual heart of the report!
It showcases all vital KPIs, interactive charts, and slicers that help you evaluate marketing success at a glance.
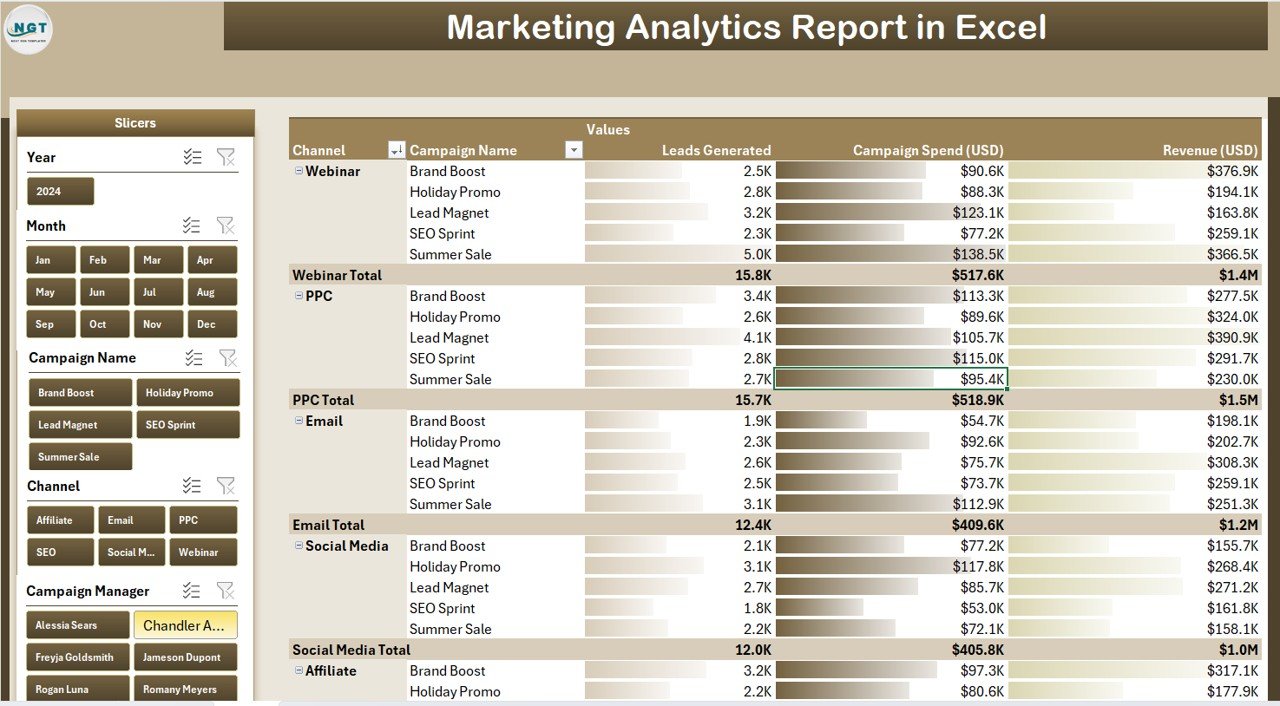
2️⃣ Report Page – Analytical Breakdown:
Ideal for deeper exploration, this page offers detailed tables with campaign data. Filter by campaign name, channel, or manager to assess performance patterns instantly.
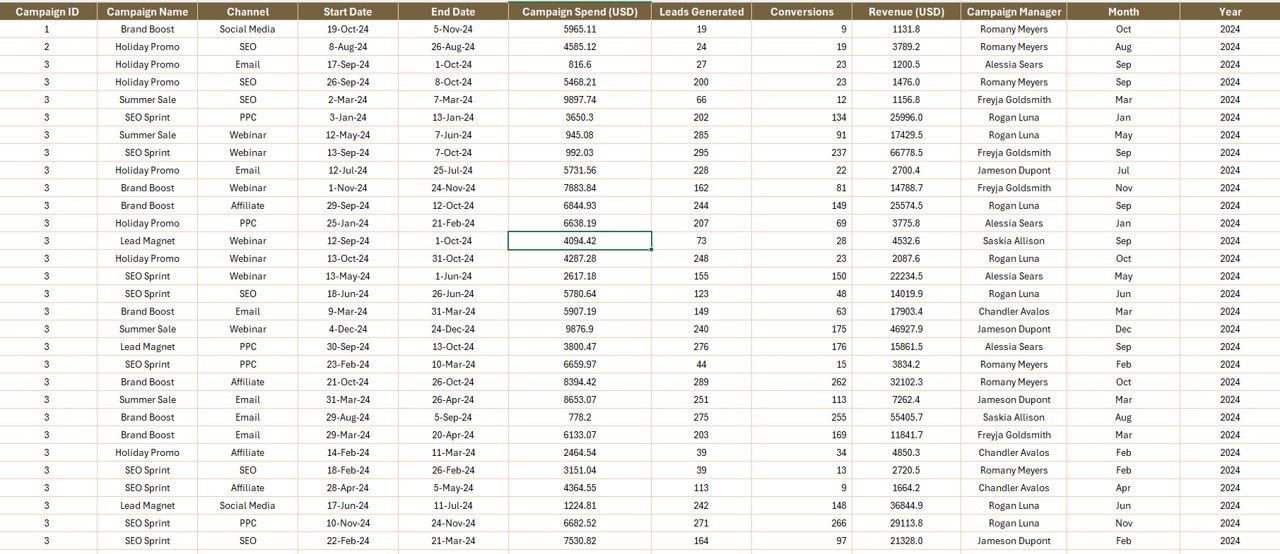
3️⃣ Data Sheet – Performance Foundation:
The source of truth for all visuals. Enter campaign data such as cost, leads, conversions, and revenue here. The dashboard updates automatically whenever data is changed.
4️⃣ Support Sheet – Backend Control:
Keep lists for dropdowns like campaign names, channels, and managers organized for consistent data entry.
Together, these sheets create a powerful, interactive marketing reporting system.
🧭 How to Use the Marketing Analytics Report in Excel
✅ Step 1: Enter your campaign data (cost, leads, conversions, revenue, etc.) in the Data Sheet.
✅ Step 2: Open the Summary Page to view auto-updated KPIs and visuals.
✅ Step 3: Apply slicers to filter insights by campaign, channel, or time period.
✅ Step 4: Use the Report Page for detailed analysis or meeting presentations.
✅ Step 5: Customize visuals, colors, or KPIs to match your company’s brand and strategy.
With just a few clicks, you’ll have a real-time, interactive marketing dashboard ready to present to stakeholders or clients.
👥 Who Can Benefit from the Marketing Analytics Report in Excel
📊 Marketing Managers: Track campaign performance and ROI across multiple channels.
💼 Business Owners: Get a clear view of marketing efficiency and return on investment.
📈 Analysts & Data Teams: Simplify marketing data visualization and reporting.
🎯 Campaign Executives: Evaluate performance by campaign manager or creative strategy.
🧠 Consultants & Agencies: Present client marketing data in a polished, professional format.
No matter your business size, this Excel dashboard makes marketing performance measurable, understandable, and actionable.
🔗 Click here to read the Detailed blog post
🎥 Visit our YouTube channel to learn step-by-step video tutorials
🔗 YouTube.com/@PKAnExcelExpert


Reviews
There are no reviews yet.