Market Research Dashboard sits at the heart of every successful business strategy. Organizations that truly understand customer satisfaction, pricing sensitivity, loyalty, and response behavior consistently outperform competitors. However, when survey data remains locked inside spreadsheets, insights stay buried under rows of numbers. Decision-making slows down, and opportunities get missed.
That is exactly why the Market Research Dashboard in Power BI becomes a game-changing analytics solution 🚀. This ready-to-use dashboard transforms raw survey data into interactive visuals, KPI cards, and meaningful comparisons. Instead of manually reviewing static reports, decision-makers explore insights dynamically and act with confidence.
Designed for market research teams, marketers, product managers, and business leaders, this dashboard helps organizations convert complex survey data into clear, actionable intelligence—all in one powerful Power BI report.
🔑 Key Features of Market Research Dashboard in Power BI
📊 5 Dedicated Analytical Pages for complete survey insights
🎯 Interactive Slicers & Filters for instant data exploration
📈 Dynamic KPI Cards & Visuals for quick performance tracking
😊 Customer Satisfaction & NPS Analysis across segments
💰 Price Sensitivity & Survey Cost Tracking for smarter pricing decisions
⏱️ Response Time Analysis to evaluate survey effectiveness
🔄 Automatic Data Refresh for up-to-date insights
🧩 Scalable Power BI Model suitable for growing datasets
This dashboard delivers speed, clarity, and control to market research analysis.
📂 What’s Inside the Market Research Dashboard
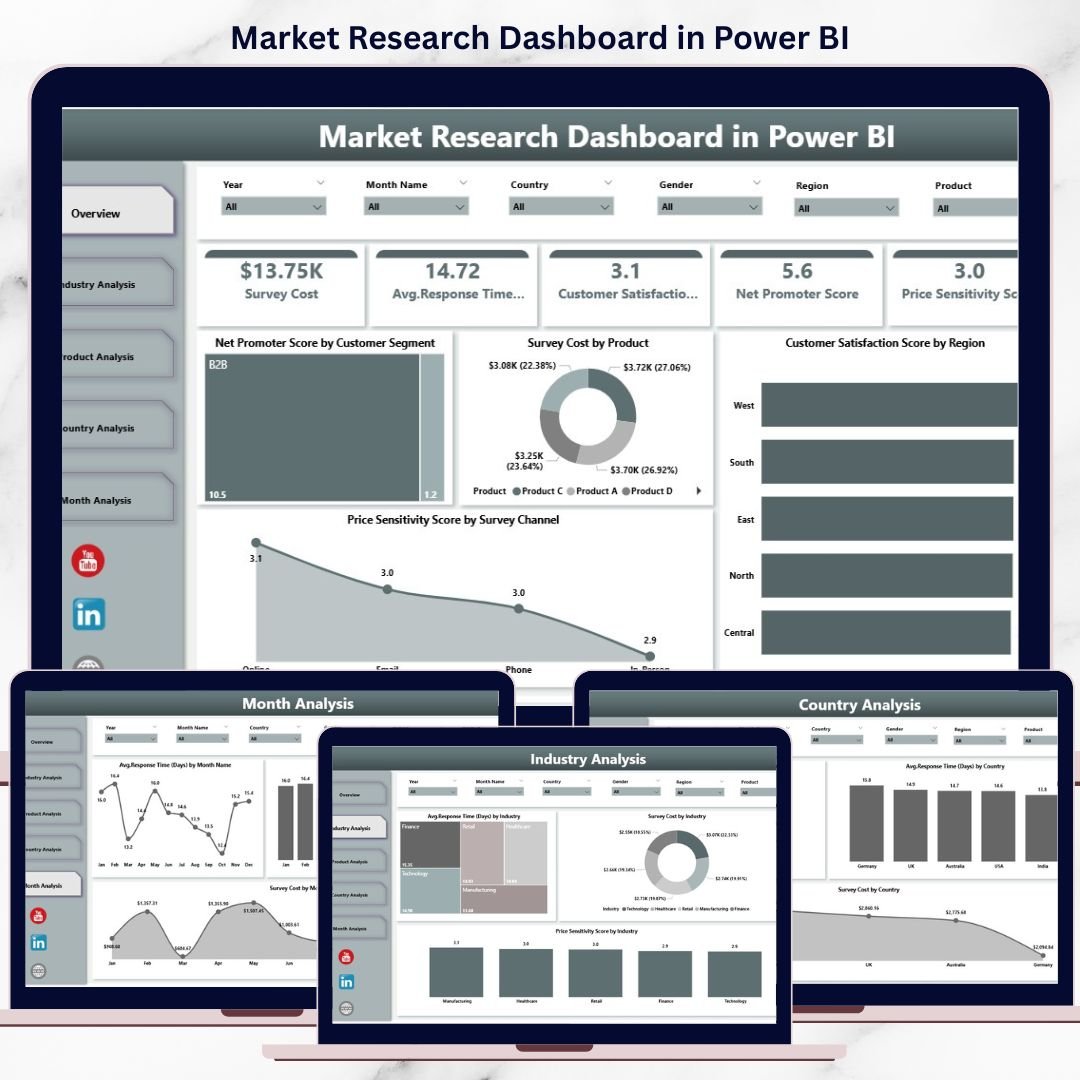
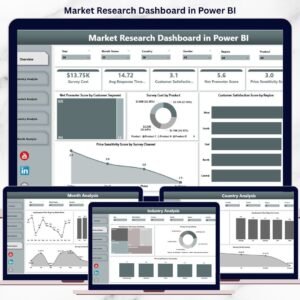
📊 Overview Page
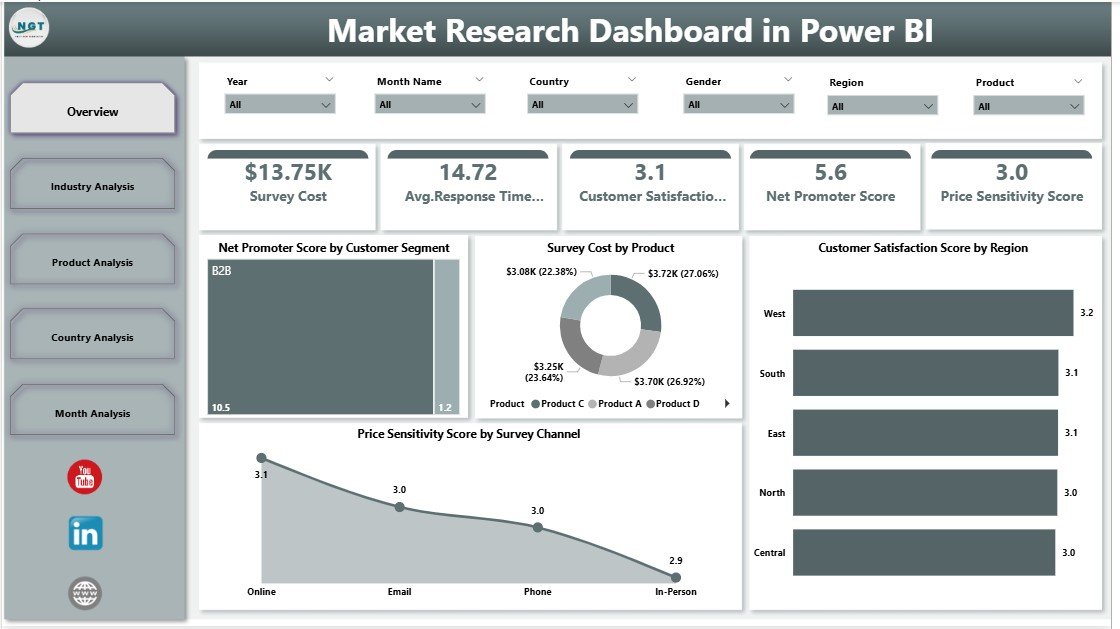
The executive summary of survey performance, showing:
-
Net Promoter Score by Customer Segment
-
Survey Cost by Product
-
Customer Satisfaction Score by Region
-
Price Sensitivity by Survey Channel
This page provides instant visibility into overall market sentiment.
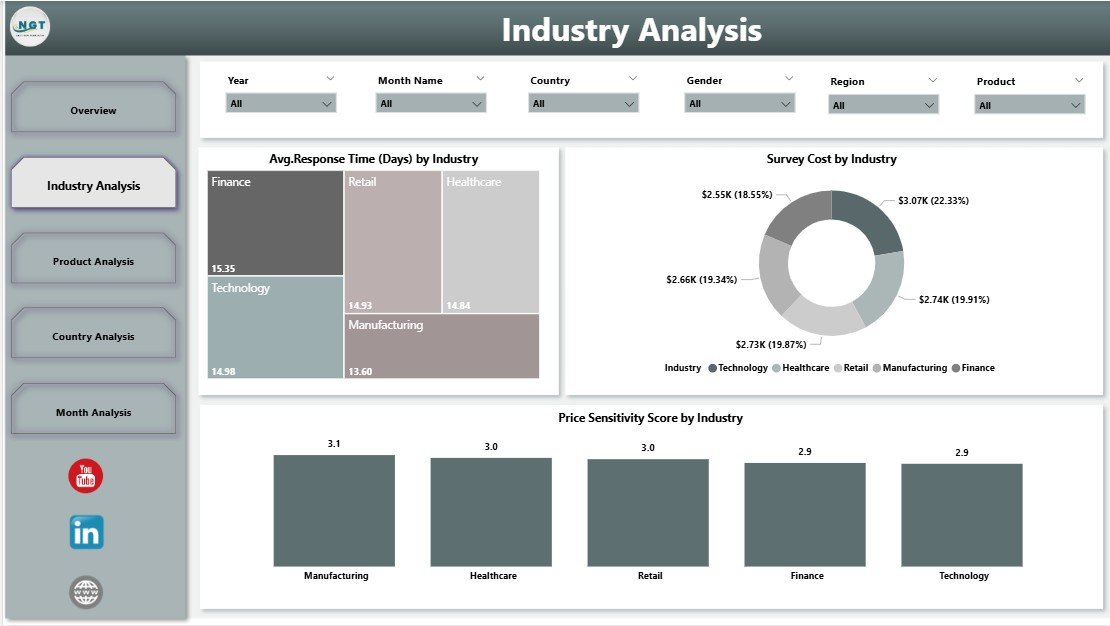
🏭 Industry Analysis Page
Compares survey metrics across industries to analyze:
-
Average Response Time by Industry
-
Survey Cost by Industry
-
Price Sensitivity Score by Industry
These insights help optimize industry-specific strategies.
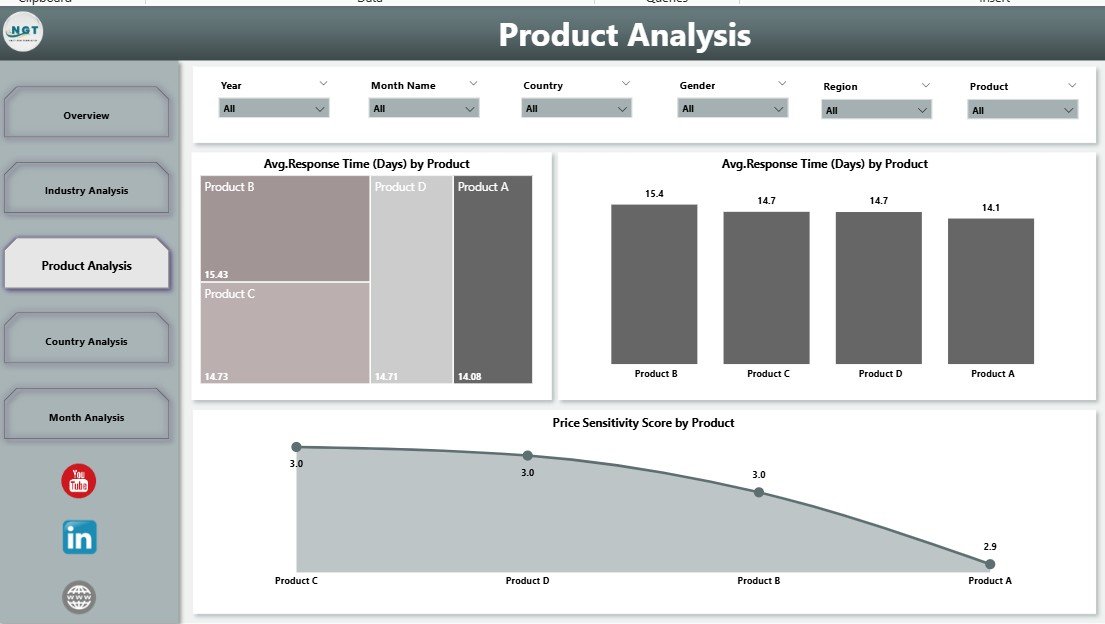
📦 Product Analysis Page
Focuses on product-level customer perception:
-
Average Response Time by Product
-
Price Sensitivity Score by Product
-
Customer Satisfaction Score by Product
Product teams use this page to refine features and pricing.
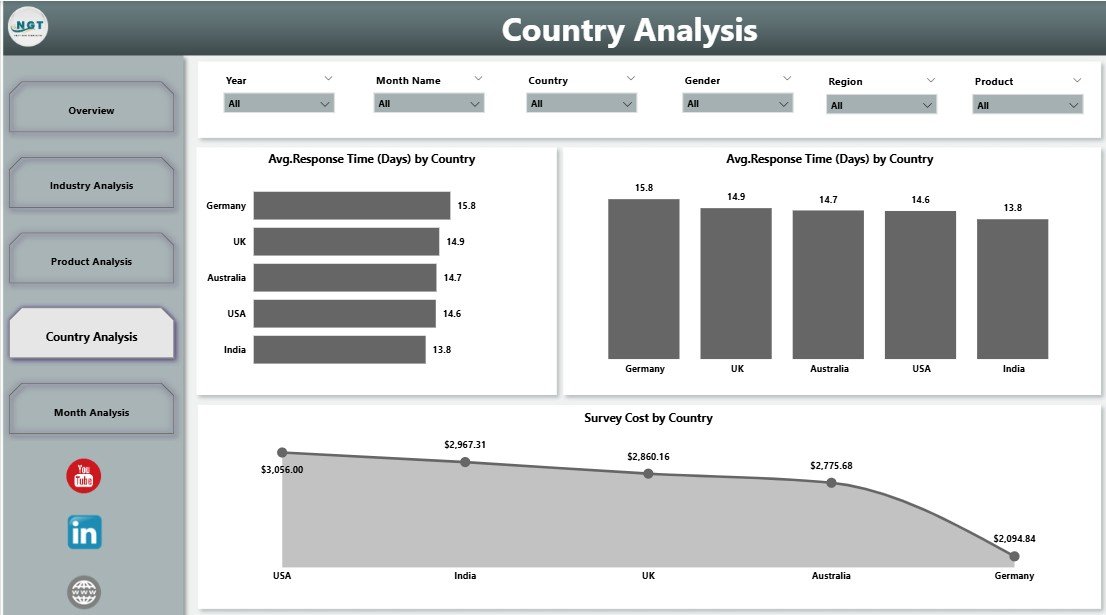
🌍 Country Analysis Page
Highlights regional differences using:
-
Average Response Time by Country
-
Customer Satisfaction Score by Country
-
Survey Cost by Country
This analysis supports region-specific marketing and pricing decisions.
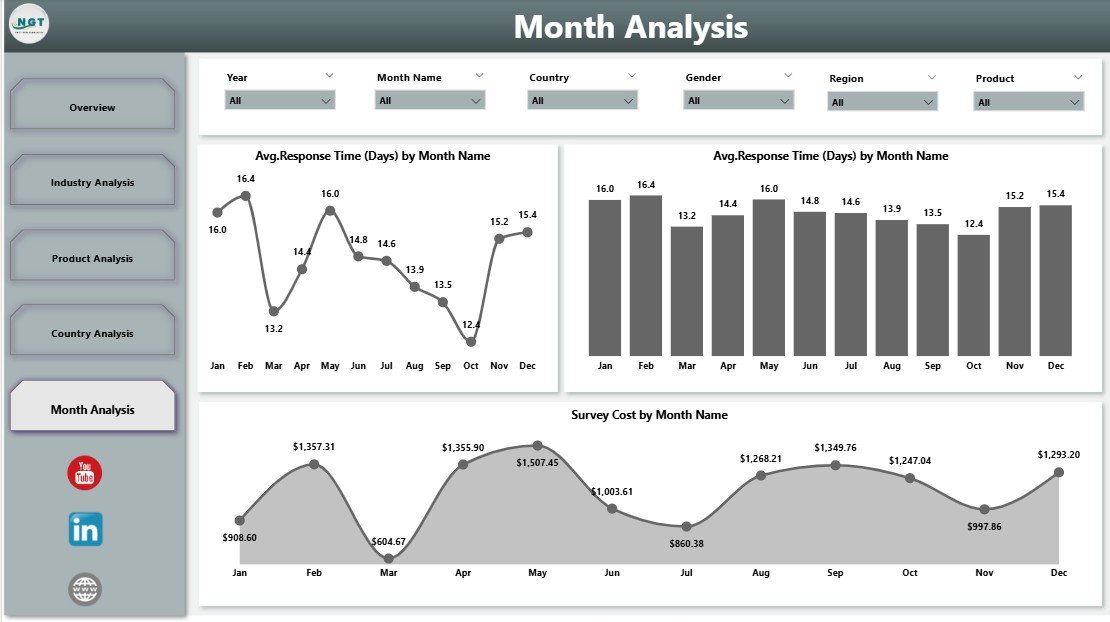
📆 Month Analysis Page
Tracks time-based trends to reveal seasonality:
-
Average Response Time by Month
-
Price Sensitivity Score by Month
-
Survey Cost by Month
With this view, teams anticipate trends instead of reacting late.
🛠️ How to Use the Market Research Dashboard in Power BI
✅ Connect survey data from Excel or other sources
✅ Refresh the dataset in Power BI
✅ Use slicers to filter by industry, product, country, or month
✅ Review KPIs and trends instantly
✅ Drill into visuals for deeper insights
No advanced Power BI skills are required. The dashboard is intuitive, clean, and business-ready.
👥 Who Can Benefit from This Market Research Dashboard?
📊 Market Research Analysts
📢 Marketing Managers
📦 Product Managers
🏢 Business Owners & Founders
🎯 Strategy & Consulting Teams
🤝 Customer Experience Teams
Whether managing small surveys or large research programs, this dashboard scales effortlessly.
👉 Click here to read the Detailed blog post
▶️ Visit our YouTube channel to learn step-by-step video tutorials
https://youtube.com/@PKAnExcelExpert


Reviews
There are no reviews yet.