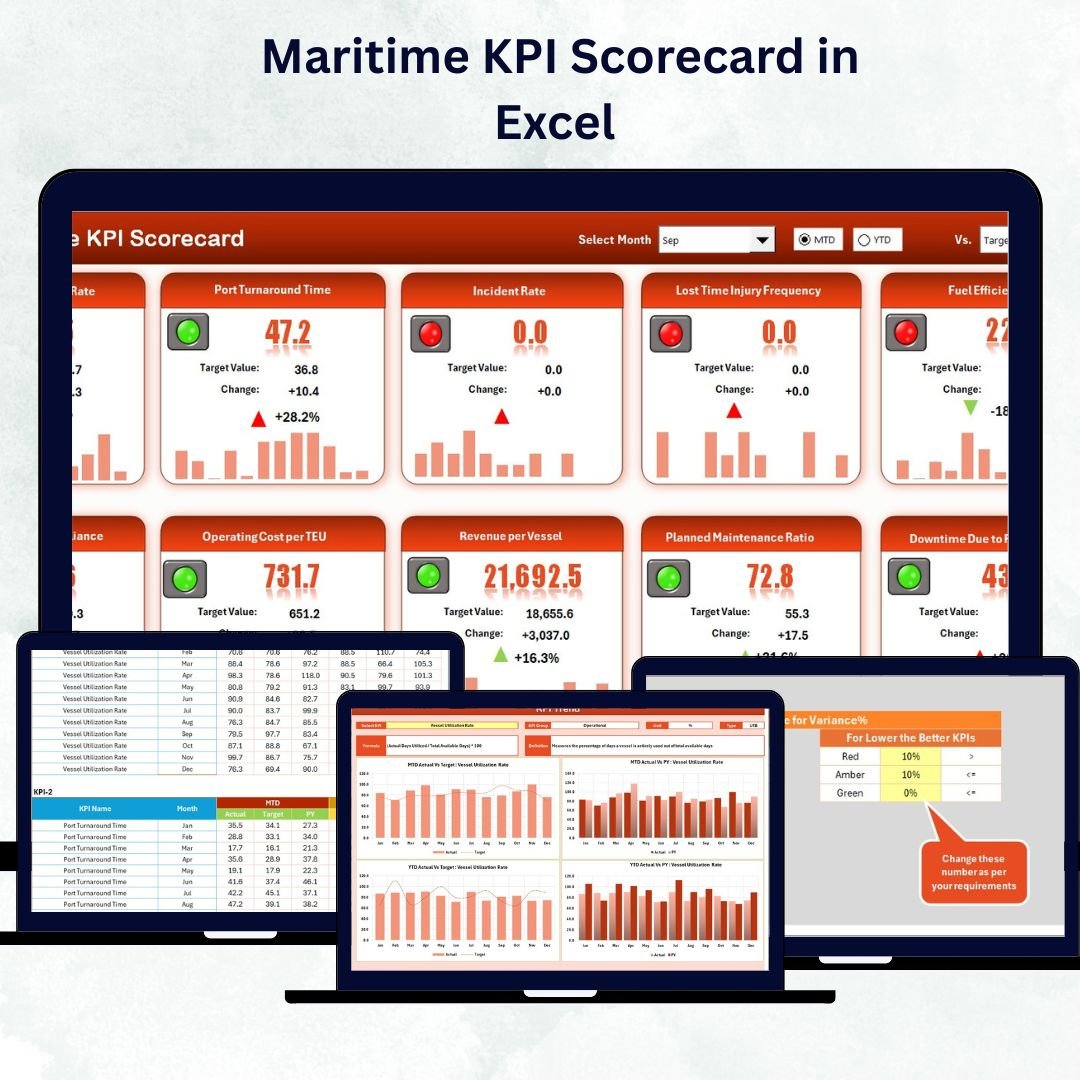
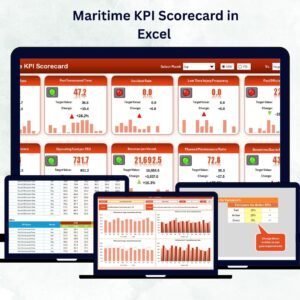
Tracking performance across shipping, logistics, and port operations can be challenging — but not anymore! 🚢 The Maritime KPI Scorecard in Excel is your all-in-one, ready-to-use solution to monitor operational efficiency, track targets, and visualize key performance indicators (KPIs) with ease.Maritime KPI Scorecard in Excel
Built for maritime professionals, this scorecard transforms raw data into actionable insights — empowering you to make quick, data-driven decisions that improve productivity, profitability, and compliance across all operations.
✨ Key Features of the Maritime KPI Scorecard in Excel
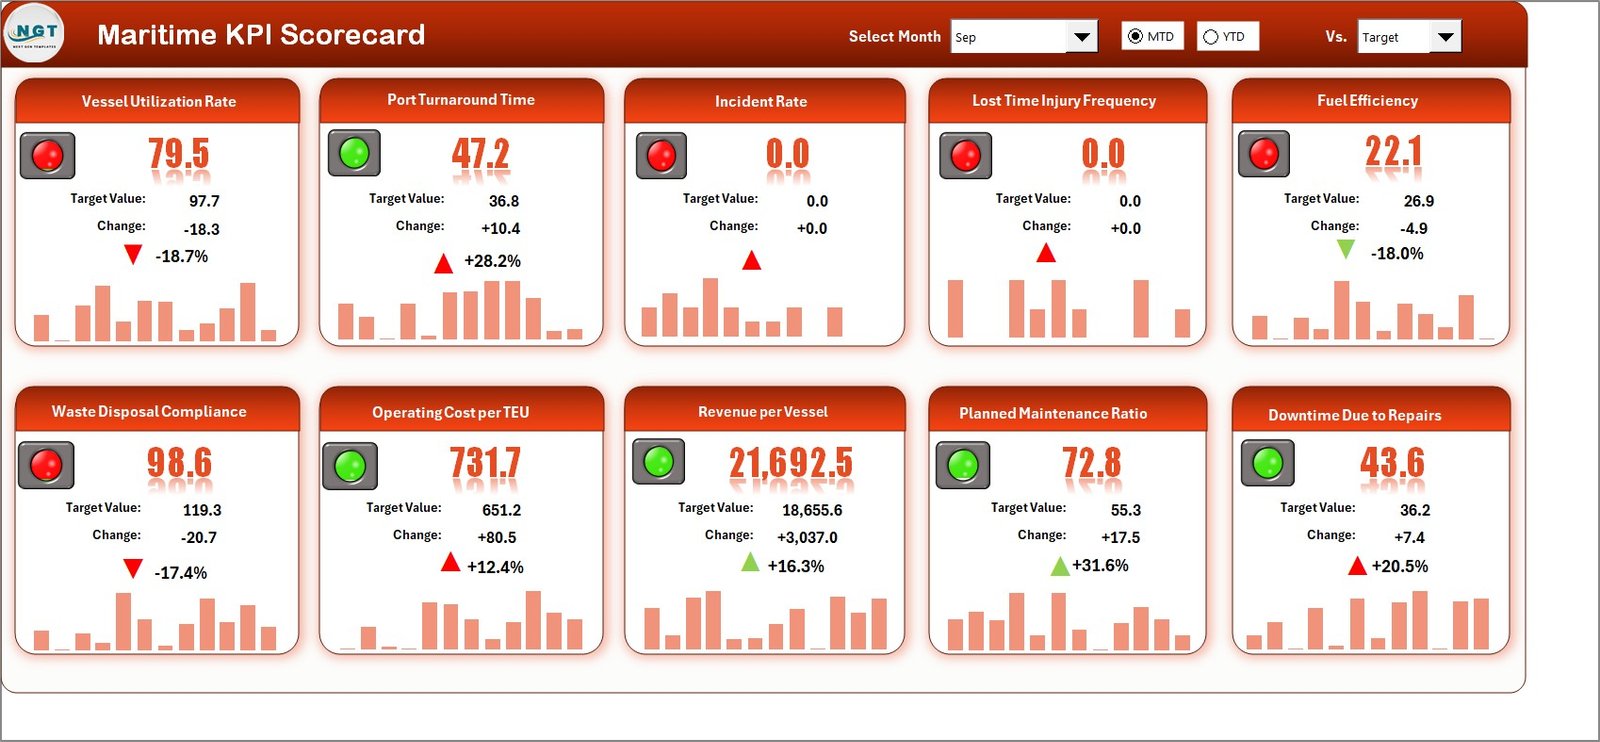
✅ Interactive Dashboard (Scorecard Sheet)
Monitor all your maritime KPIs in one place! View actual vs target values, color-coded indicators (🟢🟡🔴), and monthly or YTD performance — all through easy dropdowns.
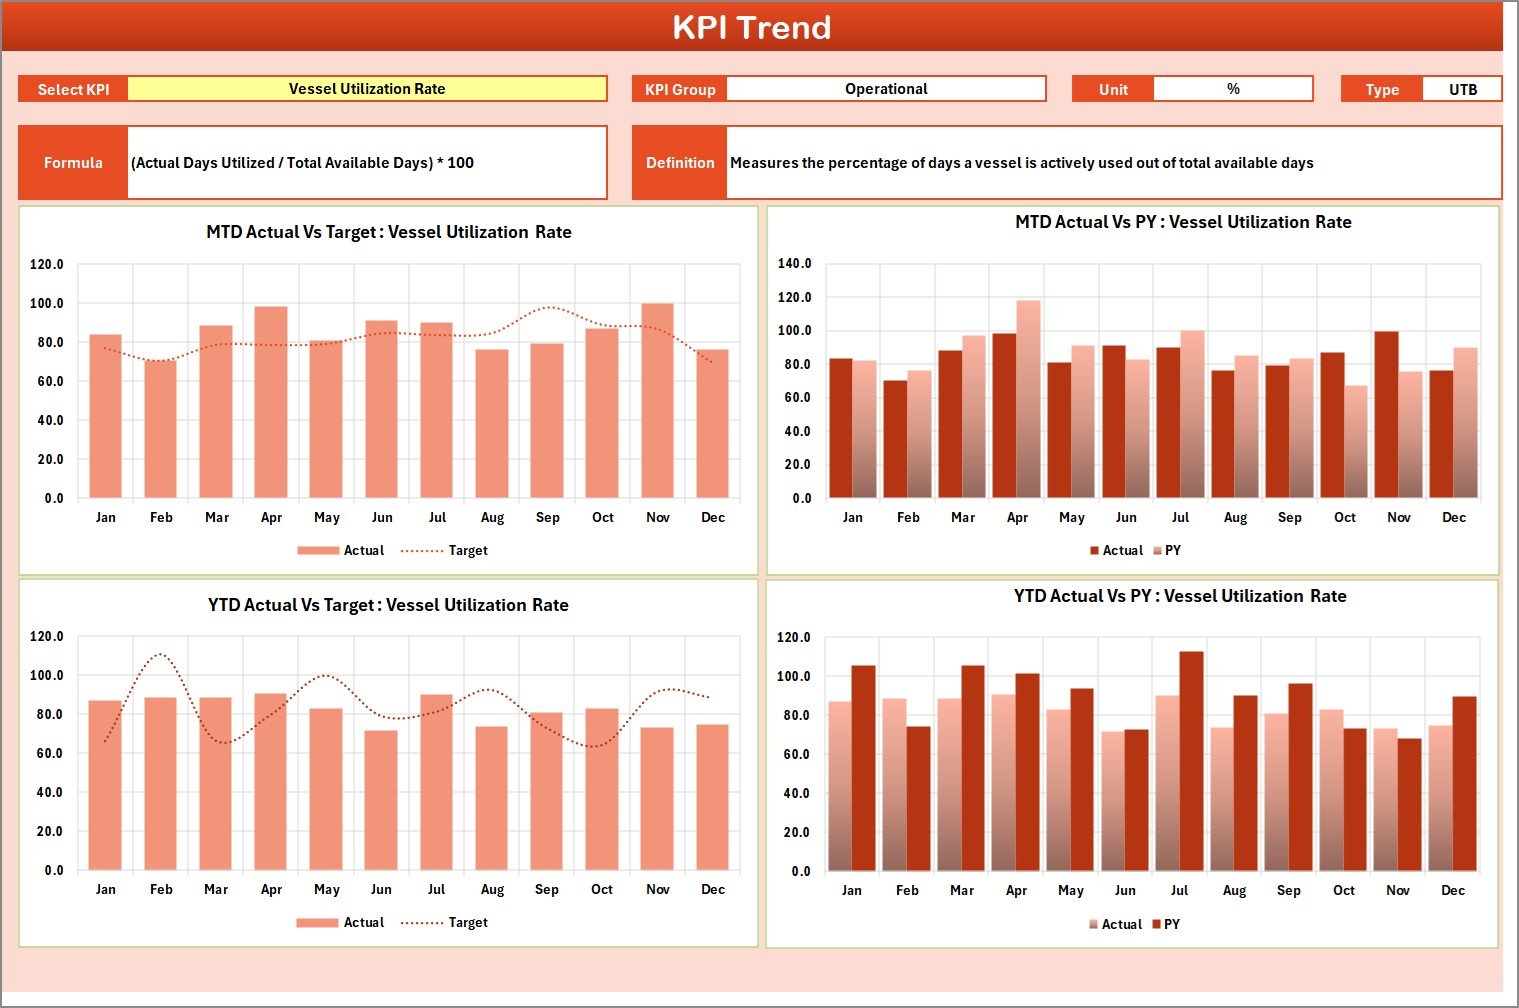
📊 Automatic Trend Analysis (KPI Trend Sheet)
Select any KPI from the dropdown to analyze its historical trends. Compare MTD, YTD, and Previous Year data to detect performance patterns effortlessly.
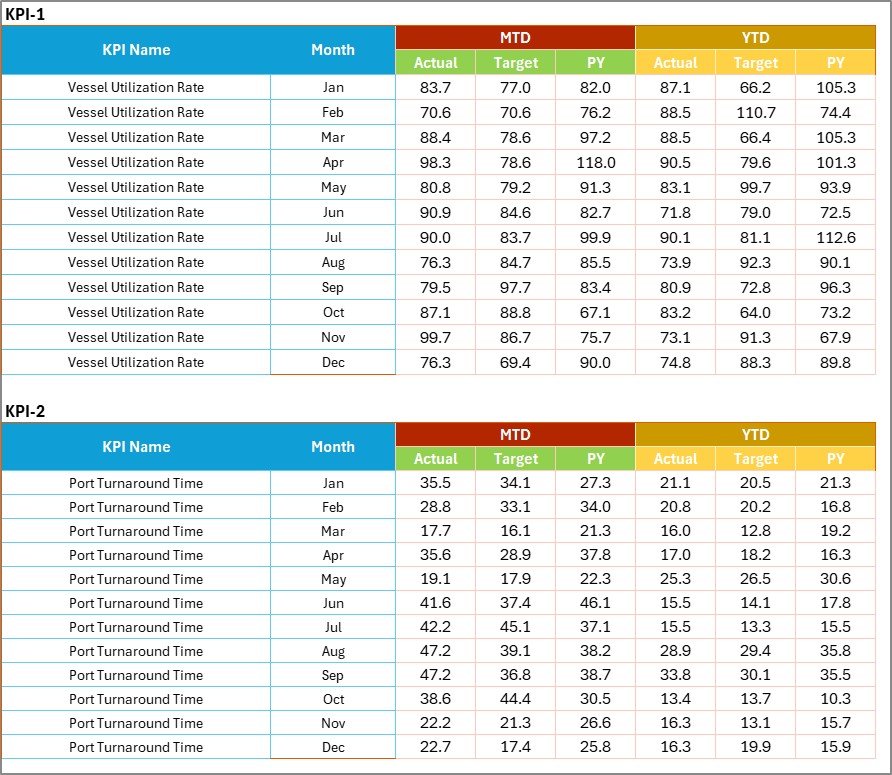
⚙️ Fully Editable Input Data Sheet
Enter actual, target, and previous year values in a prelinked structure. The sheet automatically updates all visuals and summaries — no formulas required!
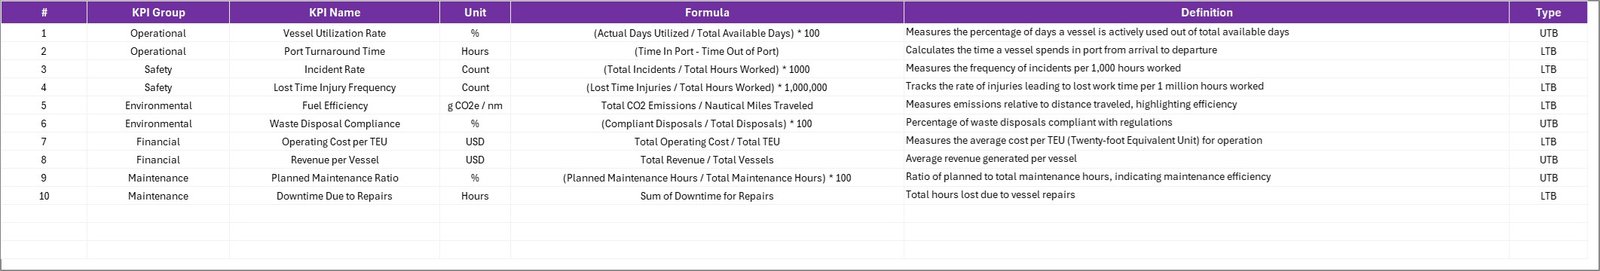
📘 Comprehensive KPI Definition Sheet
Document every KPI with its name, formula, definition, group, and type (UTB/LTB) for complete clarity and consistency across departments.
🚦 Visual Indicators for Quick Assessment
Green = On Track, Yellow = Needs Attention, Red = Off Target. Identify performance status instantly, even during meetings or reviews.
💡 Automation & Flexibility
Modify KPI groups, add your company logo, or integrate the file with Power BI for advanced visuals — everything is fully customizable.
📦 What’s Inside the Maritime KPI Scorecard in Excel
This Excel-based template includes 4 powerful worksheet tabs, each designed for precision and simplicity:
-
Scorecard Sheet (Main Dashboard) – Displays up to 10 KPIs with dropdowns to switch between MTD/YTD view.
-
KPI Trend Sheet – Visualize trends, compare Actual vs Target, and see year-over-year progress.
-
Input Data Sheet – Enter all performance data monthly with automatic updates and error alerts.
-
KPI Definition Sheet – Maintain consistent KPI definitions and formulas across teams.
Each sheet is intelligently connected, so any update in data reflects across the entire scorecard — ensuring accuracy and time savings ⏱️.
🧭 How to Use the Maritime KPI Scorecard in Excel
1️⃣ Define Your KPIs — List your operational indicators like Fuel Efficiency, Vessel Turnaround Time, Cargo Throughput, and On-Time Departures.
2️⃣ Input KPI Details — Add KPI names, formulas, and groups in the KPI Definition Sheet.
3️⃣ Enter Monthly Data — Fill in actual and target values in the Input Data Sheet.
4️⃣ View Dashboard Results — Open the Scorecard Sheet to instantly see how each KPI performs.
5️⃣ Analyze Trends — Use the KPI Trend Sheet to identify improvement areas over time.
💼 No advanced Excel skills required — the template is prebuilt with formulas, dropdowns, and visuals.
👥 Who Can Benefit from This Maritime KPI Scorecard
⚓ Fleet Managers — Track vessel efficiency and turnaround times.
🏗️ Port Authorities — Monitor cargo handling, logistics, and dock operations.
🧰 Marine Engineers — Review equipment downtime and maintenance KPIs.
🦺 Safety Officers — Track compliance and safety audit performance.
💰 Finance Teams — Evaluate cost efficiency, margins, and profitability trends.
📈 Executives & Analysts — Make data-backed decisions using performance visuals and insights.
This scorecard ensures transparency, accountability, and performance alignment across all maritime functions.


Reviews
There are no reviews yet.