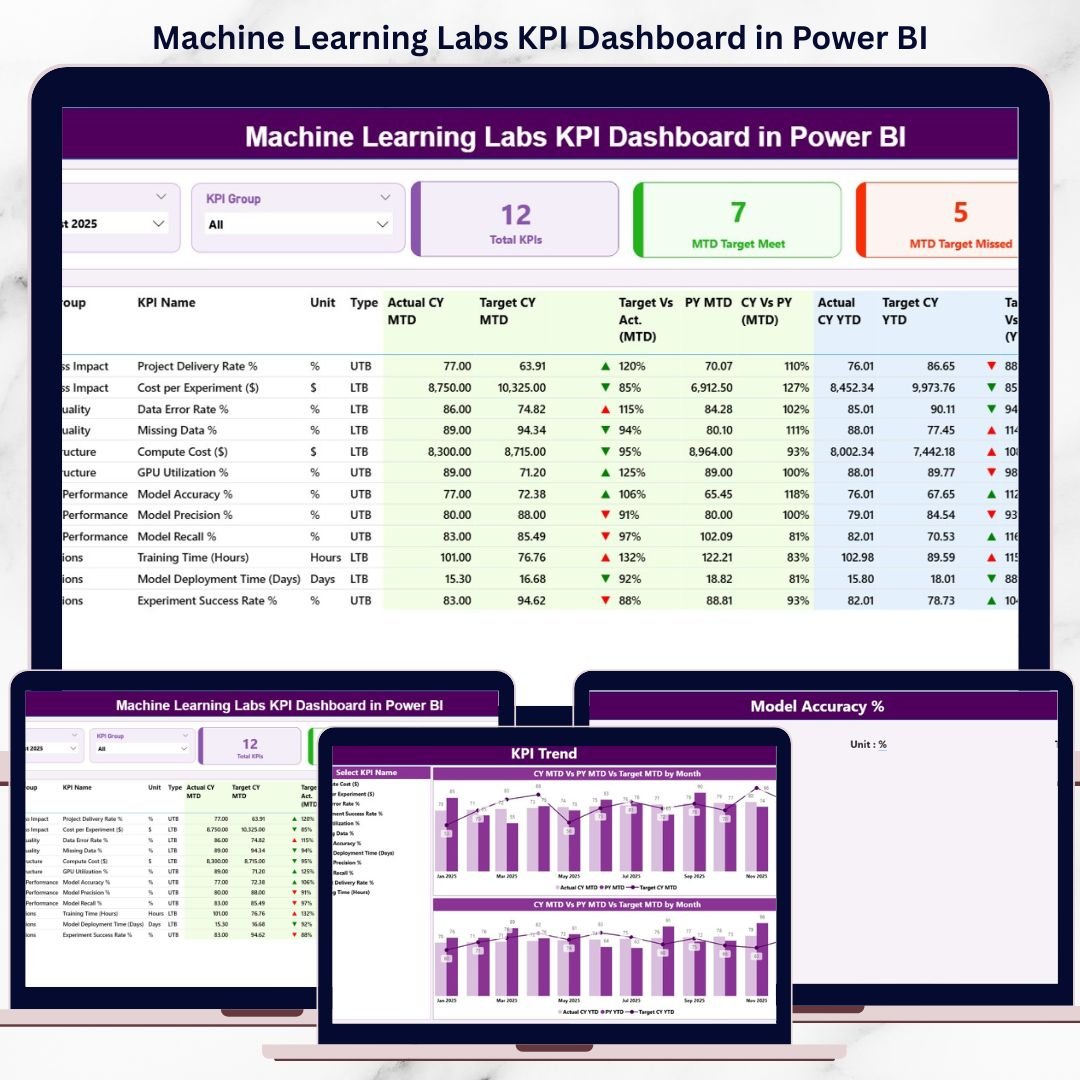
That is exactly where the Machine Learning Labs KPI Dashboard in Power BI becomes a powerful performance management solution 🚀. This ready-to-use dashboard transforms raw Excel-based KPI data into interactive visuals, clear comparisons, and trend-driven insights. Instead of manually compiling reports, ML leaders instantly understand how the lab is performing today and where corrective action is required.
Designed for machine learning labs, AI research teams, data science departments, and innovation hubs, this dashboard helps organizations track performance, align with targets, and improve operational efficiency—all from a single Power BI file.
🔑 Key Features of Machine Learning Labs KPI Dashboard in Power BI
🤖 Centralized KPI Monitoring for ML operations
📊 MTD & YTD Performance Tracking with target and previous-year comparison
🎯 Interactive Month & KPI Group Slicers for focused analysis
📈 Dedicated KPI Trend Analysis using combo charts
🔍 Drill-Through KPI Definitions for governance and clarity
🔄 Excel-Based Data Source for easy updates
⚡ Fast, Scalable Power BI Model for growing labs
🧩 Business-Friendly Design for technical and non-technical users
This dashboard delivers clarity, control, and confidence to machine learning performance tracking.
📂 What’s Inside the Machine Learning Labs KPI Dashboard
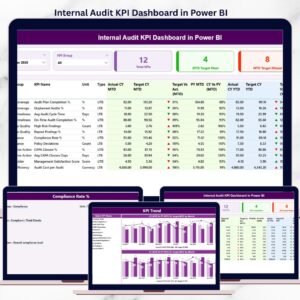
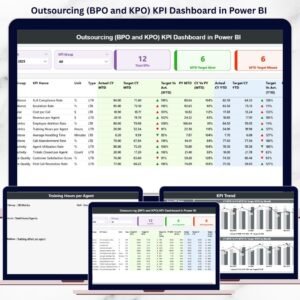
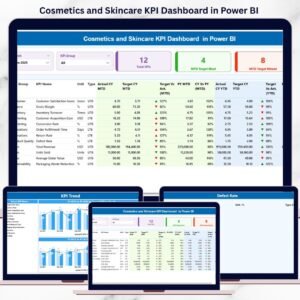
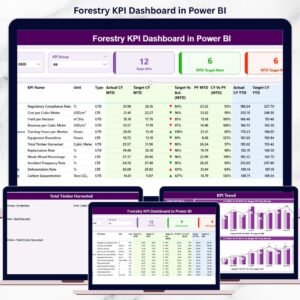
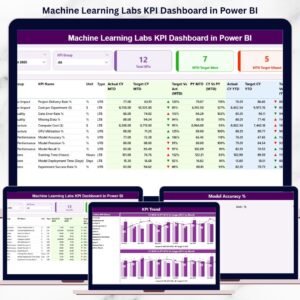
📊 Summary Page
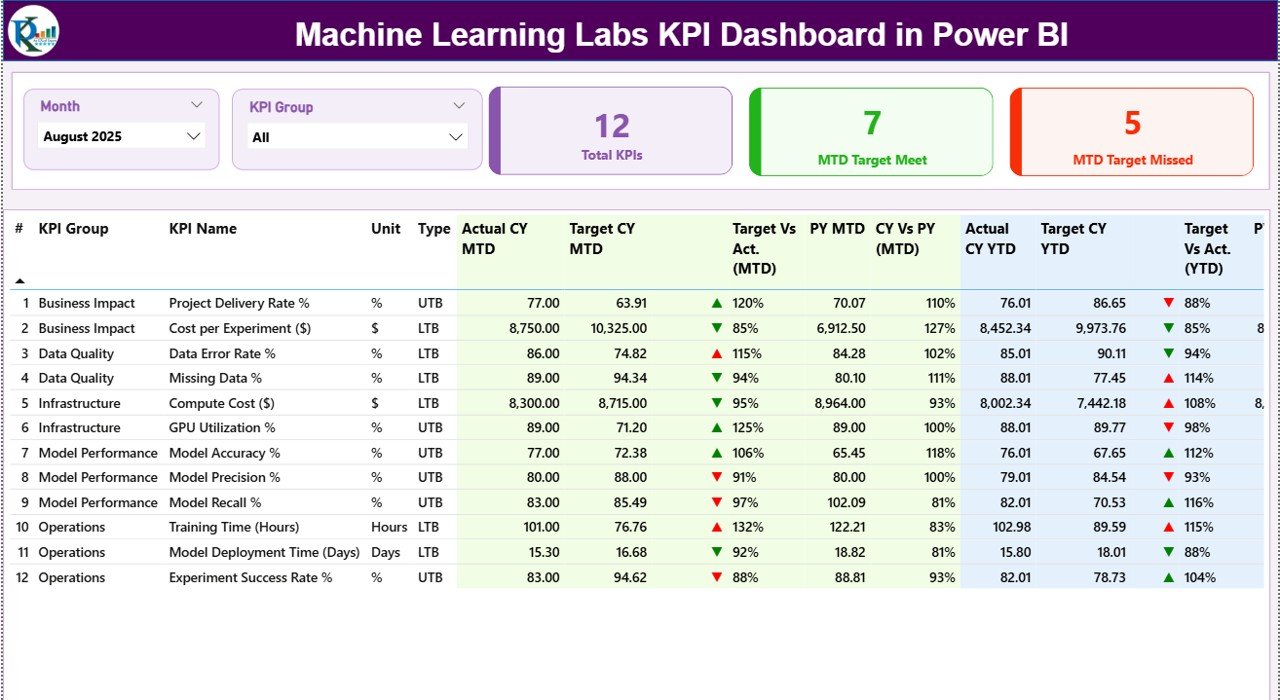
The main control center of the dashboard. It includes:
-
Month slicer and KPI Group slicer
-
KPI cards showing Total KPIs, MTD Target Met, and MTD Target Missed
-
A detailed KPI table displaying:
-
KPI Number, Group, Name, Unit, and Type (UTB/LTB)
-
MTD Actual, Target, Previous Year, and status icons
-
YTD Actual, Target, Previous Year, and variance indicators
-
Green ▲ and red ▼ icons instantly highlight performance gaps.
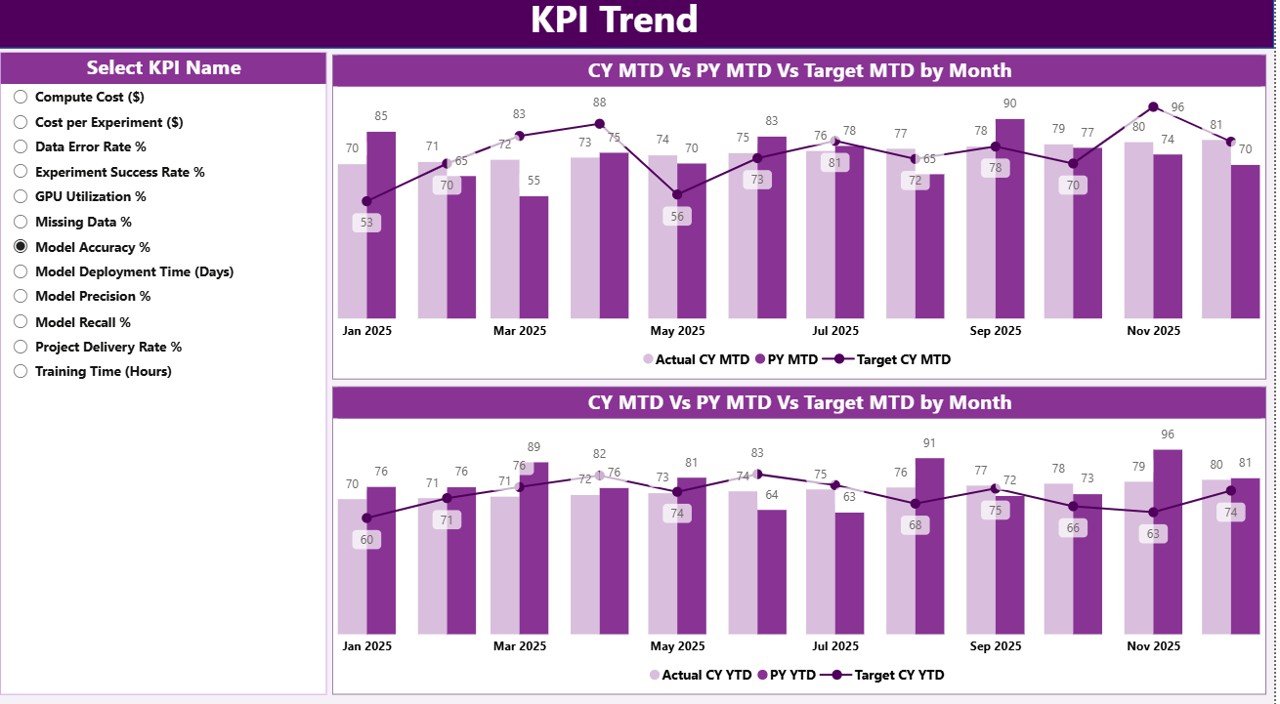
📈 KPI Trend Page
Focused on trend analysis instead of snapshots.
Users select a KPI name and analyze:
-
MTD trend (Actual vs Target vs Previous Year)
-
YTD trend (Actual vs Target vs Previous Year)
This page helps identify patterns, seasonality, and long-term performance movement.
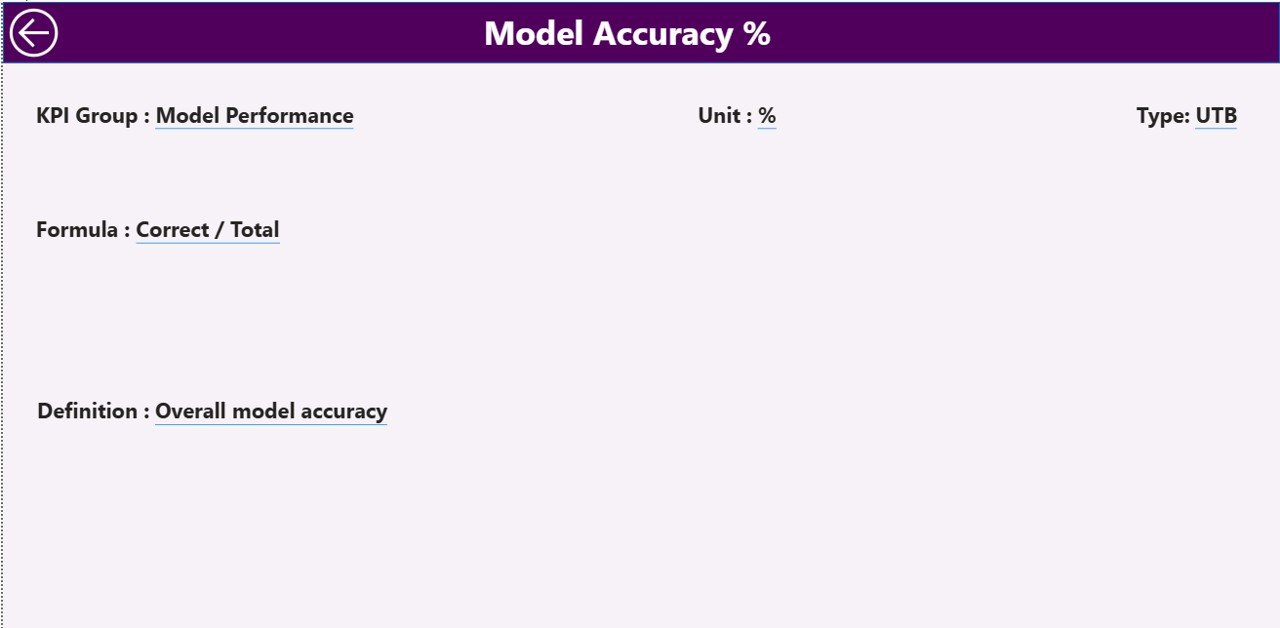
📘 KPI Definition Page (Drill-Through)
A governance and documentation layer.
From the Summary page, users drill through to view:
-
KPI Formula
-
KPI Definition
-
KPI Unit
-
KPI Type (LTB or UTB)
This ensures consistent KPI interpretation across teams.
🛠️ How to Use the Machine Learning Labs KPI Dashboard
✅ Update actual and target KPI values in Excel
✅ Refresh the dataset in Power BI
✅ Select month and KPI group using slicers
✅ Review MTD and YTD performance instantly
✅ Analyze trends and drill into KPI definitions
No advanced Power BI skills are required. The dashboard is clean, intuitive, and business-ready.
👥 Who Can Benefit from This Machine Learning Labs KPI Dashboard?
🤖 Machine Learning Lab Managers
📊 Data Science Team Leads
🧠 AI & Research Heads
🚀 Innovation & R&D Teams
📈 Analytics & Technology Managers
🏢 Senior Leadership & Executives
Whether managing small research labs or enterprise-scale AI teams, this dashboard adapts easily.
👉 Click here to read the Detailed blog post
▶️ Visit our YouTube channel to learn step-by-step video tutorials
https://youtube.com/@PKAnExcelExpert


Reviews
There are no reviews yet.