Luxury Goods Dashboard operate in an environment where brand value, precision, and profitability must coexist perfectly. While premium design and customer experience define luxury, data-driven decisions protect margins and sustain growth. However, when leadership teams rely on scattered spreadsheets or static reports, they lose visibility into revenue drivers, discount behavior, brand performance, and regional trends.
That is exactly where the Luxury Goods Dashboard in Power BI becomes a powerful competitive advantage 💎📊.
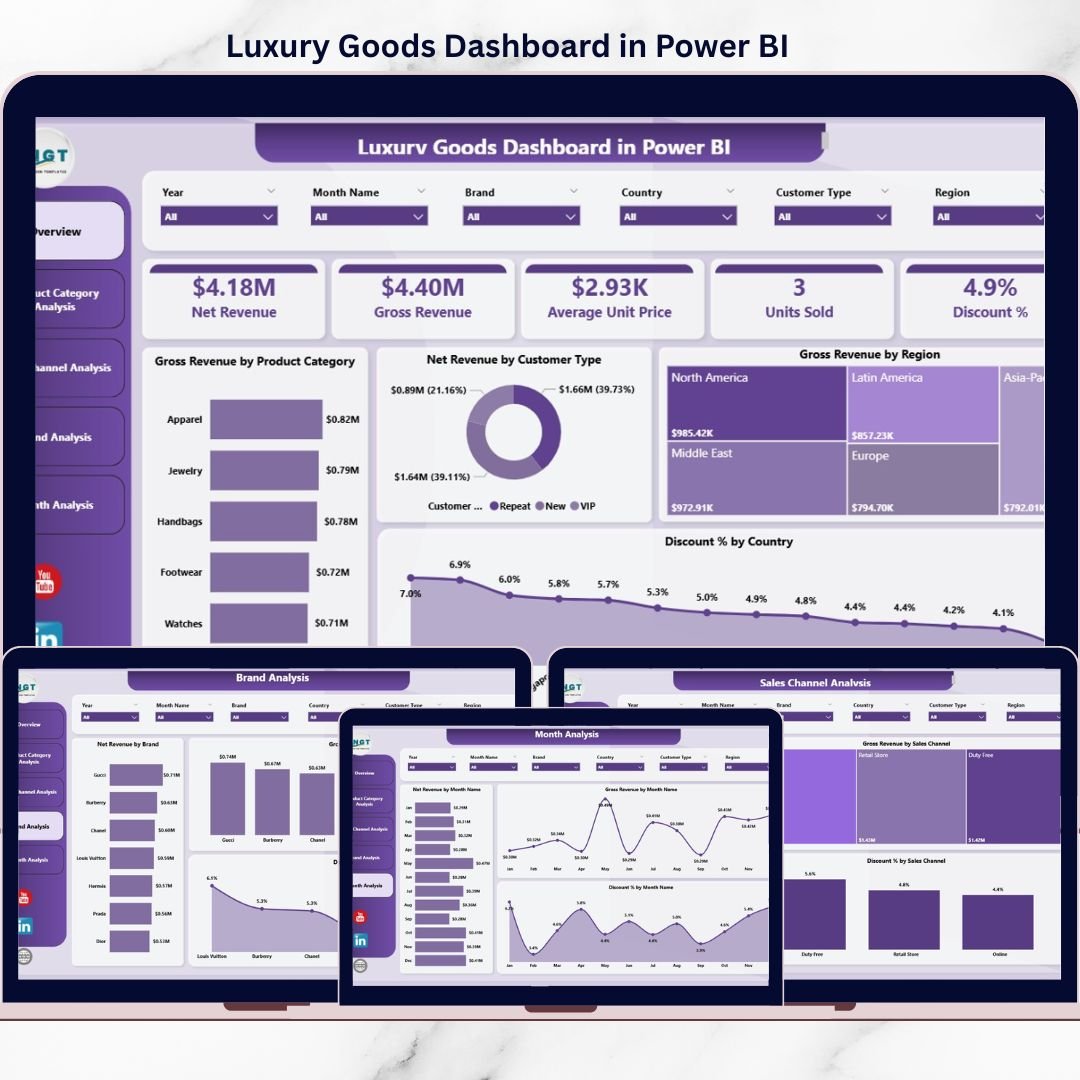
This ready-to-use Power BI dashboard transforms complex luxury sales data into clear KPIs, interactive visuals, and executive-level insights. Instead of switching between multiple reports, decision-makers get a single, centralized view of performance across brands, product categories, regions, sales channels, and time periods.
Built for speed, clarity, and control, this dashboard enables luxury brands to move from delayed reporting to real-time, confident decision-making.
## Key Features of Luxury Goods Dashboard in Power BI 🚀
This dashboard is designed specifically for the unique needs of luxury businesses.
📊 Centralized Luxury Performance View
Track gross revenue, net revenue, discounts, and performance metrics in one interactive dashboard.
🎛️ Dynamic Power BI Slicers
Filter insights instantly by month, product category, brand, region, country, or sales channel.
📈 Executive-Ready Visuals
Clean, professional charts and cards designed for leadership reviews and strategy meetings.
📉 Discount Control Analytics
Monitor discount percentages across brands, categories, channels, and countries to protect brand value.
🏷️ Brand-Level Performance Insights
Compare brand-wise revenue, pricing strength, and discount dependency.
🌍 Region & Country Analysis
Understand geographic performance and identify high-growth or high-risk markets.
📅 Monthly Trend Analysis
Track seasonal patterns, campaign impact, and long-term revenue trends.
⚡ Scalable Power BI Solution
Handles large datasets efficiently while remaining fast and responsive.
## What’s Inside the Luxury Goods Dashboard in Power BI 📂
This dashboard includes five structured and purpose-built pages, each answering a specific business question.
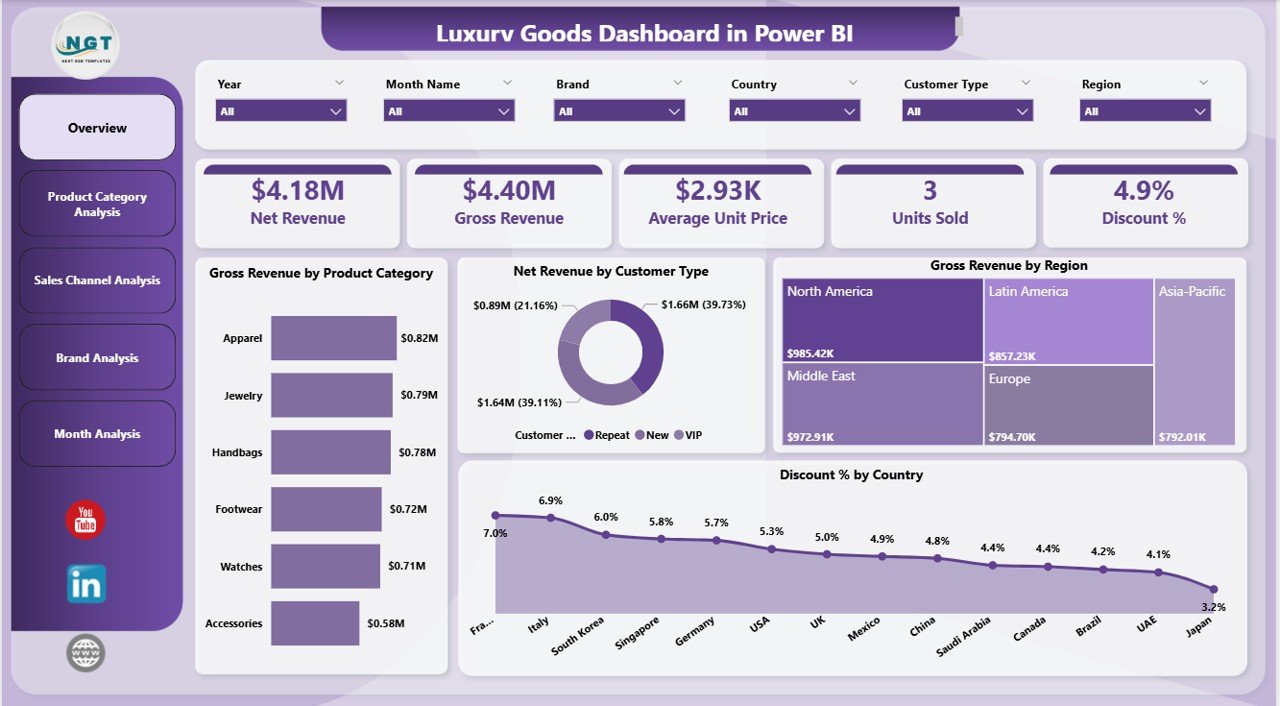
🟦 Overview Page
Acts as the command center, showing high-level performance through visuals like Gross Revenue by Category, Net Revenue by Customer Type, Gross Revenue by Region, and Discount % by Country.
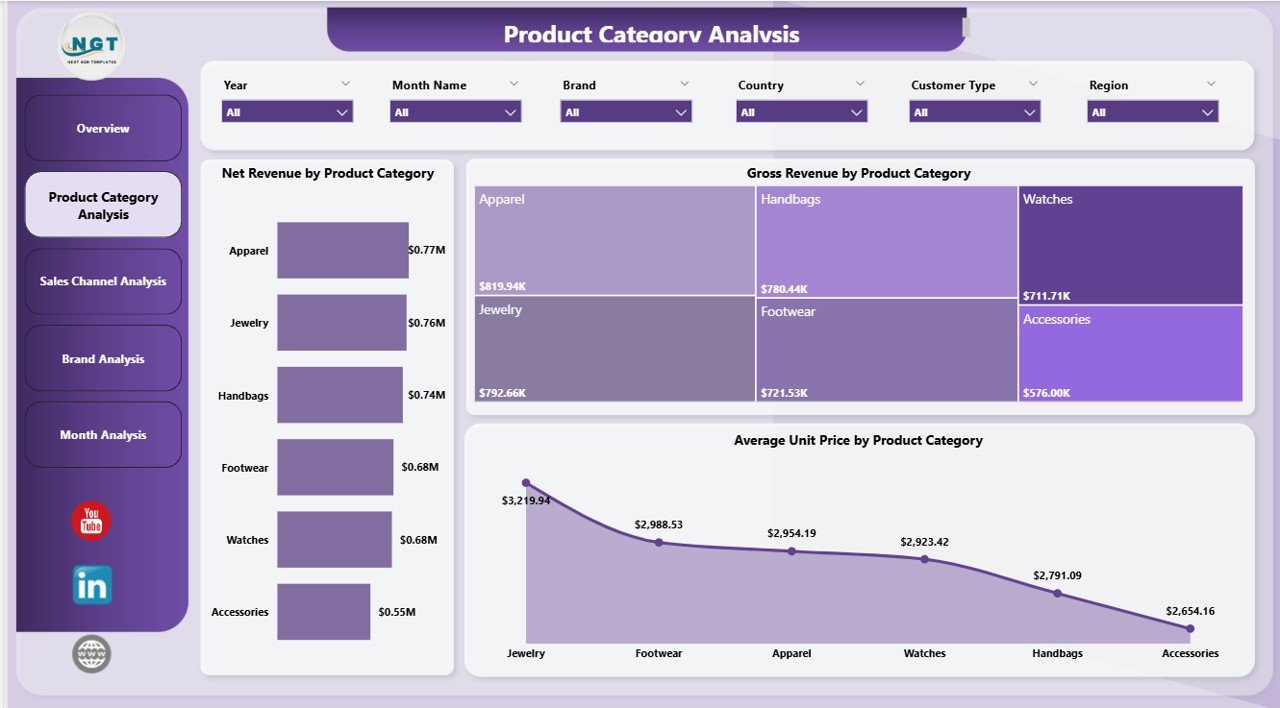
🟦 Product Category Analysis Page
Compares net revenue, average unit price, and discount percentage across luxury product categories.
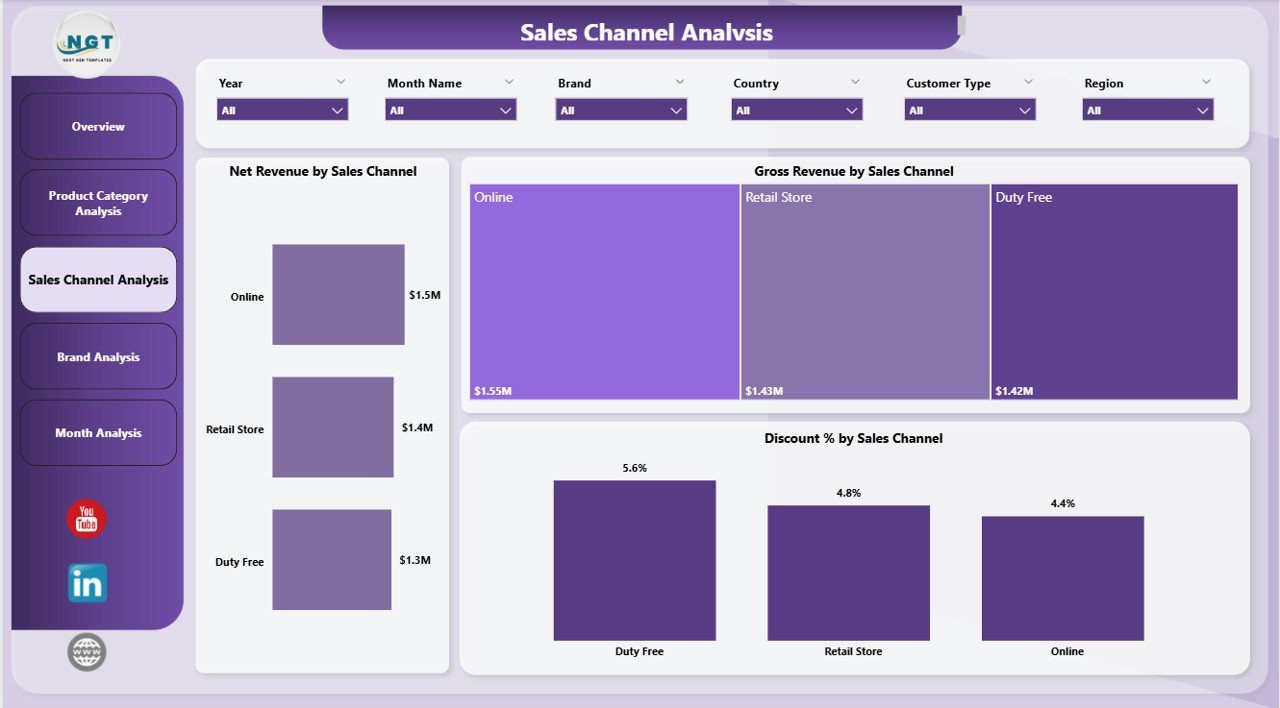
🟦 Sales Channel Analysis Page
Evaluates channel-wise performance to understand how retail, online, and partner channels contribute to revenue and discounts.
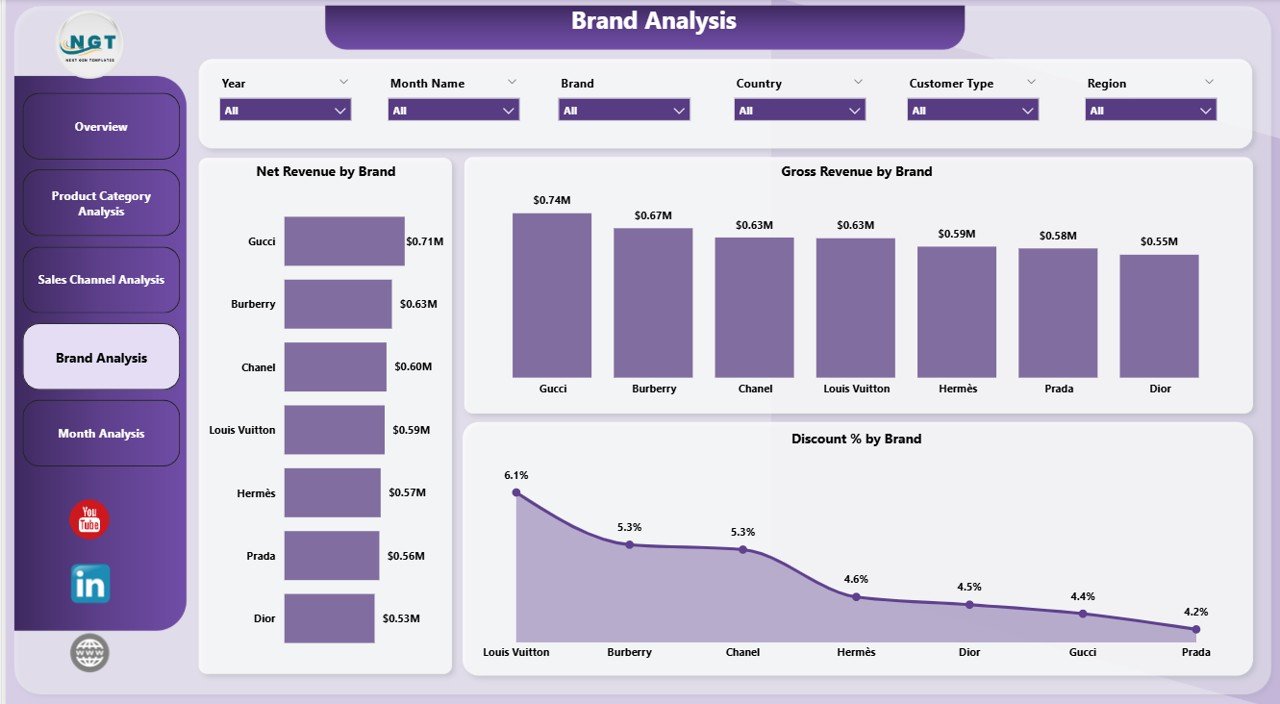
🟦 Brand Analysis Page
Provides brand-level insights for gross revenue, net revenue, and discount exposure, helping leaders optimize brand portfolios.
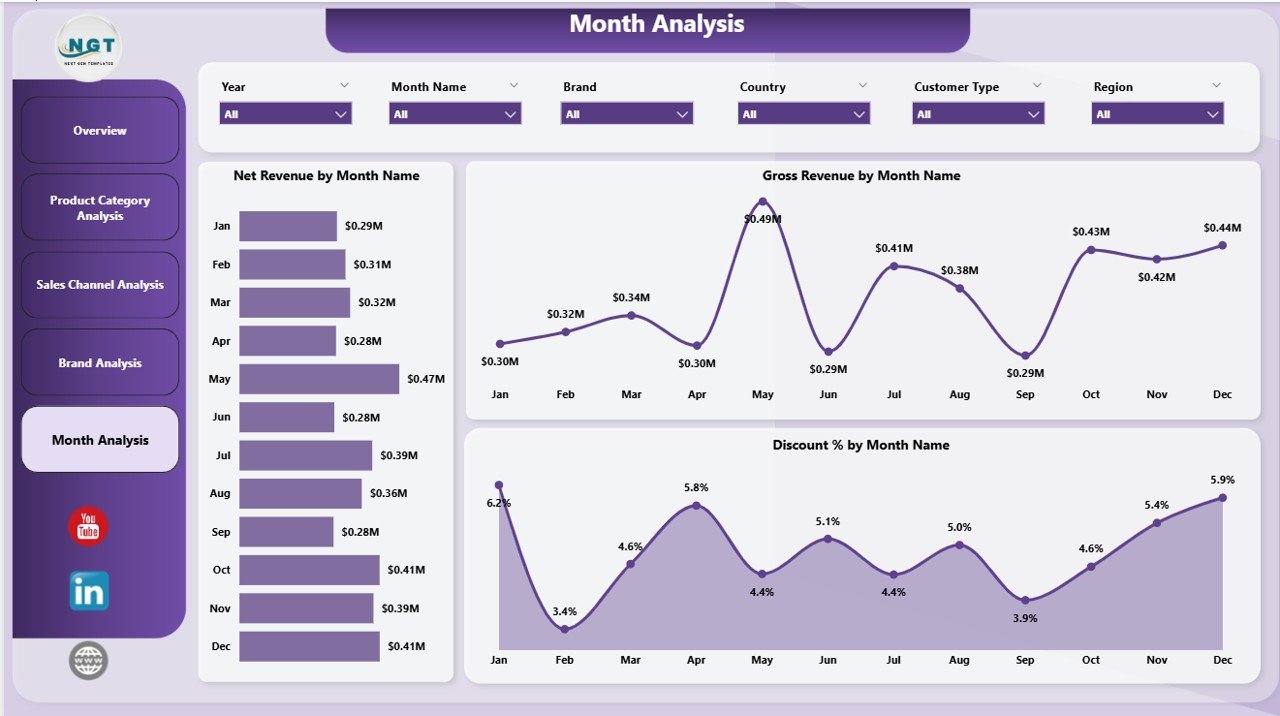
🟦 Month Analysis Page
Tracks monthly trends for revenue and discount percentage to identify seasonality and campaign effects.
Together, these pages deliver a complete luxury business intelligence framework.
## How to Use the Luxury Goods Dashboard in Power BI 🧩
Using the dashboard is simple and efficient:
1️⃣ Load or connect your luxury sales data
2️⃣ Refresh the Power BI report
3️⃣ Apply slicers to filter insights dynamically
4️⃣ Review KPIs, charts, and trends
5️⃣ Use insights to optimize pricing, discounts, and strategy
Power BI handles all calculations and visuals automatically—allowing teams to focus on strategy, not reporting.
## Who Can Benefit from This Luxury Goods Dashboard in Power BI 👥
This dashboard is ideal for:
✔️ Luxury Brand Owners & Founders
✔️ Sales & Revenue Leaders
✔️ Brand & Category Managers
✔️ Marketing & Pricing Teams
✔️ Finance & Strategy Teams
✔️ Business Analysts & Consultants
Whether managing a single luxury brand or a global portfolio, this dashboard adapts effortlessly.
### Click here to read the Detailed blog post
Visit our YouTube channel to learn step-by-step video tutorials
👉 YouTube.com/@PKAnExcelExpert


Reviews
There are no reviews yet.