
Managing loan recovery operations without real-time visibility often results in delayed actions, rising legal costs, lower recovery rates, and growing outstanding exposure. When recovery teams depend on scattered spreadsheets or manual reports, decision-making becomes slow, reactive, and inefficient. That is exactly why the Loan Recovery Services Dashboard in Excel becomes a powerful, practical, and business-ready solution for financial institutions.
The Loan Recovery Services Dashboard in Excel is a ready-to-use analytical Excel dashboard designed to track, monitor, and analyze loan recovery performance from a single centralized file. Instead of switching between multiple reports, this dashboard transforms raw recovery data into clear KPIs, interactive charts, slicers, and trend insights that recovery managers and leadership teams can understand instantly.
Built entirely in Microsoft Excel, this dashboard is cost-effective, flexible, and easy to use—without requiring advanced Excel knowledge or expensive BI tools. It helps organizations improve recovery efficiency, control legal costs, reduce outstanding exposure, and make faster, data-driven decisions.
⭐ Key Features of Loan Recovery Services Dashboard in Excel
📊 Centralized Loan Recovery KPIs – One dashboard for all recovery metrics
💰 Outstanding vs Recovered Analysis – Clear exposure visibility
⚖️ Legal Cost Monitoring – Control recovery expenses
📍 Region, Loan & Method Analysis – Multi-dimensional insights
📅 Monthly Recovery Trends – Identify performance patterns
🎛️ Interactive Slicers – Filter by region, loan type, method, month
📈 Pivot-Based Charts & KPI Cards – Fast and accurate insights
⚙️ 100% Excel-Based Solution – No external software required
📦 What’s Inside the Loan Recovery Services Dashboard
This dashboard is designed with multiple analytical pages, each focused on a specific recovery perspective.
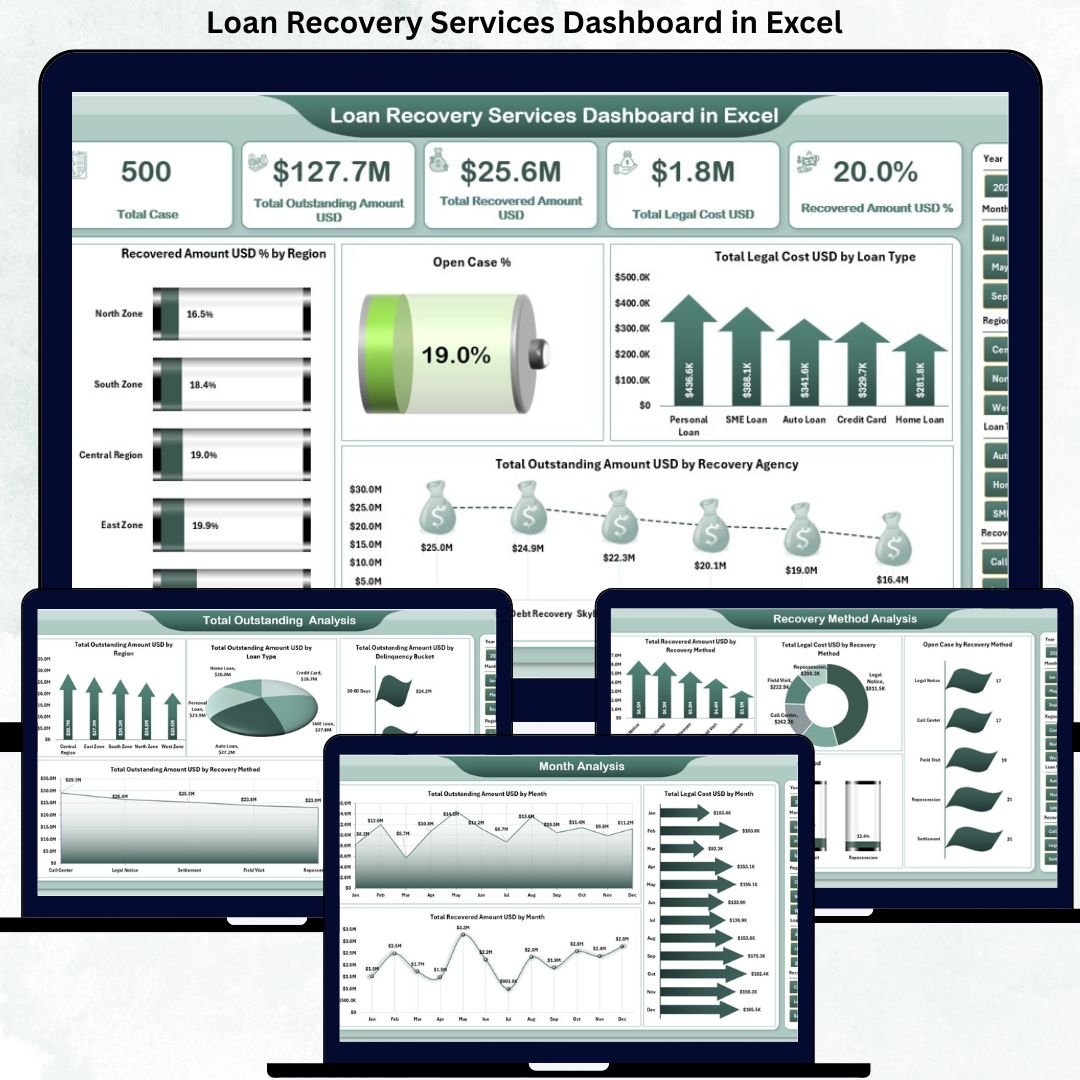
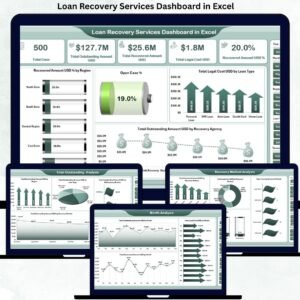
📌 Overview Page

The Overview Page provides a high-level snapshot of overall recovery performance.
You get:
-
KPI Cards, including:
-
Recovered Amount %
-
Open Case %
-
Total Legal Cost (USD)
-
Total Outstanding Amount (USD)
-
Total Recovered Amount (USD)
-
-
Right-side slicers for instant filtering
-
Strategic charts, such as:
-
Recovered Amount % by Region
-
Open Case % by Region
-
Legal Cost by Loan Type
-
Outstanding Amount by Recovery Agency
-
This page allows leadership to assess recovery effectiveness at a glance.
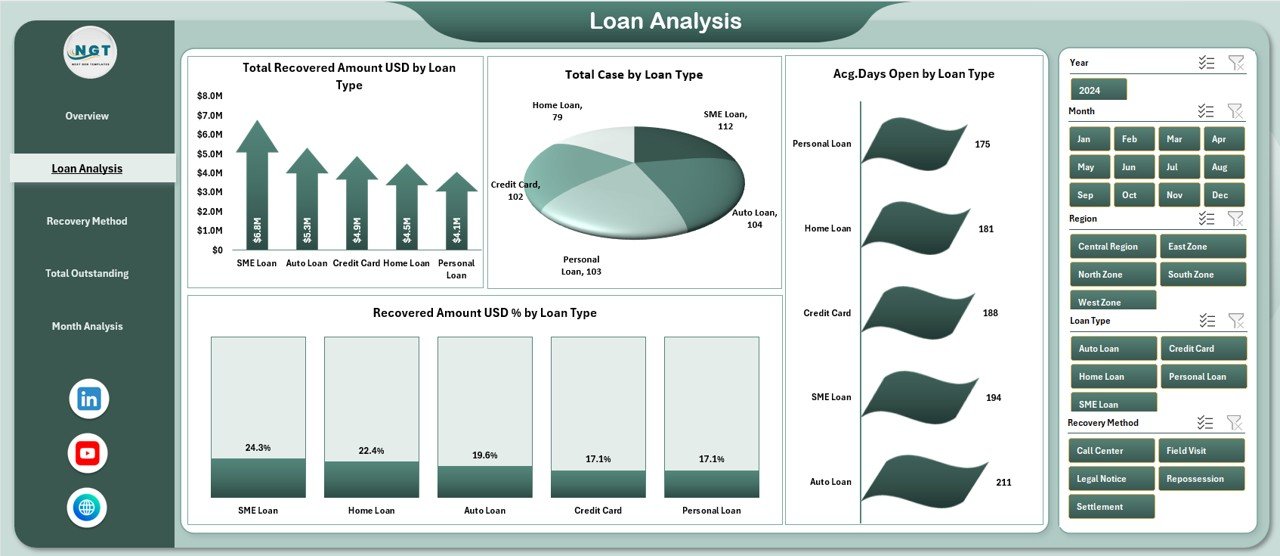
📄 Loan Analysis Page
This page evaluates recovery performance by loan category.
Charts include:
-
Total Recovered Amount by Loan Type
-
Total Cases by Loan Type
-
Average Days Open by Loan Type
-
Recovered Amount % by Loan Type
It helps teams identify high-risk loan categories and optimize recovery focus.
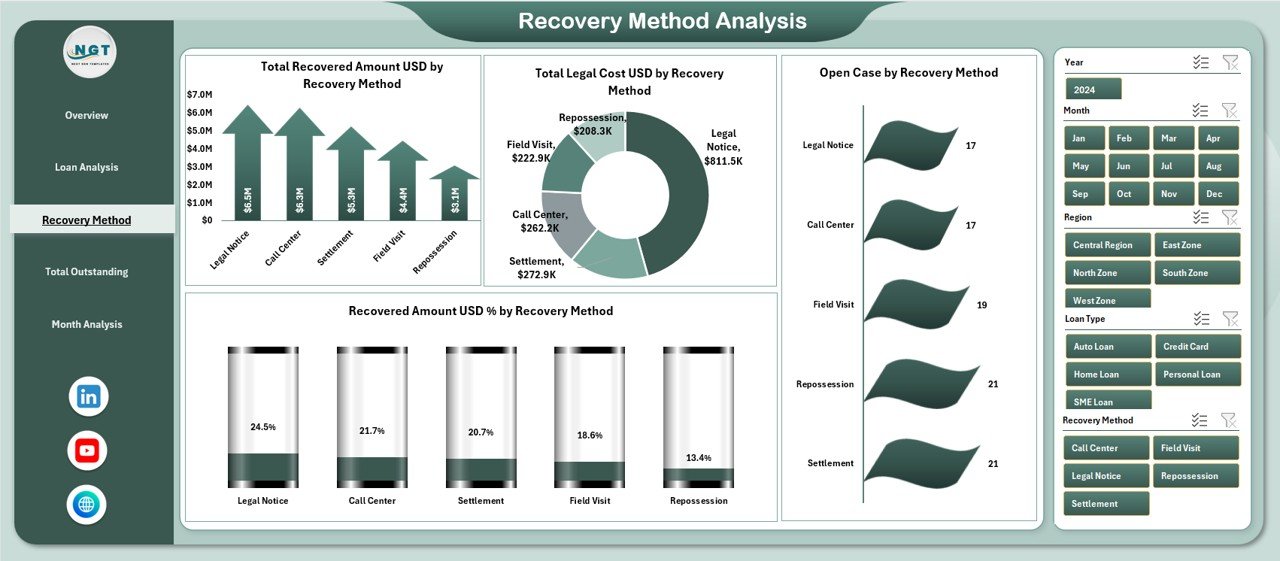
🔁 Recovery Method Analysis Page
This page analyzes recovery efficiency by recovery method.
Charts include:
-
Total Recovered Amount by Recovery Method
-
Total Legal Cost by Recovery Method
-
Open Cases by Recovery Method
-
Recovered Amount % by Recovery Method
As a result, organizations can prioritize cost-effective recovery approaches.
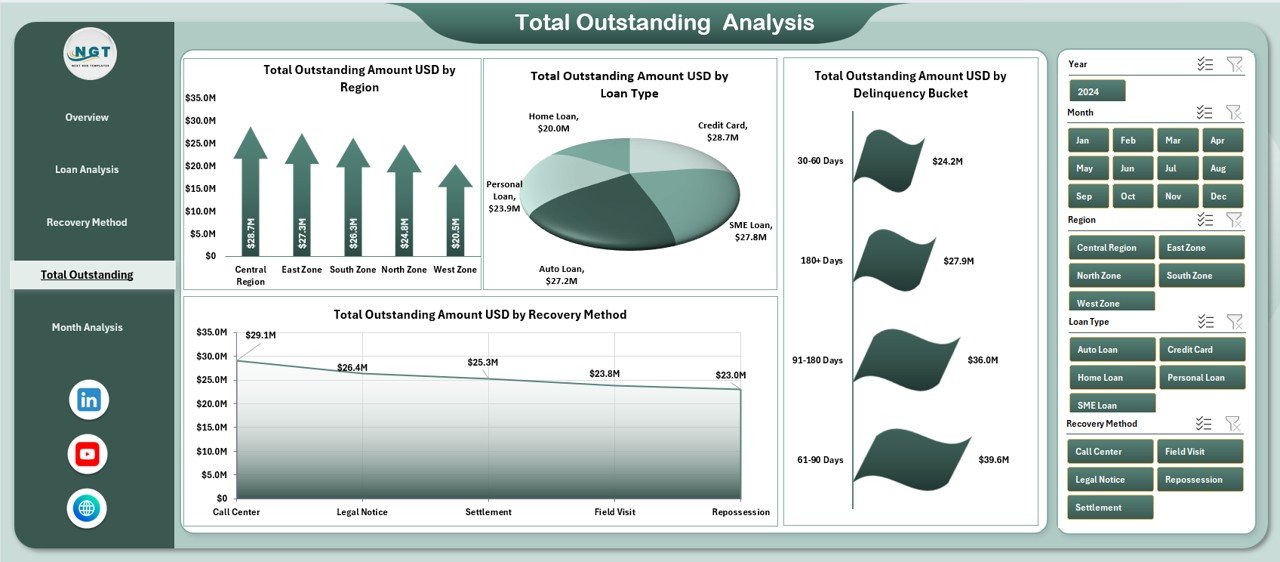
💼 Total Outstanding Analysis Page
This page highlights pending exposure across multiple dimensions.
Charts include:
-
Outstanding Amount by Region
-
Outstanding Amount by Loan Type
-
Outstanding Amount by Delinquency Bucket
-
Outstanding Amount by Recovery Method
It supports risk prioritization and targeted recovery planning.
📅 Month Analysis Page
This page tracks recovery trends over time.
Charts include:
-
Outstanding Amount by Month
-
Legal Cost by Month
-
Recovered Amount by Month
It helps managers identify seasonal patterns and cost spikes early.
⚙️ Backend Sheets
-
Data Sheet – Stores raw recovery data
-
Support Sheet – Handles calculations and mappings
These ensure accuracy, stability, and easy maintenance.
🛠️ How to Use the Loan Recovery Services Dashboard
1️⃣ Update recovery data in the Data Sheet
2️⃣ Refresh pivot tables (if required)
3️⃣ Use slicers to filter by region, loan type, or method
4️⃣ Review KPIs and charts
5️⃣ Take faster, data-driven recovery actions
👥 Who Can Benefit from This Dashboard
-
Loan Recovery Teams
-
Banks & NBFCs
-
Collection Agencies
-
Finance & Risk Managers
-
Legal & Compliance Teams
-
Senior Leadership
It works for small portfolios as well as large-scale recovery operations.
### 📘 Click here to read the Detailed blog post
📺 Visit our YouTube channel to learn step-by-step video tutorials
👉 https://youtube.com/@PKAnExcelExpert


Reviews
There are no reviews yet.