Legal research is at the heart of strong case preparation, accurate compliance decisions, and reliable legal opinions. However, many legal teams still track research performance using disconnected Excel files, emails, or static reports. As a result, productivity gaps remain hidden, targets are missed, and leadership lacks a clear performance picture.
That is exactly where the Legal Research KPI Dashboard in Power BI becomes a game-changing solution.
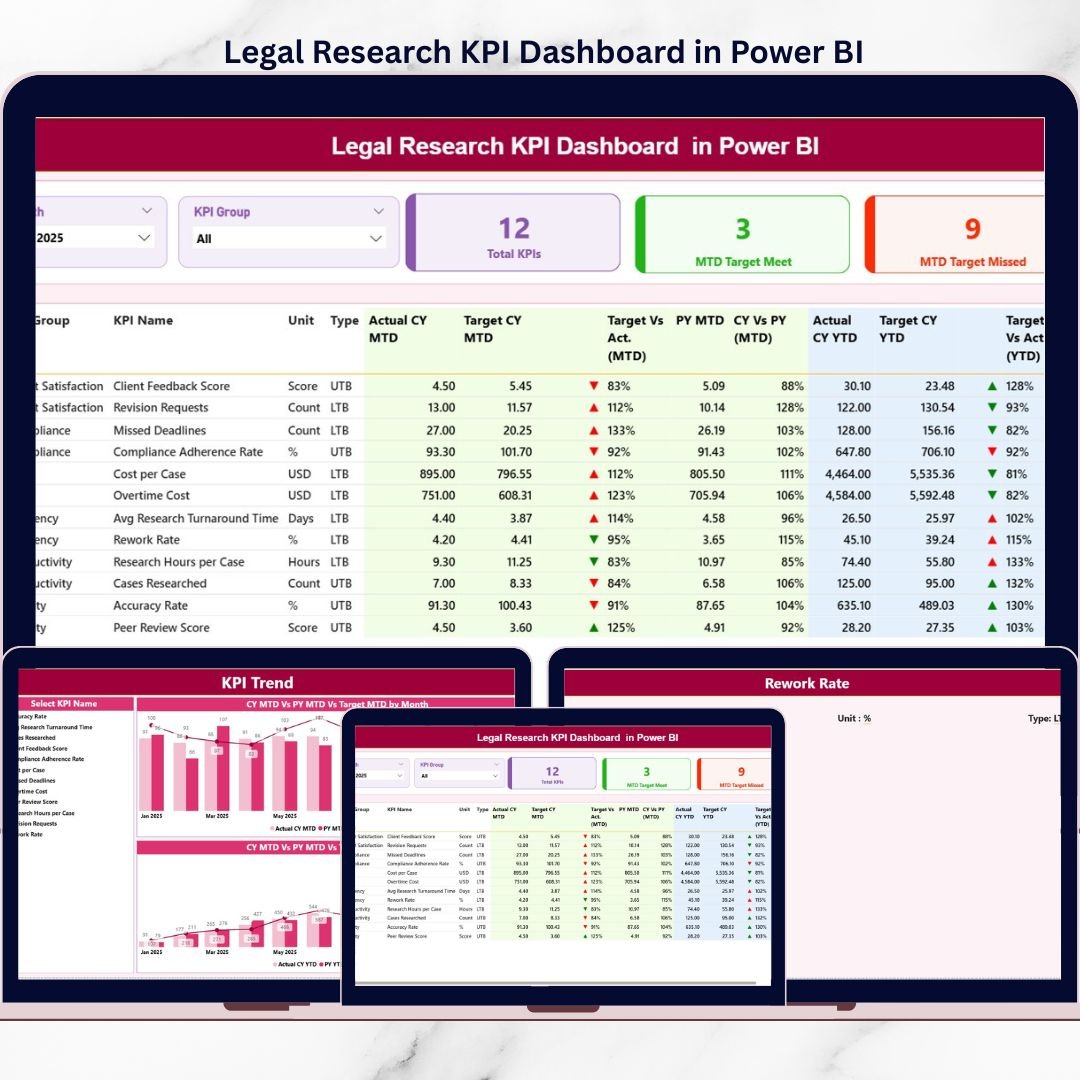
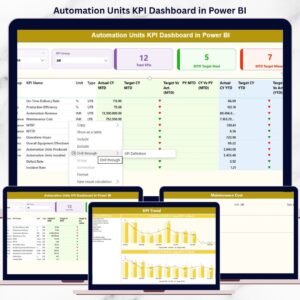
This interactive Power BI dashboard helps legal teams monitor, analyze, and evaluate legal research performance using dynamic visuals, MTD and YTD KPIs, trend analysis, and drill-through insights. Instead of static reporting, you get real-time, visual, and data-driven decision support—all in one powerful dashboard.
🔑 Key Features of Legal Research KPI Dashboard in Power BI
The Legal Research KPI Dashboard in Power BI is built to deliver clarity, speed, and control for legal operations.
It provides a centralized KPI Summary Page where all legal research KPIs are displayed together. Using interactive slicers for Month and KPI Group, users can instantly filter the entire dashboard and focus on what matters most.
The dashboard displays MTD and YTD performance with clear indicators:
-
Actual vs Target comparison
-
Previous Year vs Current Year comparison
-
▲ / ▼ icons with color coding for instant performance interpretation
In addition, interactive KPI cards show total KPIs, target met count, and target missed count—giving leadership an immediate performance snapshot.
With Power BI’s interactivity, users can drill down, filter, and explore data effortlessly.
📦 What’s Inside the Legal Research KPI Dashboard in Power BI
This digital product includes three interactive Power BI pages, supported by a structured Excel data source.
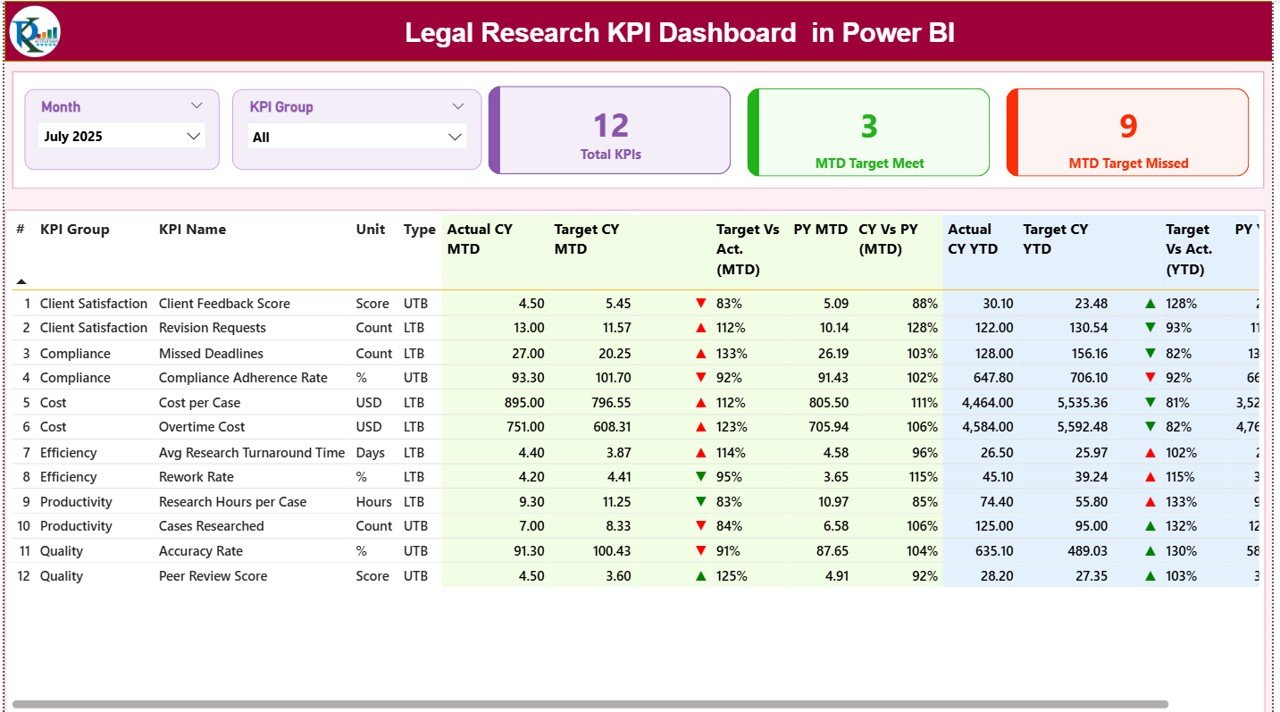
The Summary Page is the main performance overview. It contains slicers, KPI cards, and a detailed KPI table showing:
-
KPI number, group, name, unit, and type
-
MTD actual, target, previous year, and performance %
-
YTD actual, target, previous year, and performance %
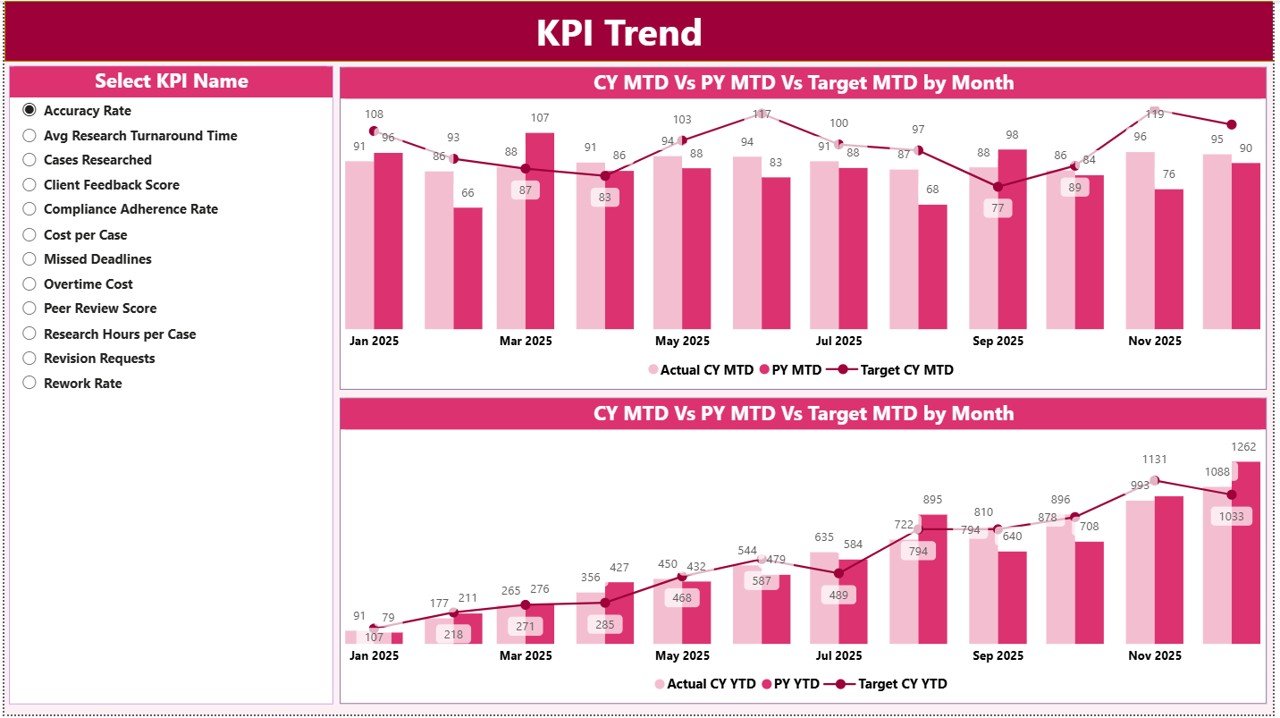
The KPI Trend Page focuses on performance behavior over time. Users select a KPI using a slicer, and the page displays:
-
MTD trend (Actual vs Target vs Previous Year)
-
YTD trend (Actual vs Target vs Previous Year)
These combo charts help identify patterns, seasonality, and improvement trends.
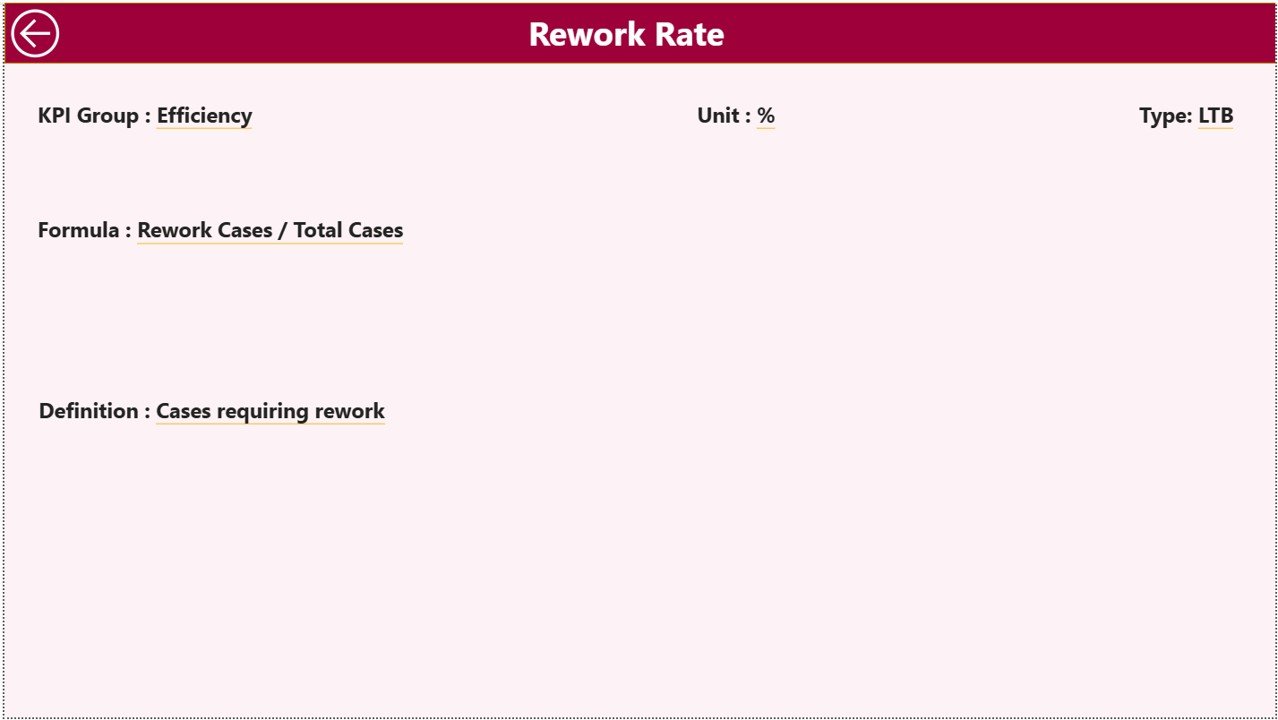
The KPI Definition Page is a drill-through page that displays KPI formula and definition. Users can right-click any KPI from the Summary Page to view its detailed explanation, ensuring complete clarity.
🚀 How to Use the Legal Research KPI Dashboard in Power BI
Using this dashboard is simple and efficient.
First, update the Excel data source:
-
Enter actual performance values in the Input Actual sheet
-
Enter target values in the Input Target sheet
-
Maintain KPI details in the KPI Definition sheet
Once the Excel file is updated, refresh the Power BI dashboard. All visuals update automatically.
Next, use slicers on the Summary Page to filter by month or KPI group. Review MTD and YTD performance instantly.
For deeper insights, move to the KPI Trend Page and analyze trends. If you need KPI clarity, drill through to the KPI Definition Page with one click.
No advanced Power BI knowledge is required for end users.
👥 Who Can Benefit from This Legal Research KPI Dashboard in Power BI
This dashboard is ideal for a wide range of legal professionals and organizations.
Law firms can track research productivity. Corporate legal departments can monitor efficiency. Compliance teams can evaluate research output. Legal operations managers can measure performance. Regulatory bodies can use it for structured reporting.
If your goal is to improve visibility, accountability, and decision-making in legal research, this dashboard is built for you.
📌 Why This Power BI Dashboard Is a Smart Choice
The Legal Research KPI Dashboard in Power BI helps teams identify performance gaps early, track improvements clearly, and support faster, data-driven legal decisions.
By combining Excel-based data entry with Power BI’s interactive analytics, this solution delivers enterprise-level insights without complexity.
📖 Click here to read the Detailed blog post
🎥 Visit our YouTube channel to learn step-by-step video tutorials
👉 https://youtube.com/@PKAnExcelExpert


Reviews
There are no reviews yet.