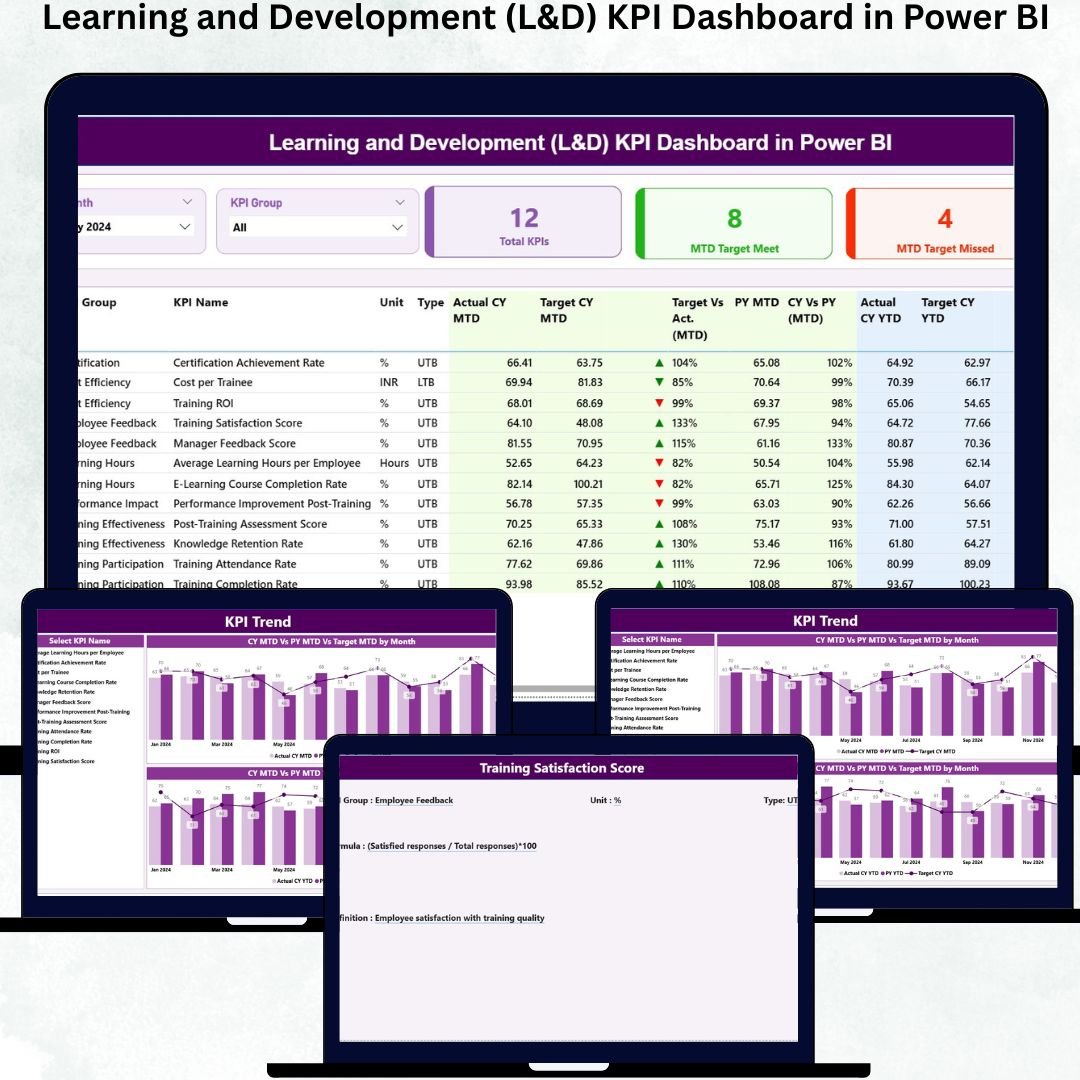
Learning and Development (L&D) KPI Dashboard in Power BI Employee growth is the backbone of every successful organization—but tracking learning performance is often difficult. Many companies struggle with scattered training records, unclear KPIs, and manual reporting methods. This leads to incomplete insights and delayed decisions. Learning and Development (L&D) KPI Dashboard in Power BI That’s exactly why we created the Learning and Development (L&D) KPI Dashboard in Power BI, a professional, ready-to-use analytics solution designed to bring clarity, structure, and speed to your entire L&D performance management system.
Learning and Development (L&D) KPI Dashboard in Power BI This dashboard turns confusing Excel data into meaningful visual insights. Learning and Development (L&D) KPI Dashboard in Power BI With smart slicers, combo charts, KPI cards, and drill-through features, it helps HR teams, L&D departments, and business leaders evaluate training progress and performance instantly. Whether you want to track completion rates, target achievement, monthly progress, MTD vs YTD analysis, or KPI definitions—everything is organized neatly on one interactive dashboard.
✨ Key Features of the Learning and Development (L&D) KPI Dashboard in Power BI
This dashboard is packed with powerful capabilities that simplify reporting and strengthen decision-making.
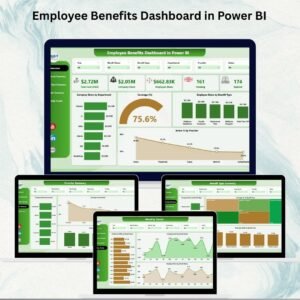
📌 Summary Page – Clear View of L&D Health
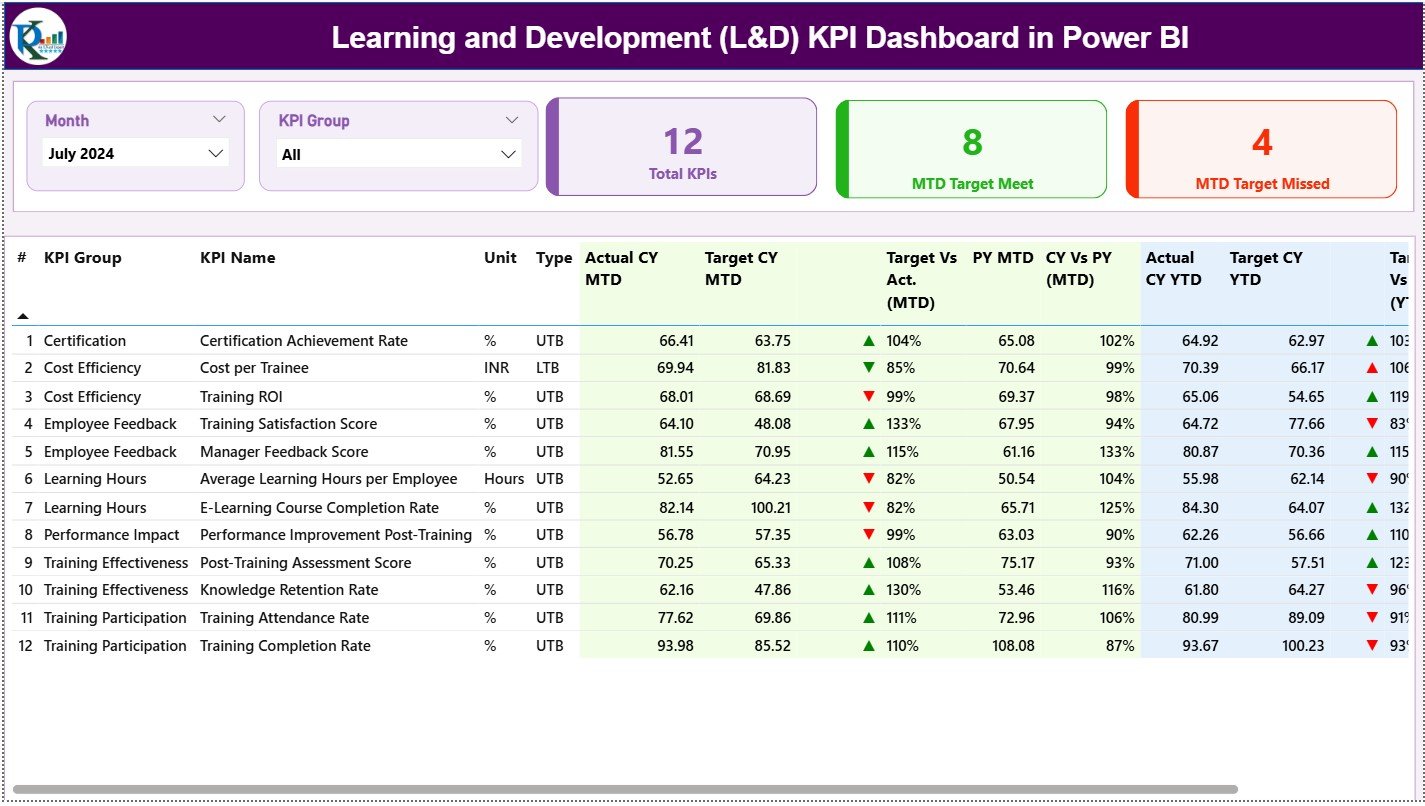
Get a complete overview of your monthly and yearly performance with:
✔ Month Slicer
✔ KPI Group Slicer
✔ KPI Cards: Total KPIs, MTD Target Met, MTD Target Missed
A detailed KPI table reveals complete insights such as MTD vs Target, YTD vs Target, current vs previous year comparisons, KPI type (LTB/UTB), and performance icons.
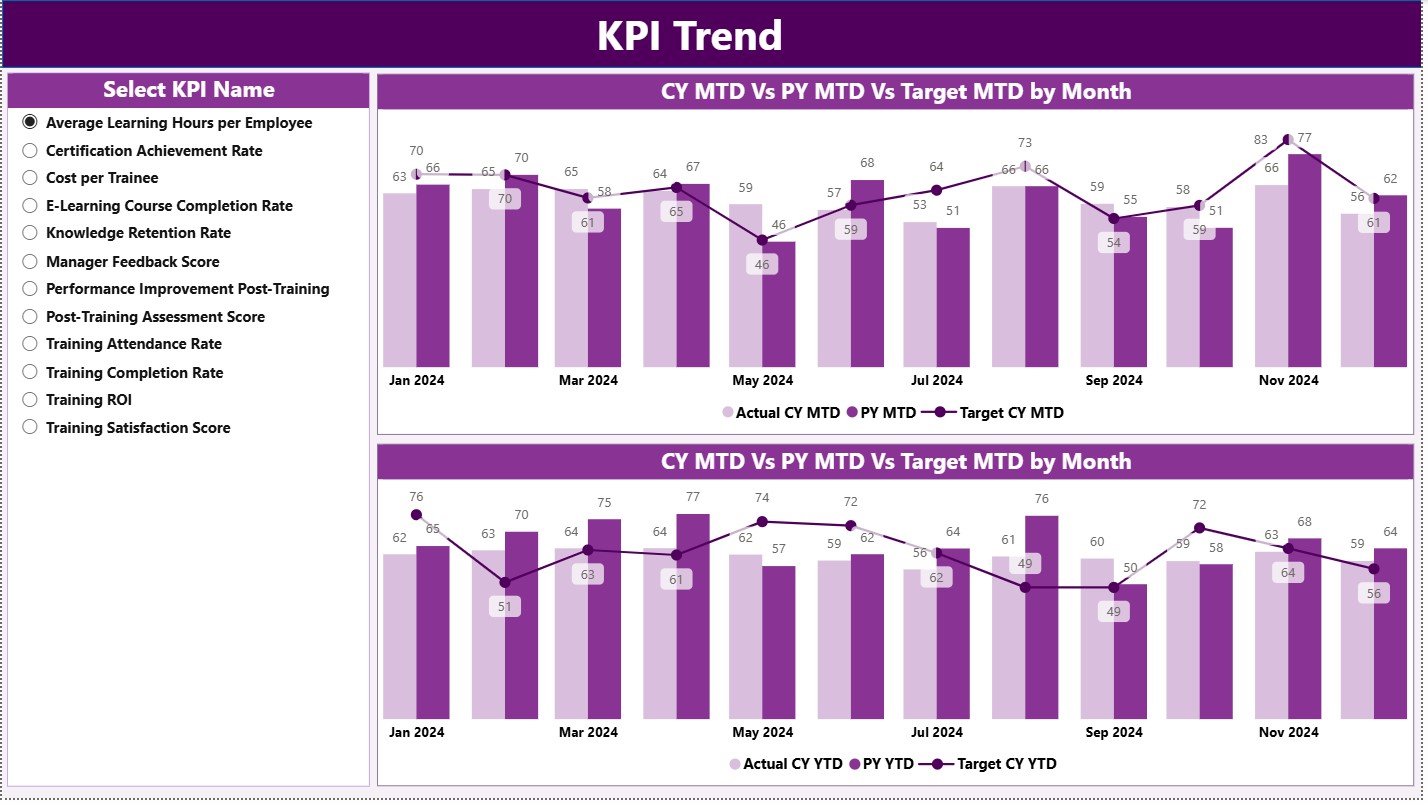
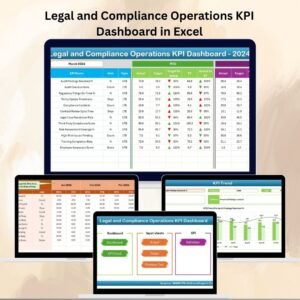
📌 KPI Trend Page – Performance Over Time
Understand how every KPI behaves month after month:
✔ Monthly trend chart with Actual vs Target
✔ YTD trend chart with year-over-year comparison
✔ KPI slicer to focus on specific metrics
This page uncovers seasonal patterns, long-term improvements, and performance gaps.
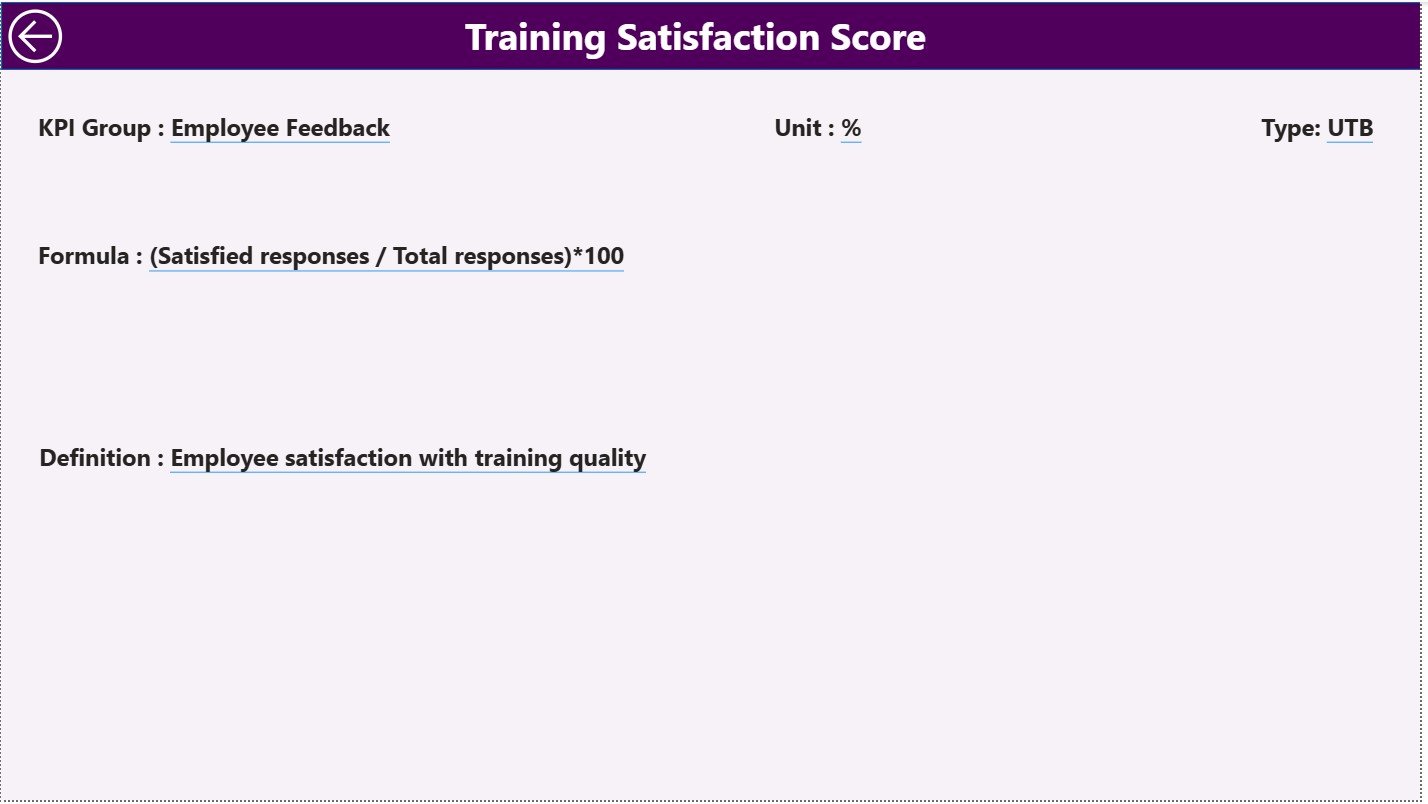
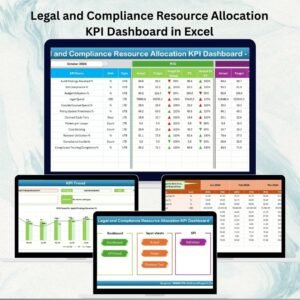
📌 KPI Definition Page – Understand What Each KPI Means
With drill-through support, users can instantly view:
✔ KPI Name
✔ KPI Group
✔ KPI Formula
✔ KPI Definitions
✔ KPI Type (UTB/LTB)
A back button allows quick navigation, making it ideal for training sessions and audits.
📦 What’s Inside the L&D KPI Dashboard in Power BI
Your download includes a professionally designed Power BI dashboard built with:
1️⃣ A Clean Summary Page
Shows instant MTD and YTD performance along with color-coded icons and trend comparisons.
2️⃣ A Dynamic KPI Trend Page
Displays side-by-side charts comparing current year vs previous year along with monthly patterns.
3️⃣ A Detailed KPI Definition Page
Provides background for every KPI so teams understand calculations accurately.
4️⃣ Excel Data Source (Easy to Maintain)
Includes:
✔ Input Actual
✔ Input Target
✔ KPI Definition Sheet
Just update the Excel file → refresh Power BI → and your dashboard updates automatically!
🛠️ How to Use the Learning and Development KPI Dashboard in Power BI
👉 Step 1: Update Excel Input Sheets
Fill in Actuals, Targets, and KPI details.
👉 Step 2: Load the Excel File in Power BI
The dashboard connects instantly.
👉 Step 3: Explore Dashboard Pages
Use slicers, drill-through options, and charts to review performance.
👉 Step 4: Compare Performance with Last Year
Identify positive or negative gaps using MTD and YTD comparisons.
👉 Step 5: Share Insights with Leadership
Export visuals and share dashboards for meetings, planning, and reviews.
🎯 Who Can Benefit from This L&D KPI Dashboard?
This dashboard is perfect for:
👩💼 HR Managers
Track training progress and target completion.
📚 L&D Teams
Identify skill gaps, learning effectiveness, and program performance.
📈 Business Leaders & Executives
Measure learning ROI and workforce improvement.
🏫 Corporate Trainers
Monitor course effectiveness and learner engagement.
🔍 Analysts & Reporting Teams
Save hours of manual reporting and generate insights instantly.
Whether you’re a startup or a large enterprise, this dashboard supports efficient tracking of learning goals and employee development.


Reviews
There are no reviews yet.