In the modern workplace, continuous learning is the key to business growth. The Learning and Development (L&D) KPI Dashboard in Excel is a powerful, ready-to-use performance analytics tool that helps HR and L&D teams measure training effectiveness, optimize learning budgets, and demonstrate the ROI of employee development programs.
Built entirely in Microsoft Excel, this dashboard converts complex training data into clear, actionable visuals. Whether you’re tracking completion rates, skill improvements, or training costs, it gives leaders the insights they need to align workforce development with business strategy.
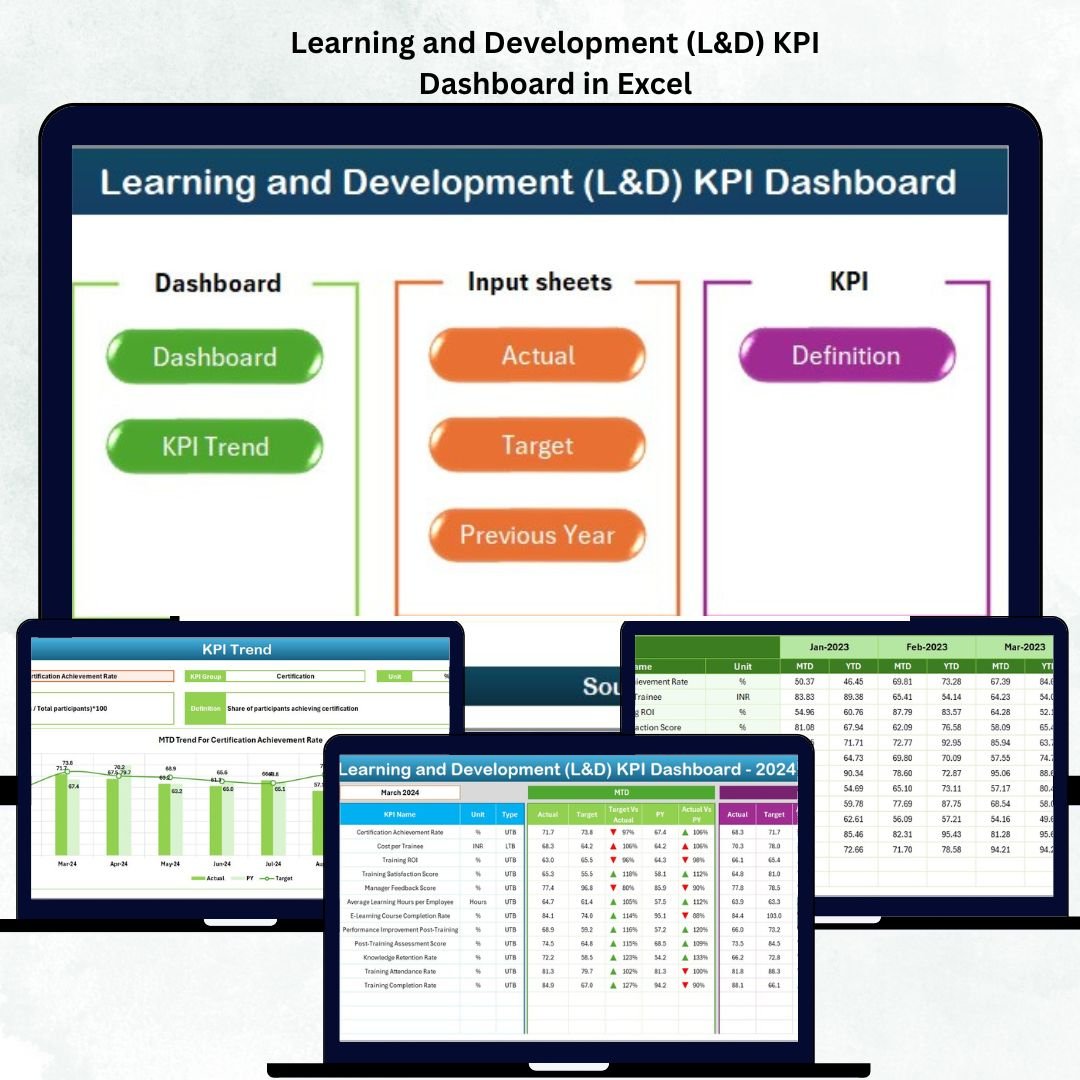
⚙️ Key Features of the L&D KPI Dashboard in Excel
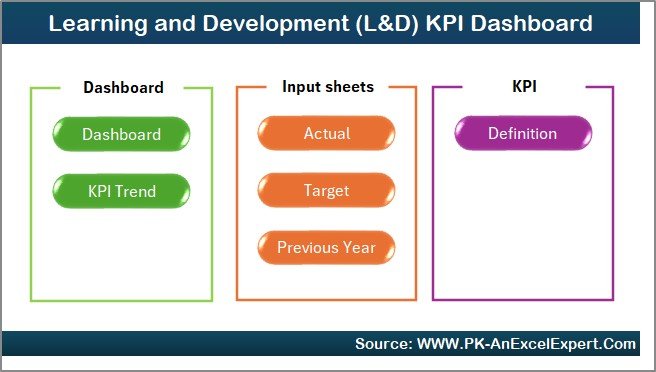
📊 7 Structured Worksheets: Home | Dashboard | KPI Trend | Actual Numbers | Target | Previous Year | KPI Definition
📅 Month Selector: Dynamic dropdown to choose the reporting period.
📈 MTD & YTD Comparisons: Analyze month-to-date and year-to-date results.
🎯 Actual vs Target vs PY: Instantly see progress and performance gaps.
🟢🔴 Visual Indicators: Arrows and colors show where improvement is needed.
📘 Comprehensive KPI Library: Standardized metrics with clear definitions.
🧩 Interactive Trend Charts: Compare performance over time by KPI.
💻 Fully Editable: No macros, no add-ins — just pure Excel intelligence.
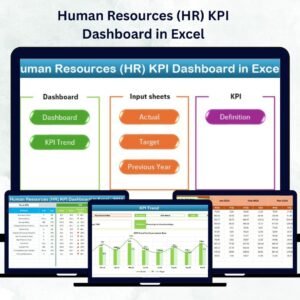
📊 Dashboard Structure Overview
🏠 1️⃣ Home Sheet – Central Navigation
A clean, user-friendly index page with navigation buttons for each section (Dashboard, KPI Trend, Targets, Actuals, Definitions, etc.).
💡 Purpose: Make navigation intuitive and reduce time spent searching for data.
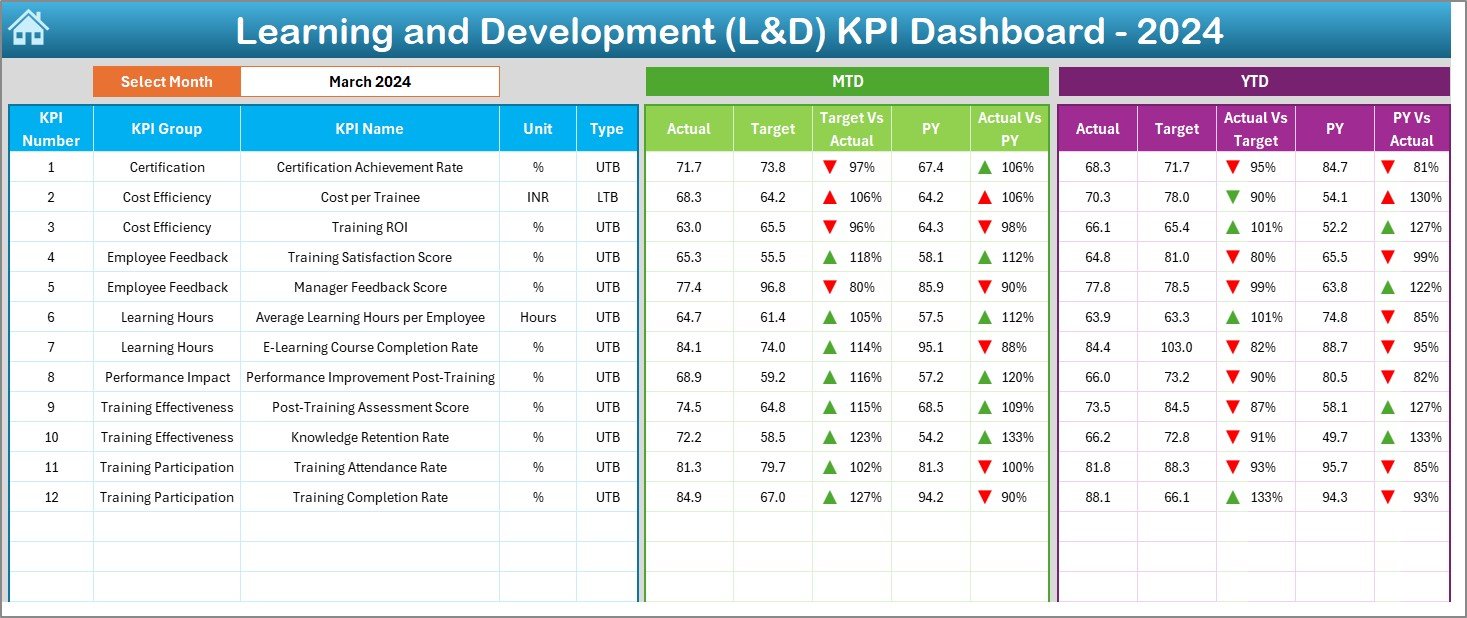
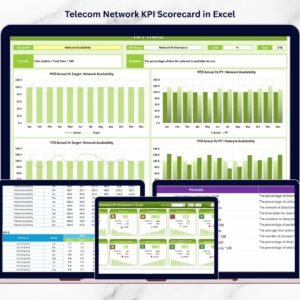
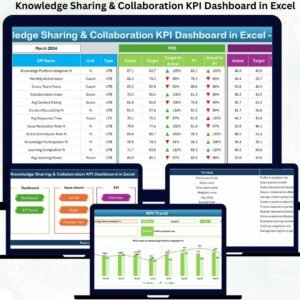
📈 2️⃣ Dashboard Sheet – L&D Performance Overview
The main visualization hub that provides real-time insight into learning outcomes.
-
Month dropdown selector (cell D3).
-
Displays MTD/YTD Actual, Target, and PY data side by side.
-
Uses arrows and colors to instantly show performance trends.
💡 Purpose: Offer executives a snapshot of training performance in seconds.
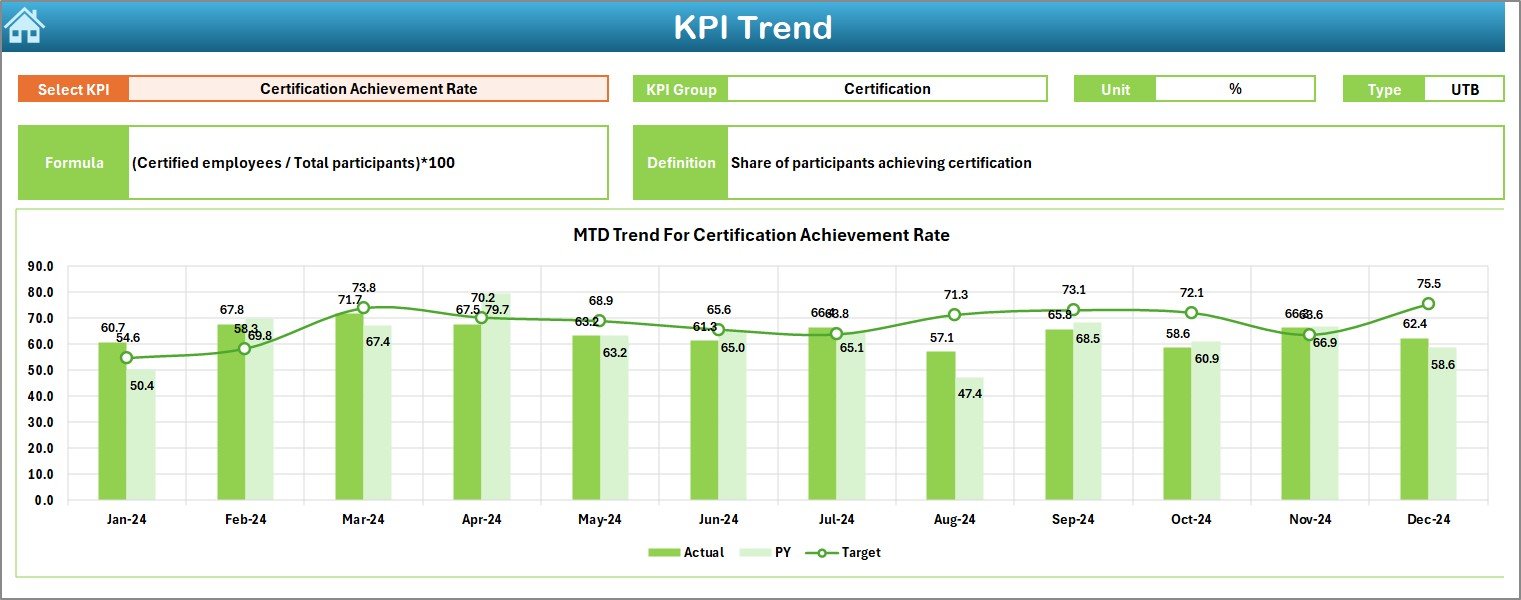
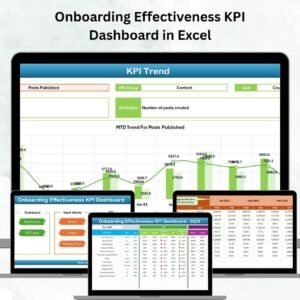
📊 3️⃣ KPI Trend Sheet – Historical Progress Tracking
Analyze long-term performance trends for any KPI.
-
Select KPI name (cell C3) to view details.
-
MTD and YTD trend charts for Actual, Target, and PY.
-
Displays KPI Group, Unit, Type, and Formula.
💡 Purpose: Understand learning trends, effectiveness, and seasonal changes.
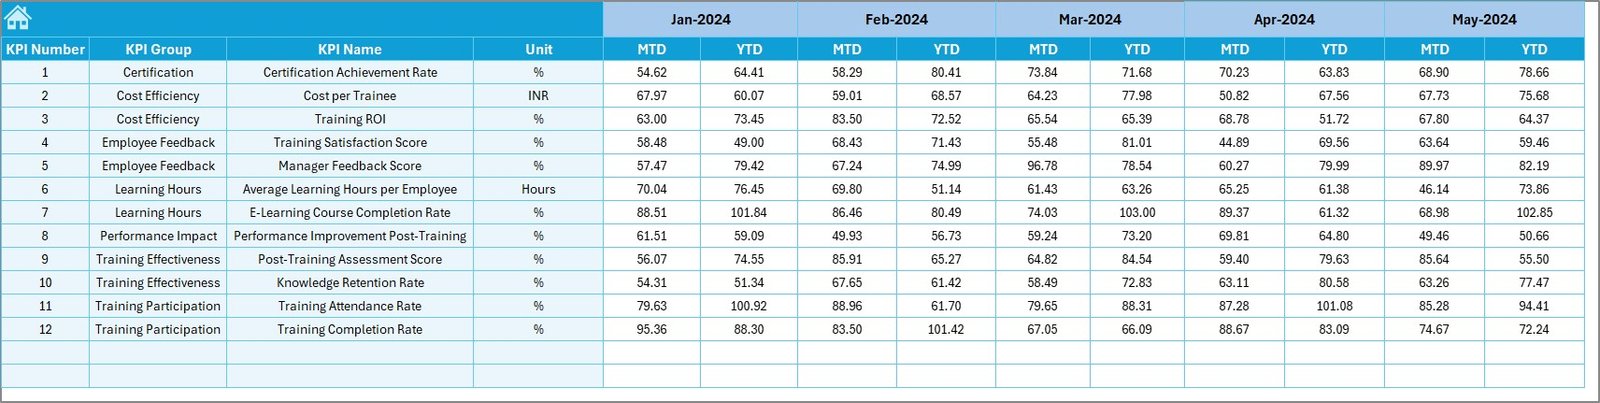
📘 4️⃣ Actual Numbers Input Sheet – Real Data Entry
Enter real-time performance data in a structured format.
-
Set the start month in cell E1.
-
Capture monthly MTD and YTD values.
💡 Purpose: Keep the dashboard live and current without complex formulas.
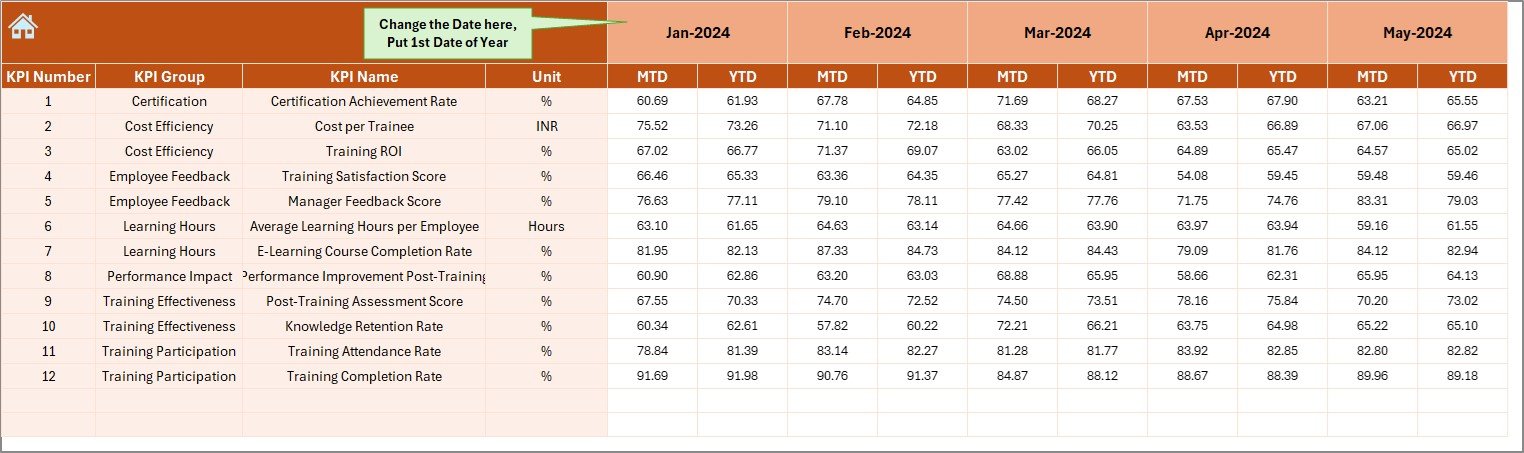
🎯 5️⃣ Target Sheet – Define Learning Goals
Set measurable monthly and yearly targets for every KPI.
💡 Purpose: Benchmark performance against clear learning objectives.
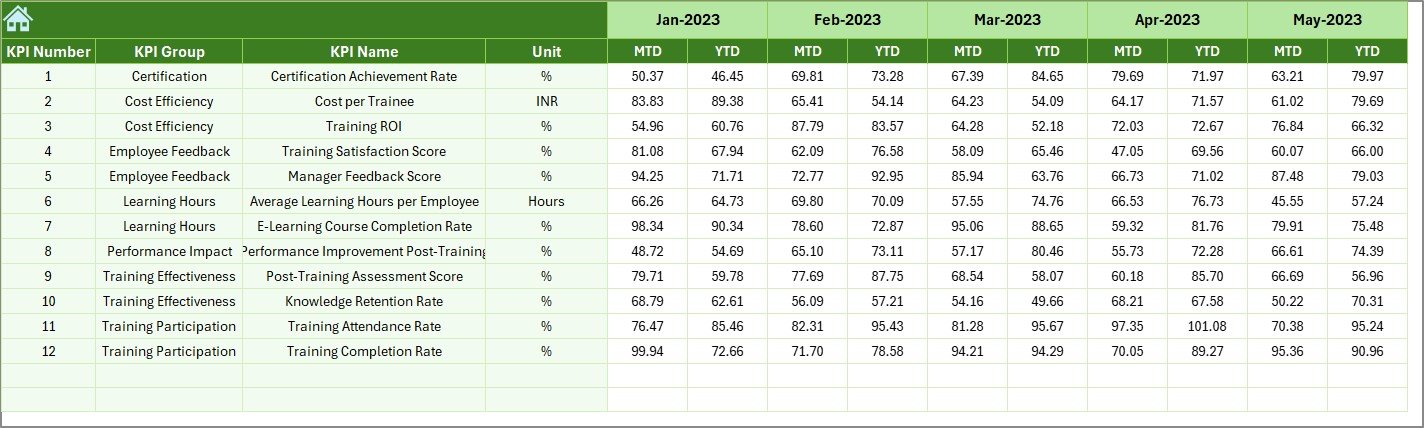
📅 6️⃣ Previous Year Numbers Sheet – Performance Comparison
Store historical data to compare growth and progress over time.
💡 Purpose: Identify whether training outcomes are improving year-over-year.
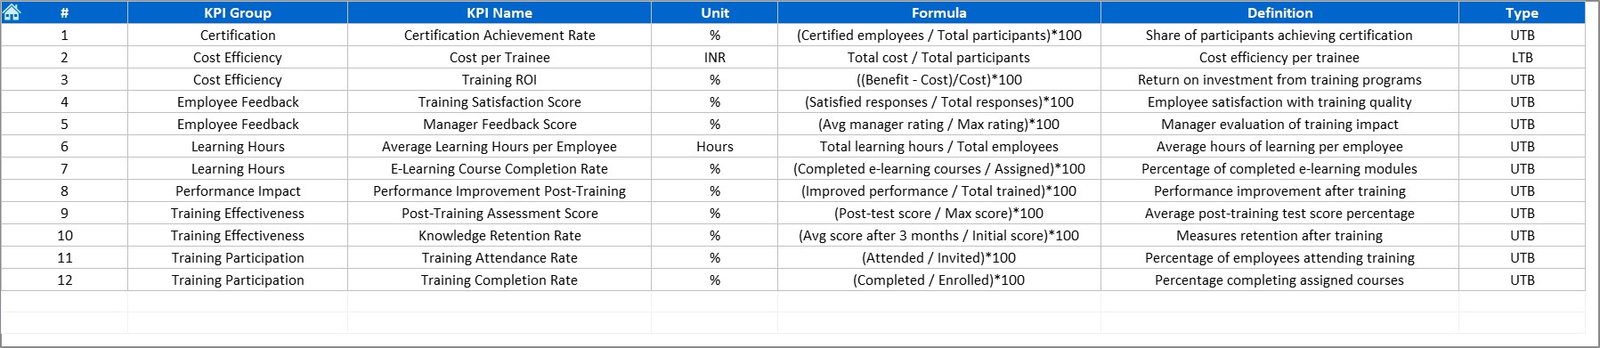
📘 7️⃣ KPI Definition Sheet – The KPI Dictionary
Each KPI includes fields such as Name, Group, Unit, Formula, and Definition.
💡 Purpose: Maintain clarity, transparency, and accountability across teams.
🌟 Advantages of the L&D KPI Dashboard in Excel
✅ Data-Driven Learning Decisions: Visualize training ROI and program success.
✅ Real-Time Insights: Identify skill gaps and training impact instantly.
✅ Budget Optimization: Track cost per learner and improve allocation.
✅ Employee Engagement: Monitor satisfaction scores and completion rates.
✅ Performance Alignment: Link L&D goals with organizational KPIs.
✅ Ease of Use: No coding — everything runs with formulas and Excel logic.
✅ Professional Reporting: Ready for management presentations and reviews.
💡 Best Practices for Using the Dashboard
📌 Update Actual and Target data monthly.
📌 Use dropdown menus for clean and error-free input.
📌 Protect sheets with formulas and structure cells.
📌 Review KPI definitions yearly for relevance.
📌 Use charts and conditional formatting for quick visual interpretation.
📌 Maintain version control and backups for accurate recordkeeping.
👥 Who Can Use This Dashboard
🏢 HR Managers and Learning & Development Teams
📊 Business and People Analytics Professionals
💼 Training Consultants and Corporate Coaches
🏛️ Educational Institutions and Skill Academies
🌍 Any organization focused on workforce upskilling
🧩 Conclusion
The Learning and Development KPI Dashboard in Excel is your go-to performance management tool for building a skilled, engaged, and future-ready workforce.
By combining structured data entry, trend analysis, and intuitive visuals, it empowers L&D professionals to prove the impact of training initiatives and drive measurable improvement across the organization.
🎓 Transform training data into performance intelligence — with NextGen Templates’ L&D KPI Dashboard in Excel.


Reviews
There are no reviews yet.