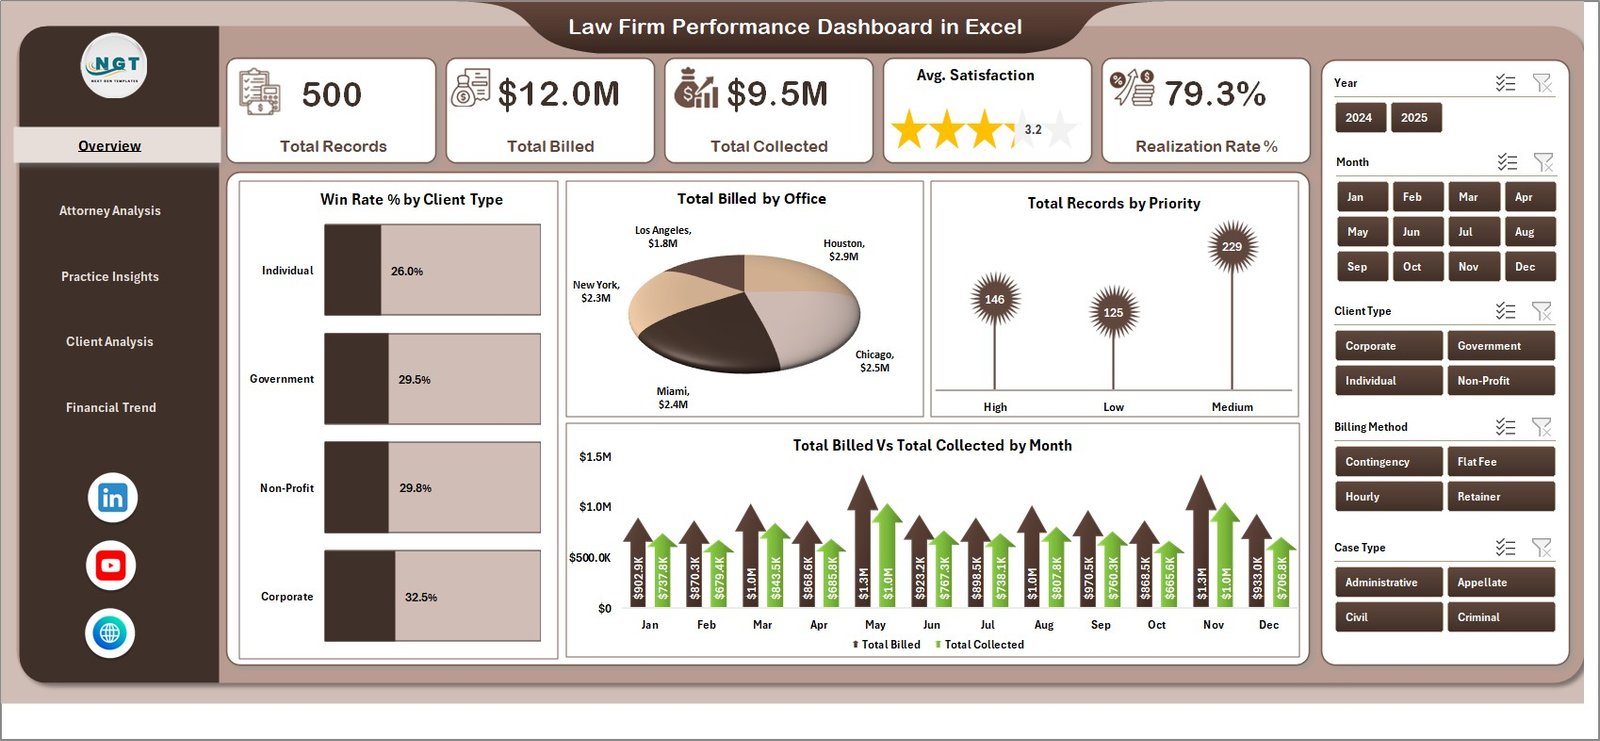
🔑 Key Features of Law Firm Performance Dashboard in Excel
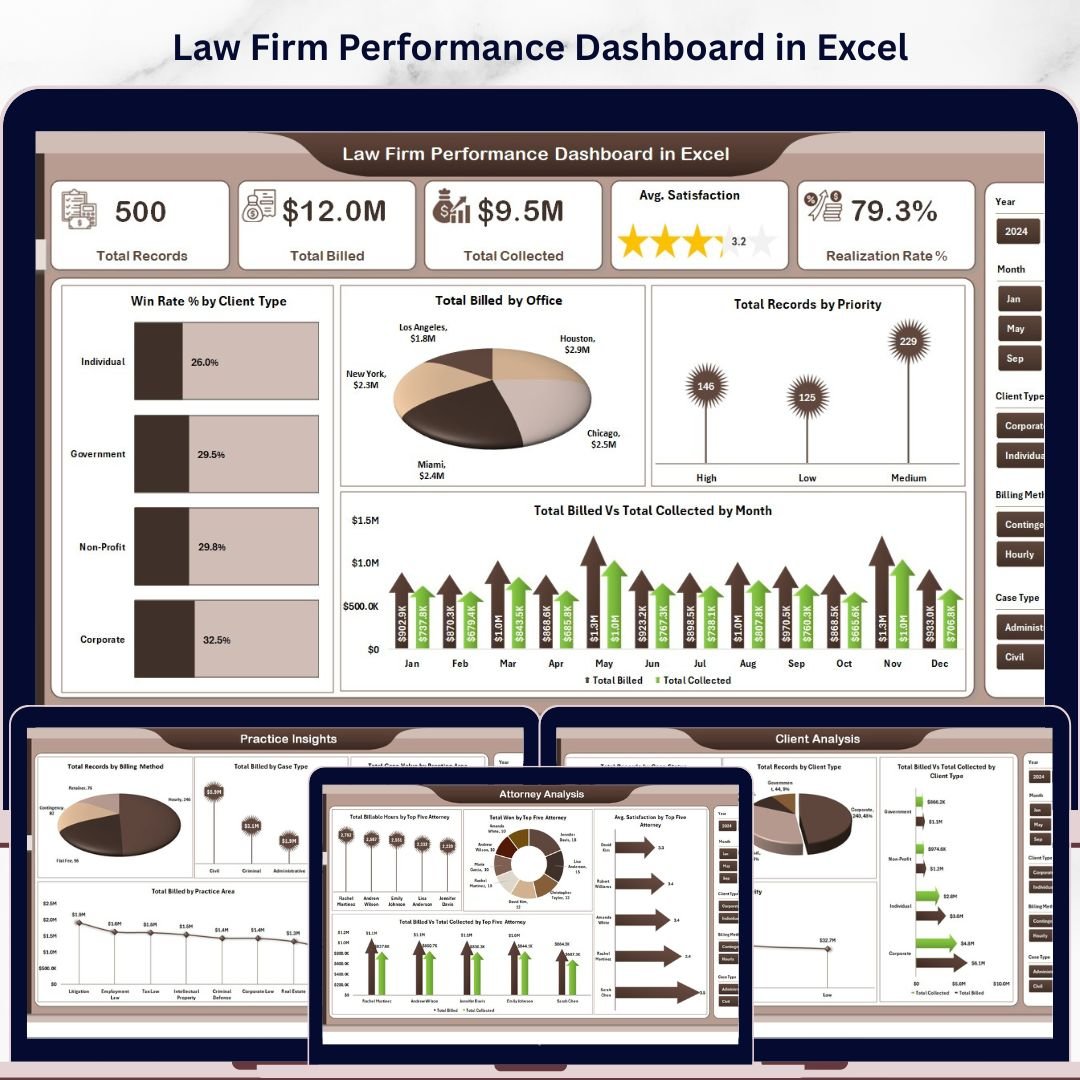
Law Firm Performance Dashboard in Excel is a comprehensive analytics template designed specifically for law firms, legal departments, and solo practitioners who need to track billing, collections, client satisfaction, and attorney performance in one centralized Excel workbook. This dashboard includes 5 interactive pages — Overview, Attorney Analysis, Practice Insights, Client Analysis, and Financial Trend — covering every critical aspect of law firm operations. It tracks key metrics including Total Records, Total Billed, Total Collected, Average Satisfaction Score, and Realization Rate percentage. Built entirely with Excel pivot tables and slicers, every chart refreshes automatically when you update the data sheet.
Whether you manage a boutique litigation firm or a full-service corporate law practice, this template gives you instant visibility into case performance, billing trends, and attorney productivity. Explore our full collection of Excel Dashboard Templates for more business intelligence solutions.
📦 What’s Inside the Law Firm Performance Dashboard in Excel
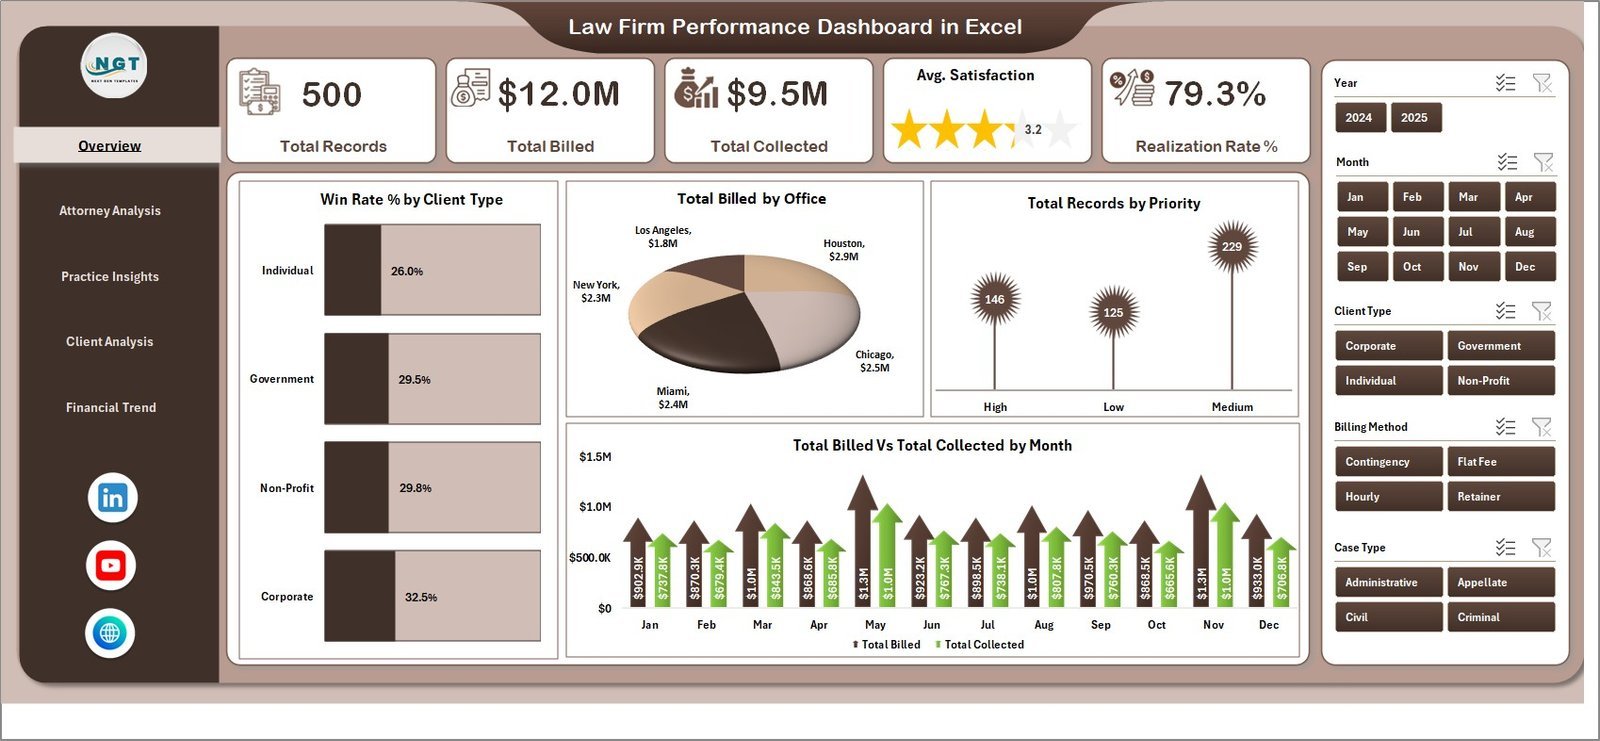
📌 Overview Page — High-level KPI cards displaying Total Records, Total Billed, Total Collected, Avg. Satisfaction, and Realization Rate %. Interactive charts include Win Rate % by Client Type, Total Billed by Office, Total Records by Priority, and Total Billed vs Total Collected by Month. Multiple slicers let you filter the entire dashboard instantly.
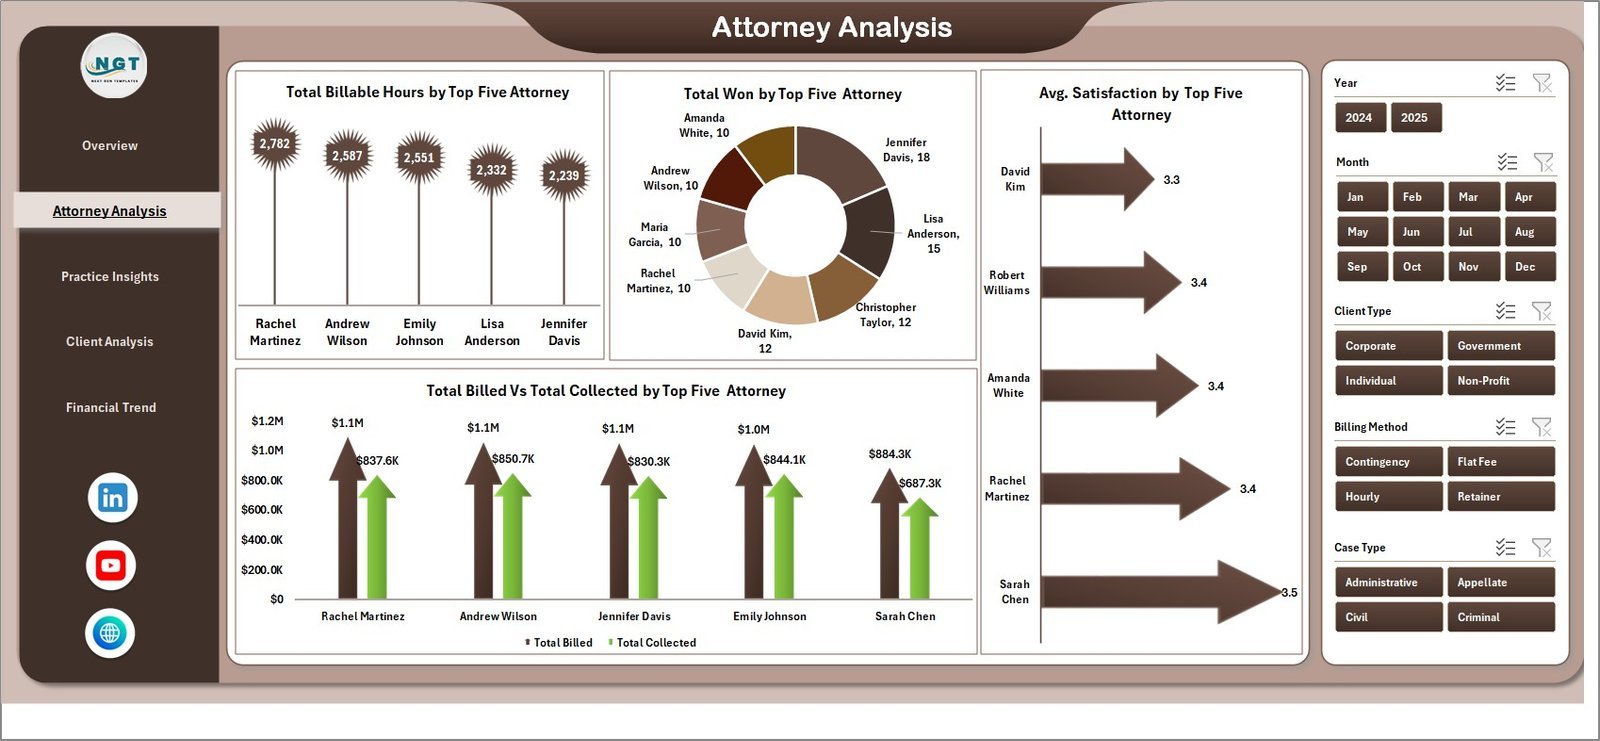
📌 Attorney Analysis Page — Deep-dive into attorney-level performance with charts showing Total Billable Hours by Top Five Attorney, Total Won by Top Five Attorney, Avg. Satisfaction by Top Five Attorney, and Total Billed vs Total Collected by Top Five Attorney. Ideal for evaluating partner and associate productivity.
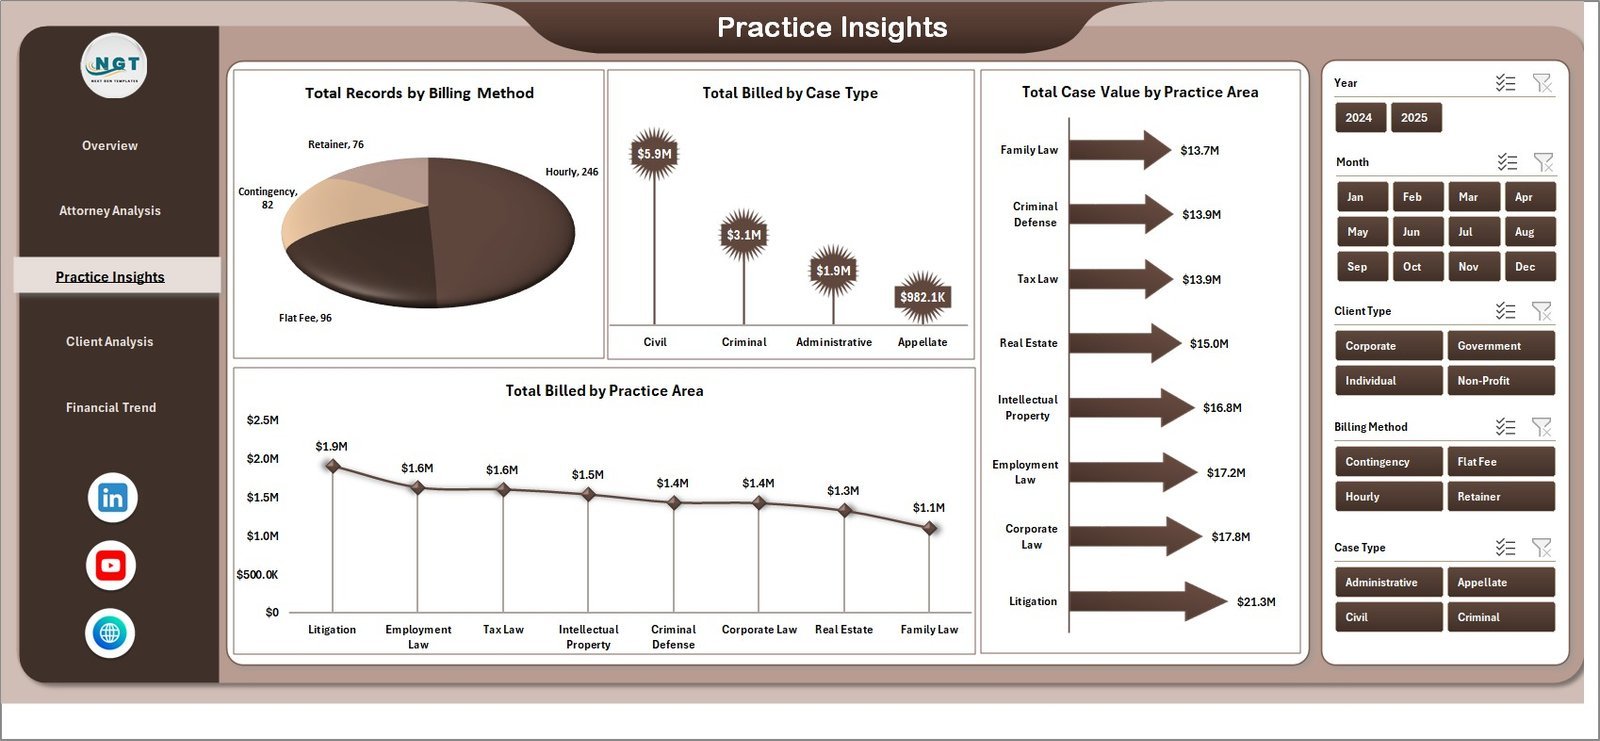
📌 Practice Insights Page — Analyze your practice areas and billing methods through Total Records by Billing Method, Total Billed by Case Type, Total Case Value by Practice Area, and Total Billed by Practice Area. Understand which practice areas generate the most revenue.
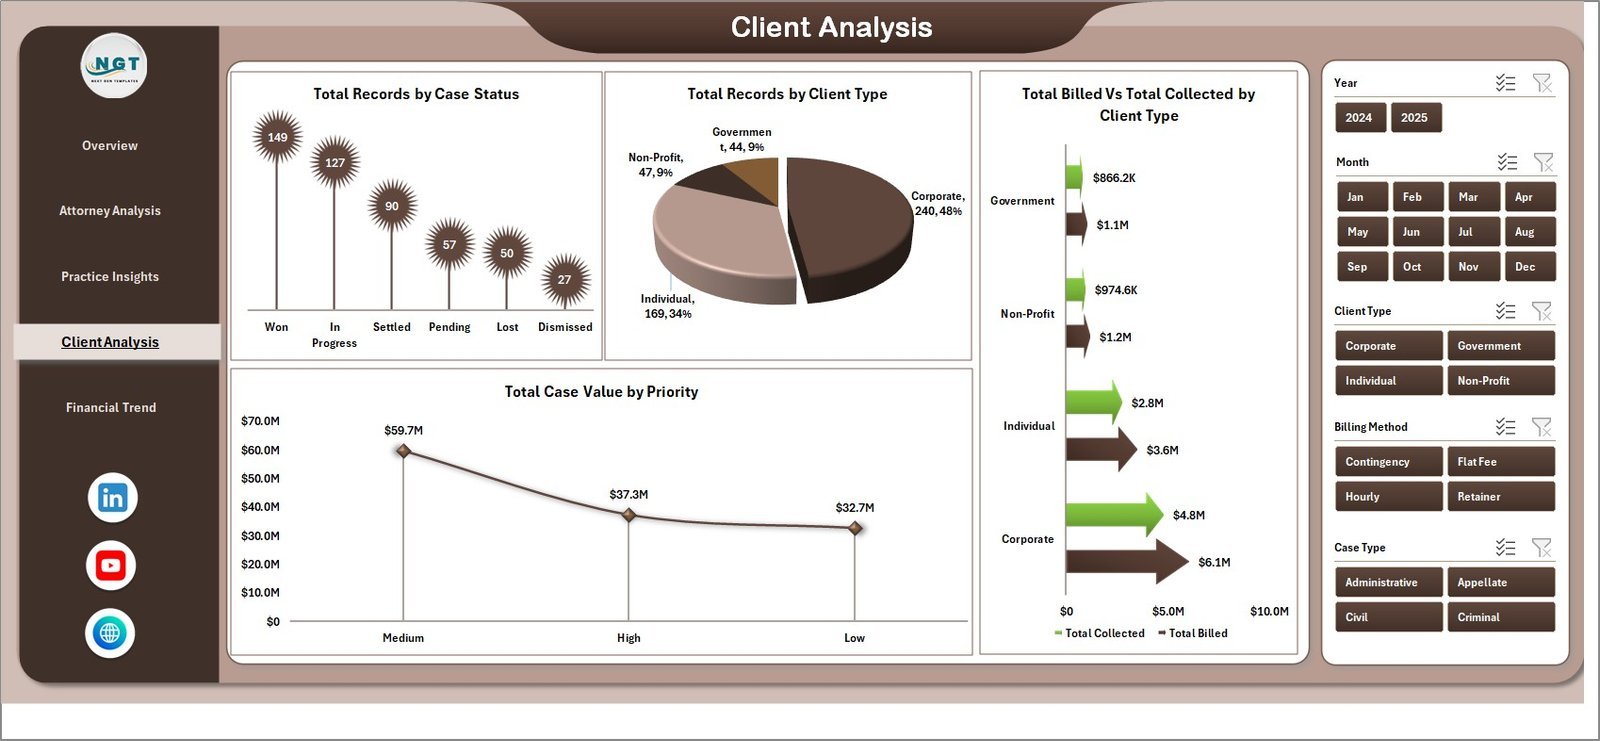
📌 Client Analysis Page — Understand your client base with Total Records by Case Status, Total Records by Client Type, Total Billed vs Total Collected by Client Type, and Total Case Value by Priority. Track which client segments drive the highest billing volume.
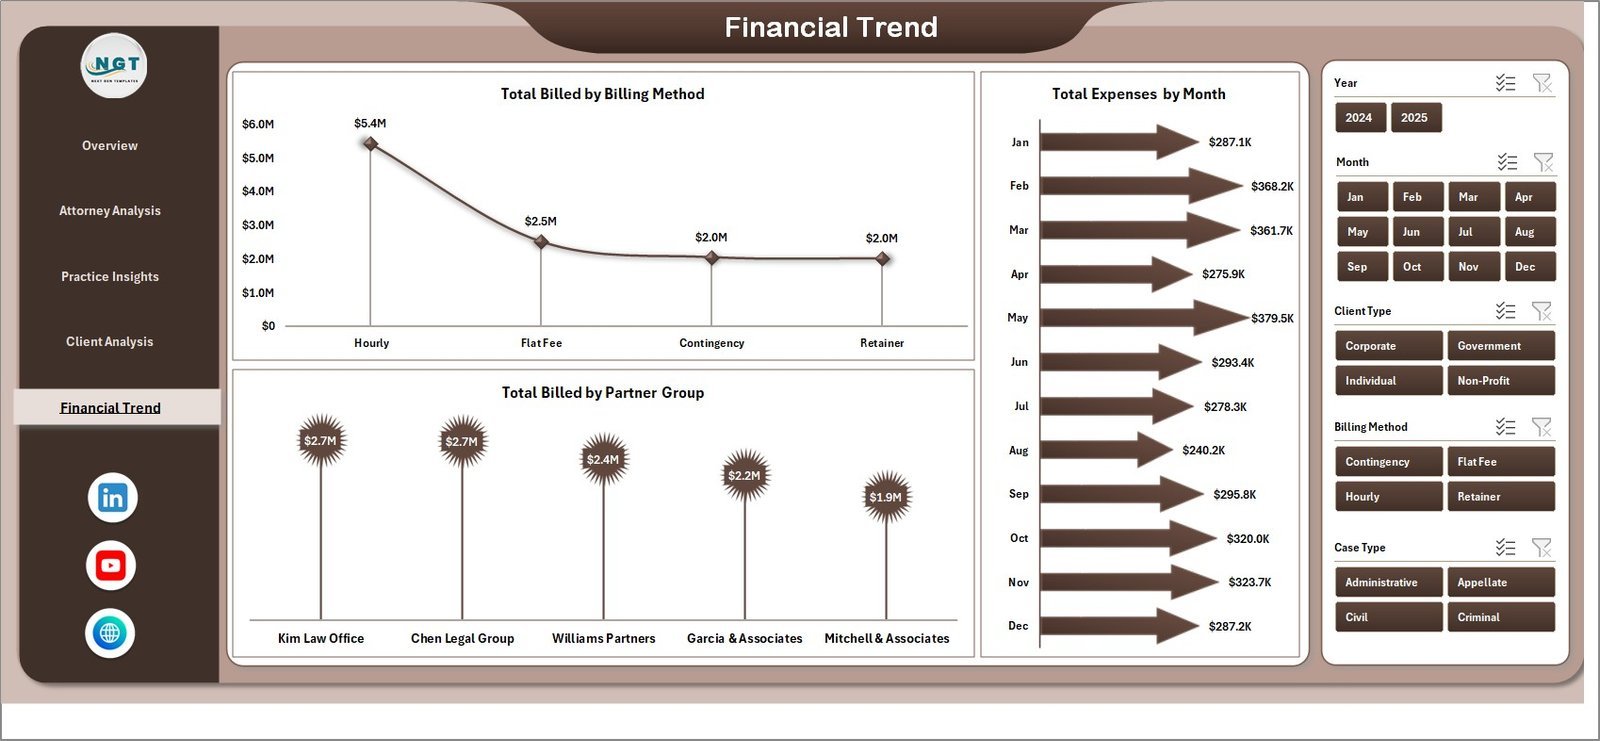
📌 Financial Trend Page — Monitor financial patterns with Total Billed by Billing Method, Total Expenses by Month, and Total Billed by Partner Group. Spot billing trends and expense patterns over time.
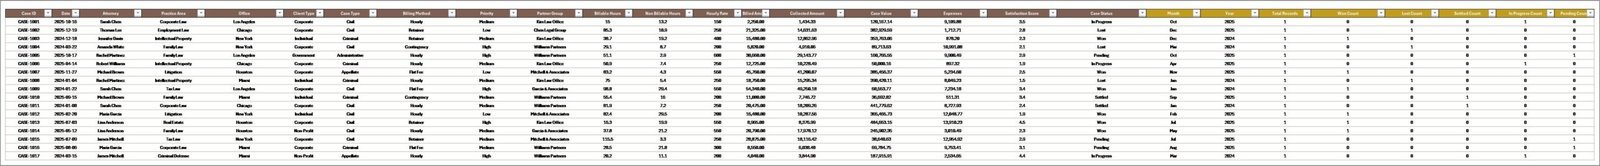
📌 Data Sheet — Enter all your case records here in the structured format. The dashboard reads from this single data source.
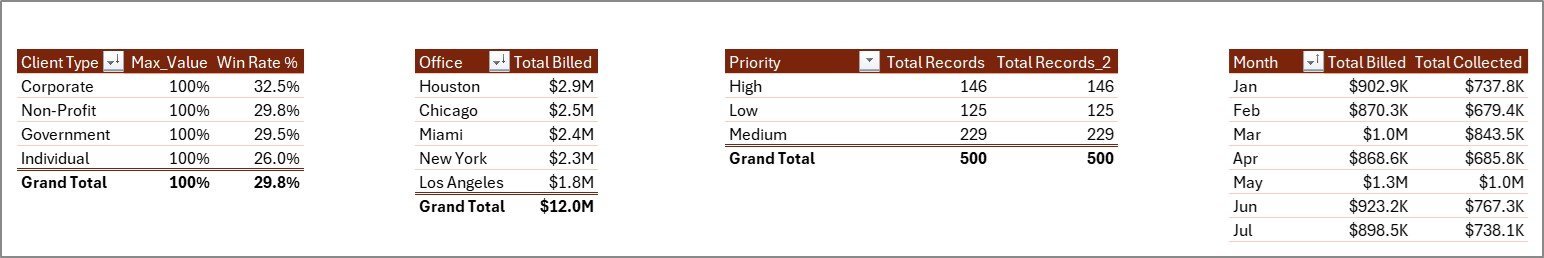
📌 Support Sheet — Contains all pivot tables that power the dashboard. Refresh all pivots from the Data tab in the Excel ribbon after updating data. Keep this sheet hidden during normal use.
Looking for legal dashboards in other platforms? Check out the Legal Dashboard in Google Sheets or the Legal Dashboard in Power BI.
⚙️ How to Use the Law Firm Performance Dashboard in Excel
1️⃣ Download and open the Excel file on your computer.
2️⃣ Navigate to the Data Sheet tab and replace the sample data with your own law firm case records in the same column format.
3️⃣ Go to the Data tab in the Excel ribbon and click “Refresh All” to update all pivot tables and charts automatically.
4️⃣ Use the slicers on the Overview page to filter by office, client type, priority, or time period.
5️⃣ Review each analysis page — Attorney Analysis, Practice Insights, Client Analysis, and Financial Trend — for detailed breakdowns.
6️⃣ Keep the Support Sheet hidden and let the pivot tables handle all calculations behind the scenes.
👥 Who Can Benefit from This Law Firm Performance Dashboard in Excel
📌 Managing partners tracking firm-wide billing and collection performance
📌 Law firm administrators monitoring attorney productivity and client satisfaction
📌 Solo practitioners analyzing case profitability and realization rates
📌 Legal operations managers evaluating practice area revenue and expenses
📌 Finance teams in corporate legal departments tracking billing trends
📌 Legal consultants providing performance reports to law firm clients
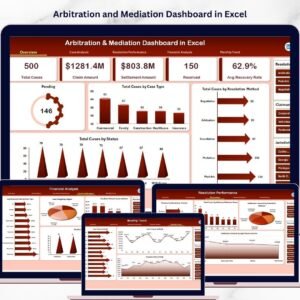
Also explore the Arbitration and Mediation Dashboard in Excel and Tax Litigation KPI Dashboard in Excel for related legal analytics.
❓ Frequently Asked Questions
What KPIs does the Law Firm Performance Dashboard in Excel track?
The Law Firm Performance Dashboard in Excel tracks 5 key metrics on the overview page: Total Records, Total Billed, Total Collected, Average Satisfaction Score, and Realization Rate percentage. Additional analysis pages provide breakdowns by attorney, practice area, client type, and billing method.
Do I need advanced Excel skills to use this law firm dashboard?
No. Simply replace the sample data in the Data Sheet tab with your own records, then click Refresh All from the Data ribbon. All charts, pivot tables, and KPI cards update automatically without any formula editing required.
Can I filter the dashboard by specific offices or client types?
Yes. The Overview page includes multiple slicers that let you filter the entire dashboard by office, client type, priority, and other dimensions. The filtered view applies across all charts on that page instantly.
How many dashboard pages are included in this template?
This template includes 5 interactive dashboard pages — Overview, Attorney Analysis, Practice Insights, Client Analysis, and Financial Trend — plus a Data Sheet for data entry and a Support Sheet containing the pivot tables.
Is this template compatible with Google Sheets or LibreOffice?
This dashboard is built with Excel pivot tables and slicers, which are best supported in Microsoft Excel 2016 or later. For a Google Sheets alternative, check out the Legal Dashboard in Google Sheets on our website.
What is the best Excel template for tracking law firm performance?
The Law Firm Performance Dashboard in Excel from NextGenTemplates is one of the best options available. It covers billing, collections, attorney productivity, practice area revenue, and client analysis across 5 interactive pages with automatic pivot table refresh.
🔗 Explore Related Templates
📌 Legal Advisory KPI Dashboard in Excel — Track KPIs for your legal advisory practice with automated scorecards.
📌 Legal Research KPI Dashboard in Excel — Monitor legal research team performance with detailed KPI tracking.
📌 Legal Dashboard in Power BI — Advanced legal analytics with interactive Power BI visuals and drill-through capabilities.
📖 Click here to read the Detailed Blog Post
🎥 Visit our YouTube channel to learn step-by-step video tutorials
👉 YouTube.com/@NextGenTemplates
Watch the step-by-step video tutorial:
YouTube


Reviews
There are no reviews yet.