


Running a landscaping business successfully means balancing creativity, operations, and profitability — and that starts with tracking the right data. The Landscaping Services KPI Dashboard in Power BI gives you a single, visual platform to monitor every aspect of your business — from project timelines and maintenance schedules to customer satisfaction and financial health.
Built in Microsoft Power BI and powered by Excel data, this ready-to-use dashboard transforms raw information into clear, actionable insights. Owners, project managers, and finance teams can finally see performance in real time, make faster decisions, and drive growth confidently.
⚙️ Key Features of the Landscaping Services KPI Dashboard in Power BI
📊 3 Interactive Pages – Summary Page, KPI Trend Page, and KPI Definition Page.
🧭 Slicers for Month & KPI Group – Filter instantly by timeframe or department.
📈 Dynamic Performance Cards – See Total KPIs Count, MTD Target Met, and MTD Target Missed.
💡 Detailed KPI Table – Track Actual vs Target, MTD vs YTD, and Previous Year comparisons.
🎯 Color Indicators – Green ▲ for targets met, Red ▼ for improvement needed.
📘 Drill-Through KPI Definition Page – View formulas and definitions with a single click.
🔄 Excel Data Integration – Refresh data to update visuals automatically.
🌱 Scalable Design – Add new KPIs or link to CRM and ERP systems.
📤 Professional Reporting – Export to PDF or publish to Power BI Service.
🌼 What’s Inside the Dashboard
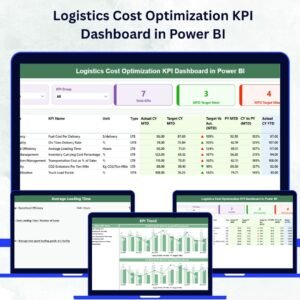
🏠 1️⃣ Summary Page — The Central Control Panel
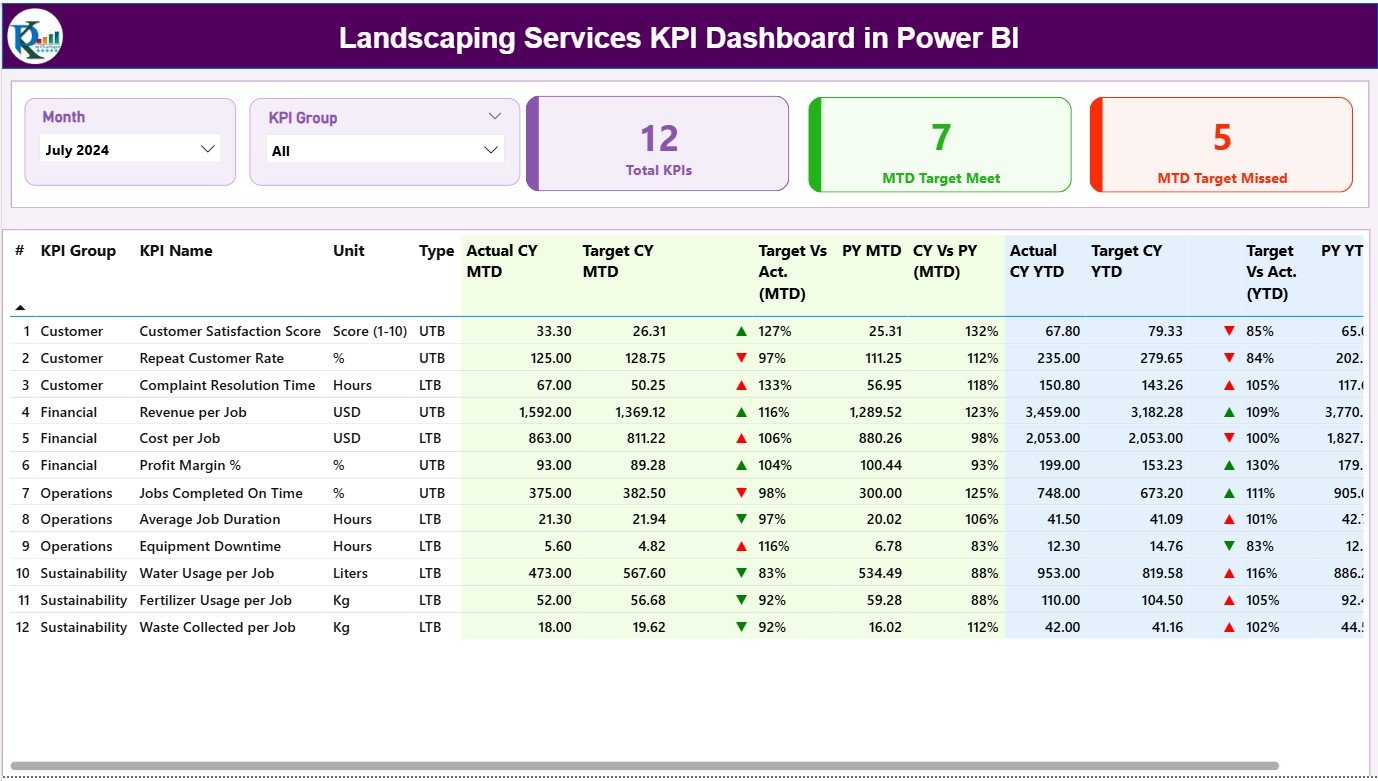
Your all-in-one overview of business performance.
-
Slicers for Month and KPI Group.
-
KPI cards showing total KPIs and target status.
-
A comprehensive table covering Actual vs Target, MTD/YTD metrics, and Previous Year comparisons.
💡 Purpose: Quickly see where you’re on track and where attention is needed.
📈 2️⃣ KPI Trend Page — Visualize Performance Over Time
Two combo charts (MTD and YTD) plot Actual, Target, and Previous Year values month by month.
Use the KPI selector to focus on metrics like “Average Project Completion Time” or “Revenue per Project.”
🎯 Purpose: Spot patterns, seasonal fluctuations, and consistent growth areas.
📘 3️⃣ KPI Definition Page — Your Reference Library
Drill through from the Summary Page to see each KPI’s Formula, Definition, Unit, and Type (UTB or LTB).
A Back button takes you instantly back to the main dashboard.
🎯 Purpose: Ensure clarity and standardization across teams.
📊 Excel Data Source Structure
1️⃣ Input_Actual Sheet – Enter KPI Name, Month, MTD, and YTD actuals.
2️⃣ Input_Target Sheet – Record monthly target values for MTD and YTD.
3️⃣ KPI Definition Sheet – Document KPI Number, Group, Unit, Formula, Definition, and Type.
Power BI automatically refreshes when the Excel file updates — no manual setup needed.
🌟 Advantages of Using This Dashboard
✅ Real-Time Visibility – See live project and financial performance.
✅ Centralized Monitoring – All KPIs in one interactive report.
✅ Smarter Decisions – Act on trends before they affect results.
✅ Time Savings – Eliminate manual report preparation.
✅ Data Consistency – Standardized KPI definitions prevent confusion.
✅ Professional Look – Ideal for client presentations and board reviews.
✅ Customizable – Add new metrics like fuel costs or sustainability KPIs.
🌿 Key KPIs for Landscaping Businesses
🏗️ Operational KPIs: Project Completion Time, On-Time Delivery %, Equipment Utilization %, Labor Productivity.
💰 Financial KPIs: Revenue per Project, Profit Margin, Cost per Sq Ft, Budget Variance %.
😊 Customer KPIs: Customer Satisfaction (CSAT %), Repeat Business Rate, Complaint Resolution Time, Quality Pass Rate %.
🧠 Best Practices for Maximum Impact
📌 Keep Excel data clean and consistent.
📌 Update Actual and Target values monthly.
📌 Assign KPI owners for clear accountability.
📌 Use drill-through and slicers for focused analysis.
📌 Automate Power BI refresh for real-time accuracy.
📌 Review KPIs quarterly to match business priorities.
👥 Who Can Benefit
🌱 Landscaping Business Owners – Monitor operations and profitability.
🧾 Project Managers – Track timelines and resource efficiency.
💼 Finance Teams – Analyze costs and margins.
📊 Consultants & Analysts – Present data-driven insights to clients.


Reviews
There are no reviews yet.