

In today’s agriculture and water-management landscape, data-driven performance tracking is no longer optional — it’s essential. The Irrigation Systems KPI Dashboard in Excel offers a ready-to-use, automated, and visual solution for monitoring every critical irrigation metric — from water usage and pump uptime to maintenance cost and system efficiency.
Built entirely in Microsoft Excel, this dashboard converts raw irrigation data into actionable insights that help farmers, consultants, and policymakers make smarter water-management decisions. No coding or add-ons required — just structured data, dynamic charts, and instant results.
Whether you manage farm-level irrigation systems or regional water projects, this tool empowers you to analyze trends, reduce waste, and improve sustainability. 🌾💧
⚙️ Key Features of the Irrigation Systems KPI Dashboard in Excel
📊 7 Sheets Included: Home, Dashboard, KPI Trend, Actual Numbers, Targets, Previous Year, KPI Definition.
📅 Dynamic Month Selector: Choose any month to update visuals automatically.
📈 MTD & YTD Tracking: Monitor Month-to-Date and Year-to-Date performance.
🎯 Actual vs Target vs Previous Year: Instantly compare historical trends.
🟢🔴 Visual Indicators: Green = Improving | Red = Needs Attention.
🔍 Interactive Trend Charts: Deep dive into KPI fluctuations over time.
🧾 Editable KPI Library: Add, modify, or remove metrics easily.
💡 No Macros Required: Runs entirely on Excel formulas & conditional formatting.
💻 Fully Compatible: Works on Excel 2013+, 365 (Windows & Mac).
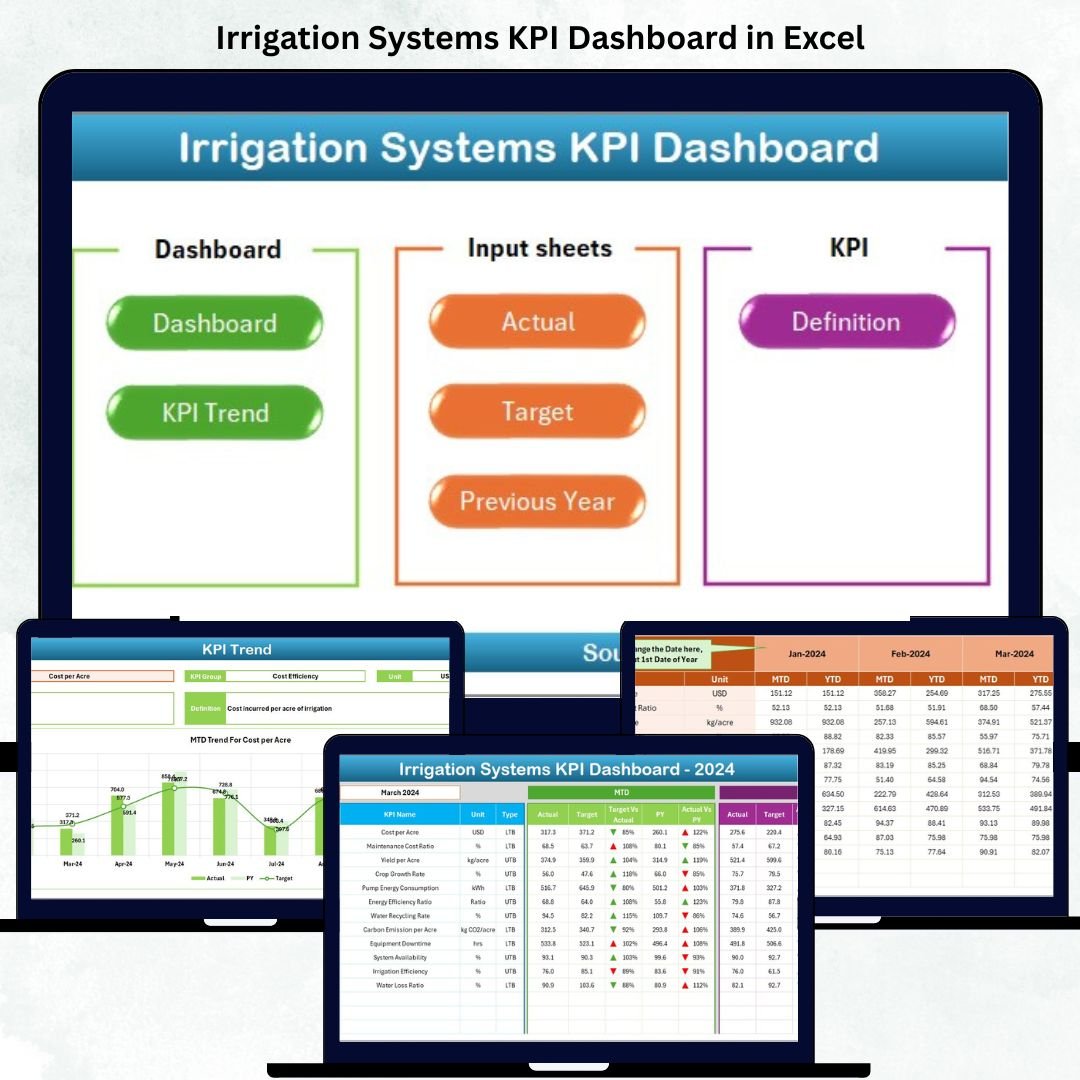
📊 Dashboard Structure Overview
🏠 1️⃣ Home Sheet – Easy Navigation
Six clickable buttons connect directly to all analysis sheets.
💡 Purpose: Quick movement across dashboard sections for multi-project users.
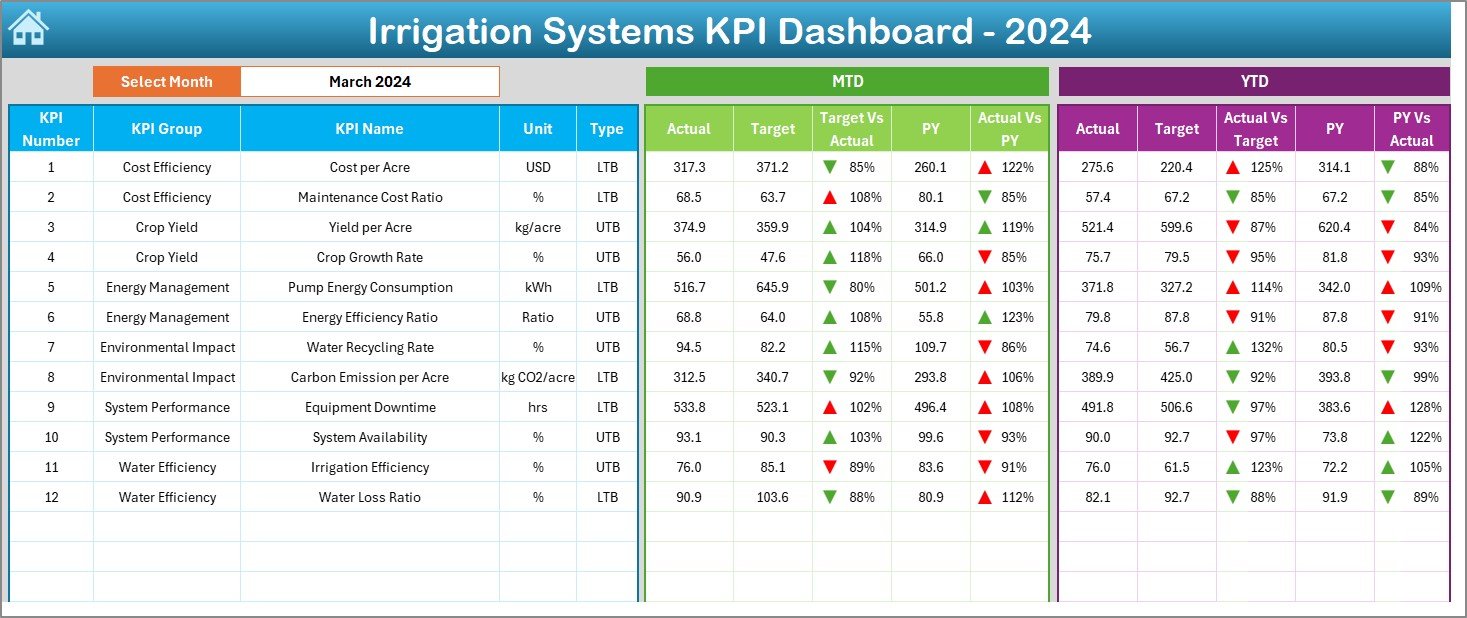
💧 2️⃣ Dashboard Sheet – Central Performance View
The main hub showcasing irrigation KPIs.
-
Month Selector (D3): Auto-updates charts & tables.
-
MTD & YTD Sections: Compare Actual vs Target vs Previous Year.
-
Performance Arrows: ▲ / ▼ icons indicate improvement or decline.
-
KPIs Displayed: Water Efficiency (%), Pump Uptime (%), System Pressure (psi), Maintenance Cost (USD), Coverage Ratio (%).
💡 Purpose: Real-time insight into irrigation efficiency and cost performance.
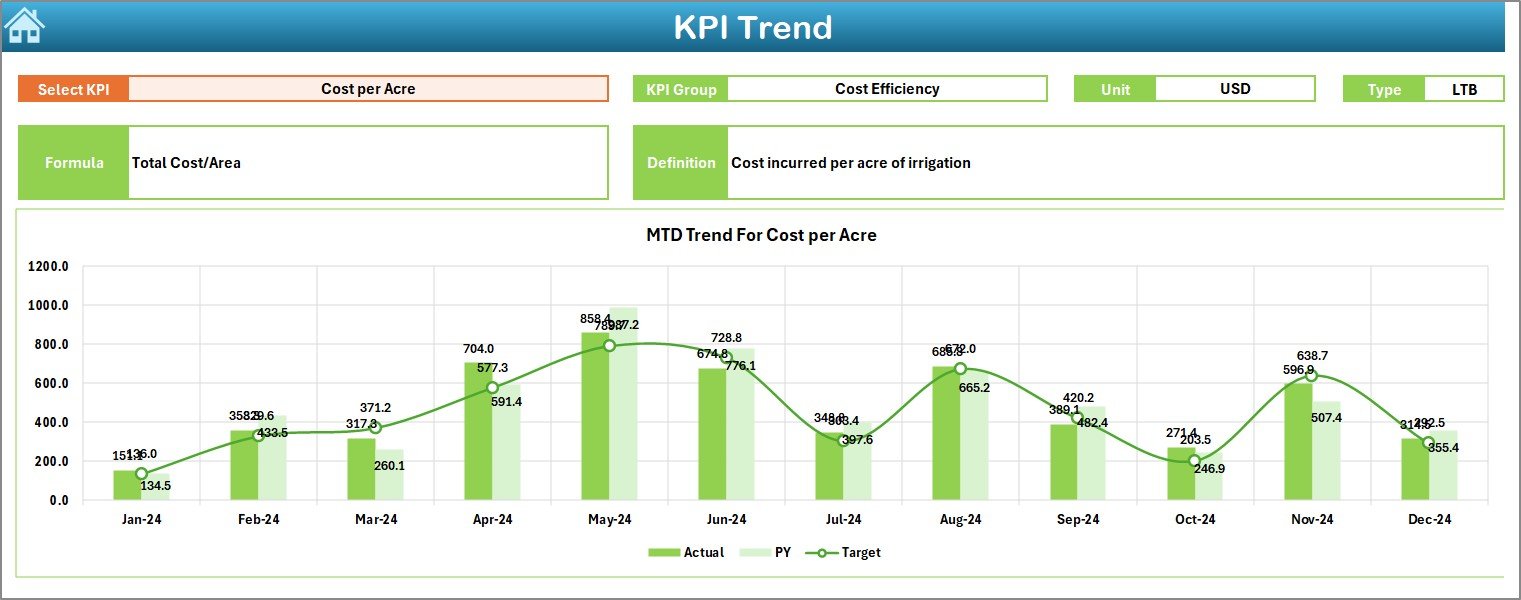
📈 3️⃣ KPI Trend Sheet – Detailed Analysis
Choose any KPI from the dropdown (C3) to explore monthly performance trends.
-
Displays KPI Group, Unit, Formula, and Type (LTB/UTB).
-
Interactive charts show Actual, Target, and PY lines.
💡 Purpose: Identify seasonal patterns and performance anomalies.
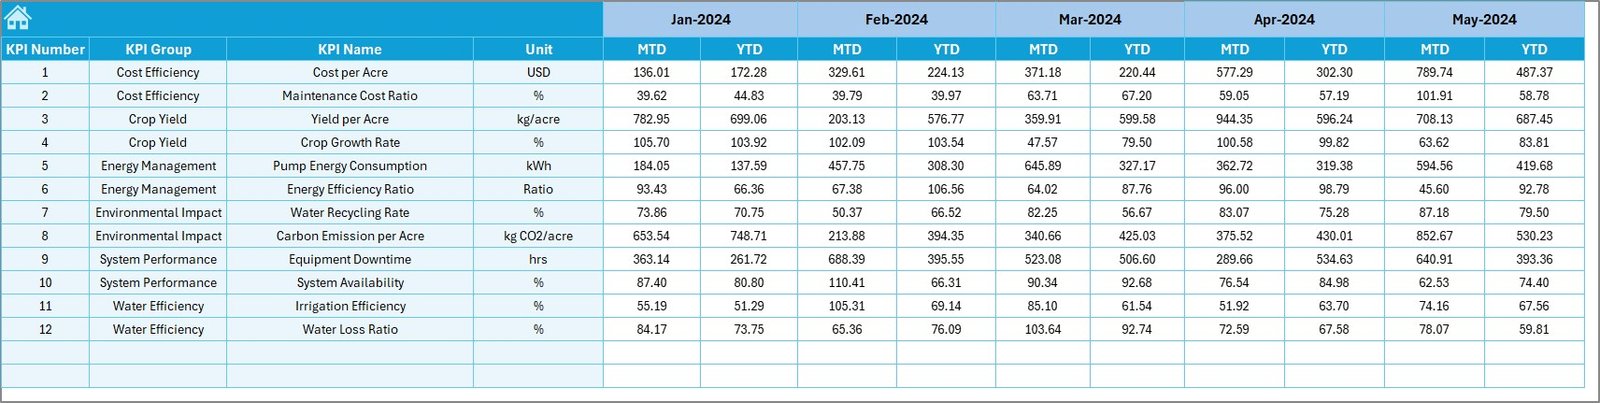
📋 4️⃣ Actual Numbers Sheet – Data Entry Hub
Input MTD and YTD values each month.
-
Includes data validation for error-free entry.
-
Dynamically links to the Dashboard for instant updates.
💡 Purpose: Maintain consistent, accurate source data for analytics.
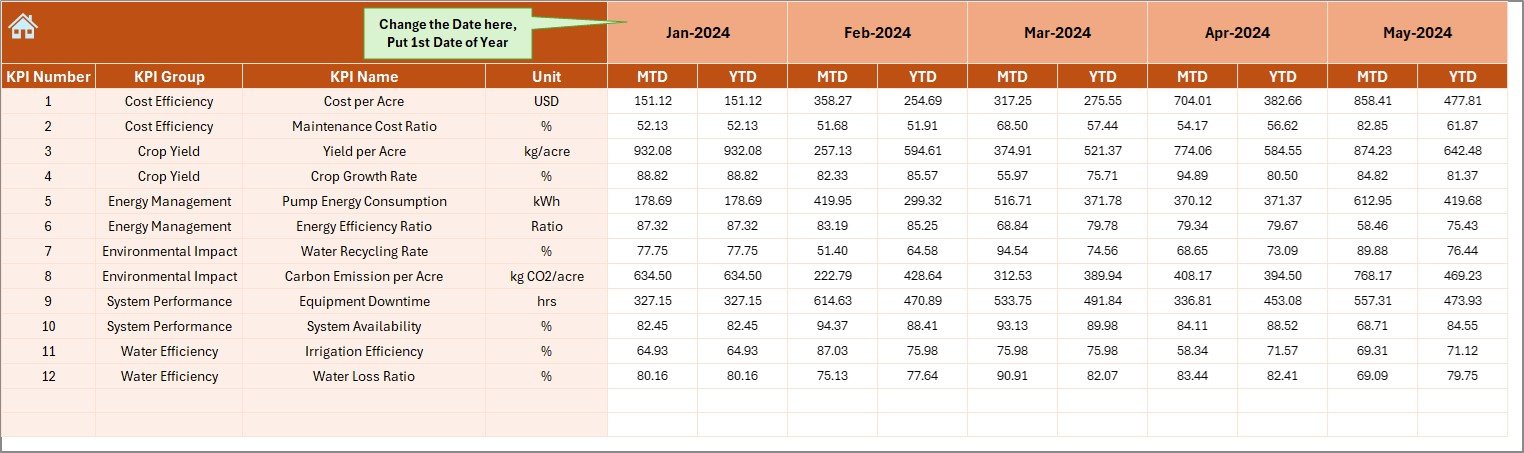
🎯 5️⃣ Target Sheet – Goal Tracking
Set monthly and annual targets for every KPI.
-
Supports seasonal goals (pre-monsoon / harvest periods).
💡 Purpose: Benchmark actual performance against strategic objectives.
📆 6️⃣ Previous Year Sheet – Benchmarking History
Store last year’s performance for comparison and trend evaluation.
💡 Purpose: Highlight year-on-year efficiency improvement.
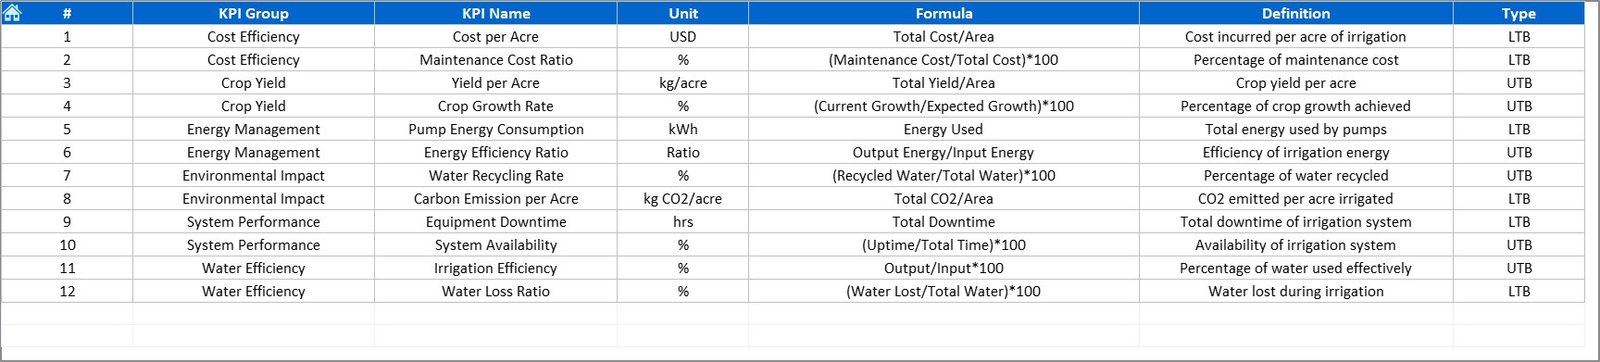
📘 7️⃣ KPI Definition Sheet – Reference Guide
Defines each metric with its formula, unit, and direction (Lower or Upper the Better).
💡 Purpose: Standardize understanding and reporting across teams.
🌟 Advantages of Using This Dashboard
✅ Centralized Monitoring: All irrigation KPIs in one file.
✅ Real-Time Decision-Making: Change month → see instant results.
✅ Improved Efficiency: Detect leaks or low uptime early.
✅ Full Transparency: All formulas visible for auditability.
✅ Historical Comparison: Track growth and seasonal trends.
✅ Cost Optimization: Reduce energy and maintenance expenses.
✅ Customizable Framework: Adapt KPIs to local conditions.
💡 Best Practices for Using the Dashboard
📌 Update monthly to keep data relevant.
📌 Validate input values before refresh.
📌 Define clear targets for each KPI.
📌 Review trends to detect performance shifts.
📌 Train staff on KPI interpretation.
📌 Back up data regularly.
📌 Use color alerts only for critical deviations.
🌾 Who Can Benefit from This Dashboard
🚜 Farm Managers and Agri Startups
🏢 Water Utility Companies
🏛️ Government Irrigation Departments
🔧 Irrigation Consultants and Engineers
🌍 NGOs focused on Water Sustainability
🧩 Conclusion
The Irrigation Systems KPI Dashboard in Excel is more than a reporting tool — it’s a complete irrigation performance intelligence system. By combining automation, visualization, and KPI-based benchmarking, it empowers organizations to make smarter water-management decisions, reduce waste, and boost long-term productivity.
💧 Measure what matters, optimize what you manage — with NextGen Templates’ Irrigation Systems KPI Dashboard in Excel.


Reviews
There are no reviews yet.