
Investor services teams manage sensitive client data, high-volume operations, strict reporting timelines, and compliance-driven processes. Every day, they handle investor onboarding, transaction processing, reconciliations, document reviews, and service-quality KPIs. Without a structured reporting system, these teams rely on scattered spreadsheets—creating delays, confusion, and inconsistent performance tracking.
The Investor Services KPI Dashboard in Excel solves these challenges instantly. This ready-to-use Excel dashboard centralizes all key performance indicators into one clean, interactive, and easy-to-update reporting system. With built-in MTD & YTD tracking, target comparisons, PY benchmarks, trend charts, and KPI definitions, investor service teams gain complete visibility of their operational performance in seconds.
Whether you’re reviewing service turnaround times, error rates, reporting accuracy, or client satisfaction metrics, this dashboard ensures fast, reliable, and structured insights every month.
✨ Key Features of Investor Services KPI Dashboard in Excel
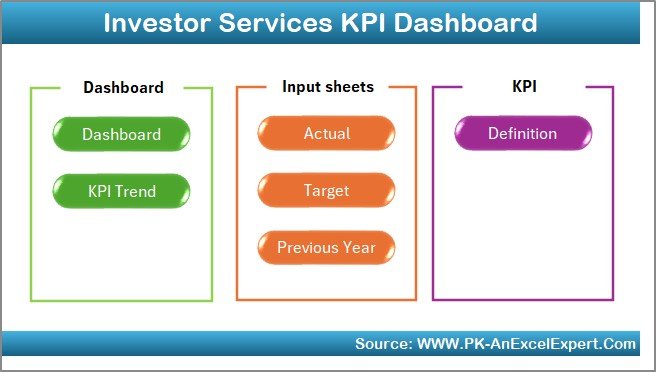
📌 1. Smart Home Page Navigation
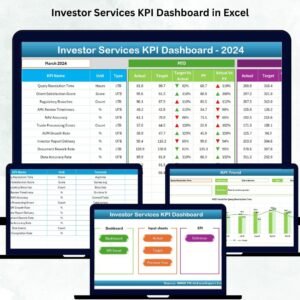
The Home sheet works like a command center. With six quick-access buttons, users navigate instantly to the Dashboard, Trend Sheet, Input Sheets, Target Sheet, PY Sheet, and KPI Definition page. This eliminates confusion and makes the dashboard ideal for teams handling dozens of KPIs.
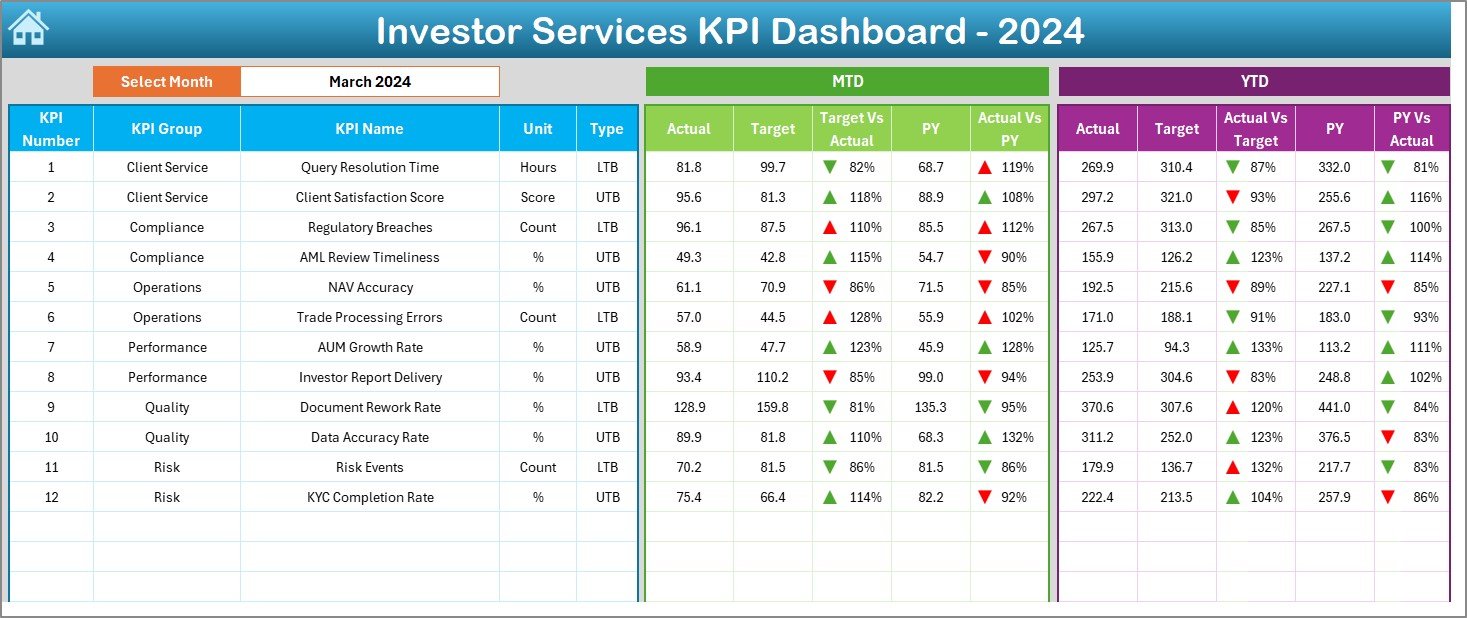
📊 2. KPI Dashboard – Complete MTD & YTD Visibility
The Dashboard sheet is where all performance metrics come together.
You simply select the reporting month from a drop-down in cell D3, and the entire dashboard refreshes automatically.
You see:
✔ MTD Actual, Target & Previous Year
✔ Target vs Actual (%)
✔ PY vs Actual (%)
✔ Conditional Formatting Indicators (▲ good performance, ▼ poor performance)
You also get the same structure for YTD performance, displayed side-by-side with MTD for clear comparisons.
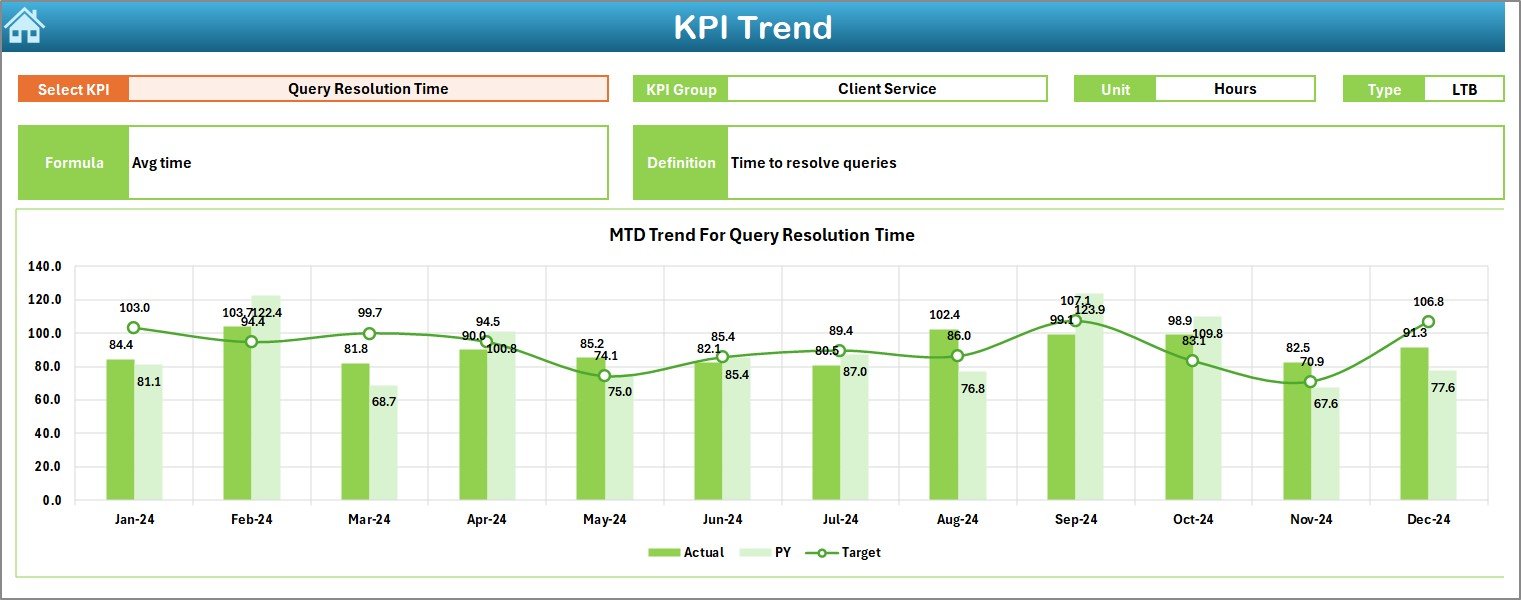
📈 3. KPI Trend Page – Visual Performance Insights
This page helps you analyze how each KPI is performing over time.
You select a KPI from the drop-down in cell C3, and the sheet displays:
📌 KPI Group
📌 KPI Unit
📌 KPI Type (LTB/UTB)
📌 KPI Formula
📌 KPI Definition
It also includes two trend charts:
✨ MTD Trend (Actual, Target, PY)
✨ YTD Trend (Actual, Target, PY)
These visuals help teams identify seasonal changes, recurring bottlenecks, and long-term performance patterns.
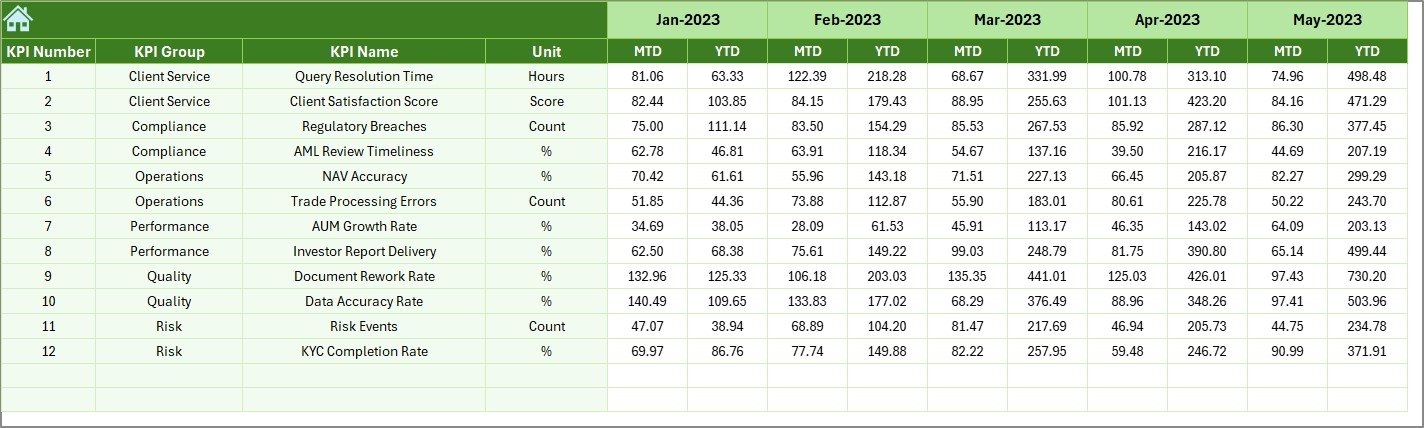
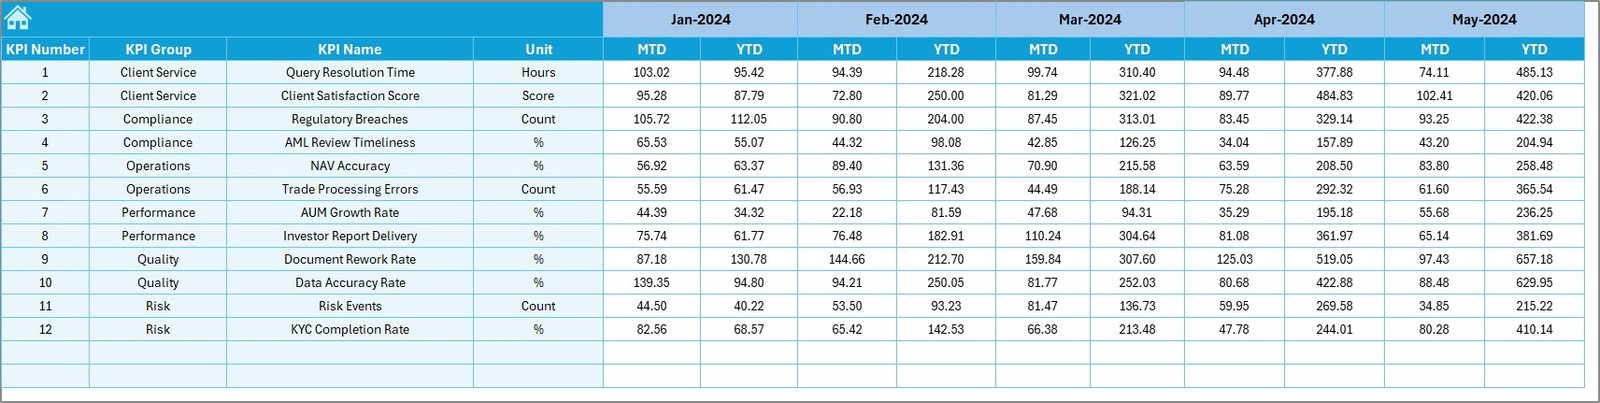
📝 4. Structured Input Sheets for Accuracy
You update:
📍 Actual Numbers Input Sheet (MTD & YTD Actuals + Month)
📍 Target Sheet (MTD & YTD Target values)
📍 Previous Year Sheet (PY MTD & YTD values)
All dashboards automatically update based on these sheets, eliminating errors and manual report creation.
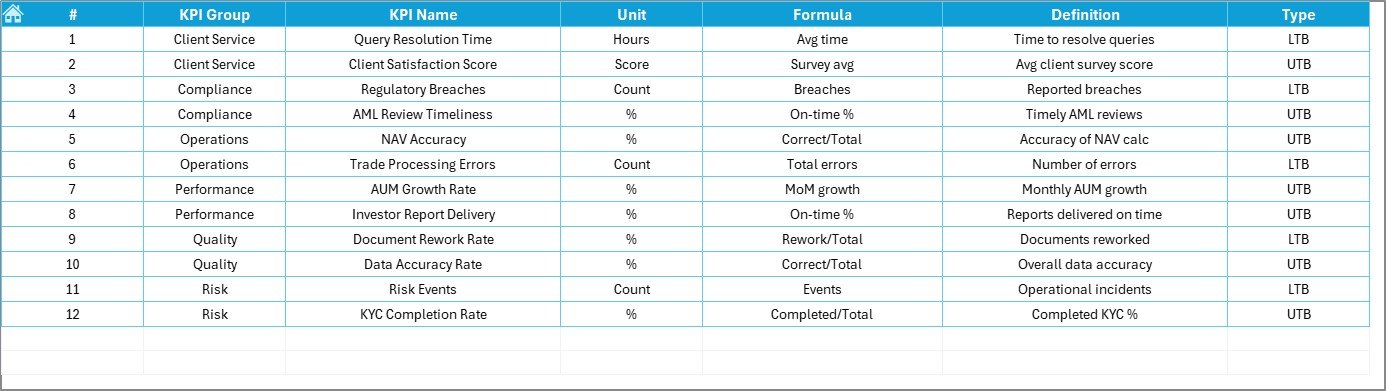
📘 5. Comprehensive KPI Definition Page
This sheet provides full clarity for every KPI:
✔ KPI Name
✔ KPI Group
✔ Unit
✔ Formula
✔ Definition
✔ Type (LTB/UTB)
New team members, auditors, and managers instantly understand what each KPI represents.
📦 What’s Inside the Investor Services KPI Dashboard
When you download this template, you receive:
⭐ Ready-to-Use Excel Dashboard
⭐ Dashboard Sheet with visual KPI cards and performance tables
⭐ Interactive KPI Trend Page
⭐ Home Navigation Sheet
⭐ Actual Numbers Input Sheet
⭐ Target Sheet
⭐ Previous Year Data Sheet
⭐ KPI Definition Sheet
Everything is already formatted and linked—simply enter numbers and refresh.
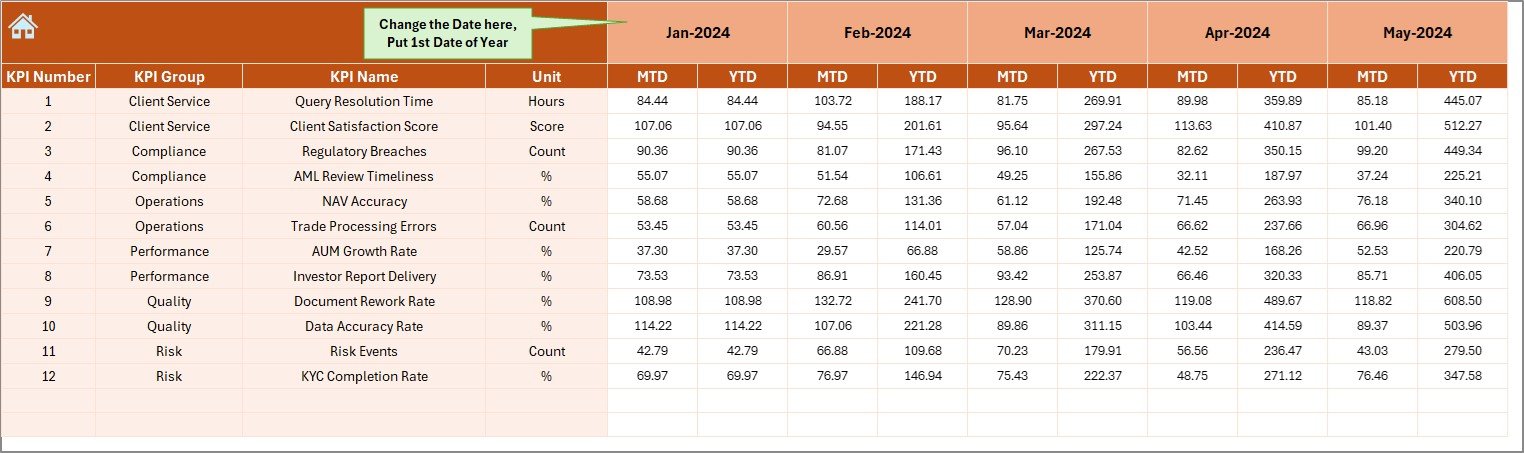
🛠️ How to Use the Investor Services KPI Dashboard
1️⃣ Choose Reporting Month – Select the month in D3 to refresh all visuals.
2️⃣ Update Actuals – Enter MTD & YTD values in the Actual Input Sheet.
3️⃣ Enter Targets – Fill monthly target numbers in the Target Sheet.
4️⃣ Enter Previous Year Data – Add PY values for comparison.
5️⃣ Analyze Trends – Use the KPI Trend sheet to view charts and definitions.
6️⃣ Review Performance – Compare Actuals vs Targets and CY vs PY.
7️⃣ Use Navigation Buttons – Move between sheets effortlessly.
No technical skills required—Excel users can operate the dashboard easily.
👥 Who Can Benefit from This Investor Services Dashboard?
This dashboard is ideal for:
💼 Asset Management Firms
📊 Investor Relations Teams
📁 Fund Administration Units
🏦 Investment Operations Teams
📑 Portfolio Services Teams
💻 Back-Office Processing Units
📈 Compliance & Reporting Teams
If your teams track service quality, operational accuracy, or monthly reporting KPIs, this dashboard becomes an essential tool.


Reviews
There are no reviews yet.