Managing investments should feel smart and strategic — not complicated and time-consuming. Yet many investors and financial professionals still struggle with scattered spreadsheets, manual calculations, and delayed performance analysis. That’s exactly why the Investment Management Dashboard in Power BI was created.This ready-to-use dashboard transforms complex investment data into clear, interactive, and actionable insights. Instead of reviewing multiple financial reports, you can monitor portfolio performance, ROI trends, and investment allocation from one centralized analytics platform.Built using Power BI’s advanced visualization capabilities, this dashboard helps investors track invested capital, evaluate portfolio health, analyze regional performance, and identify profitable investment opportunities instantly.
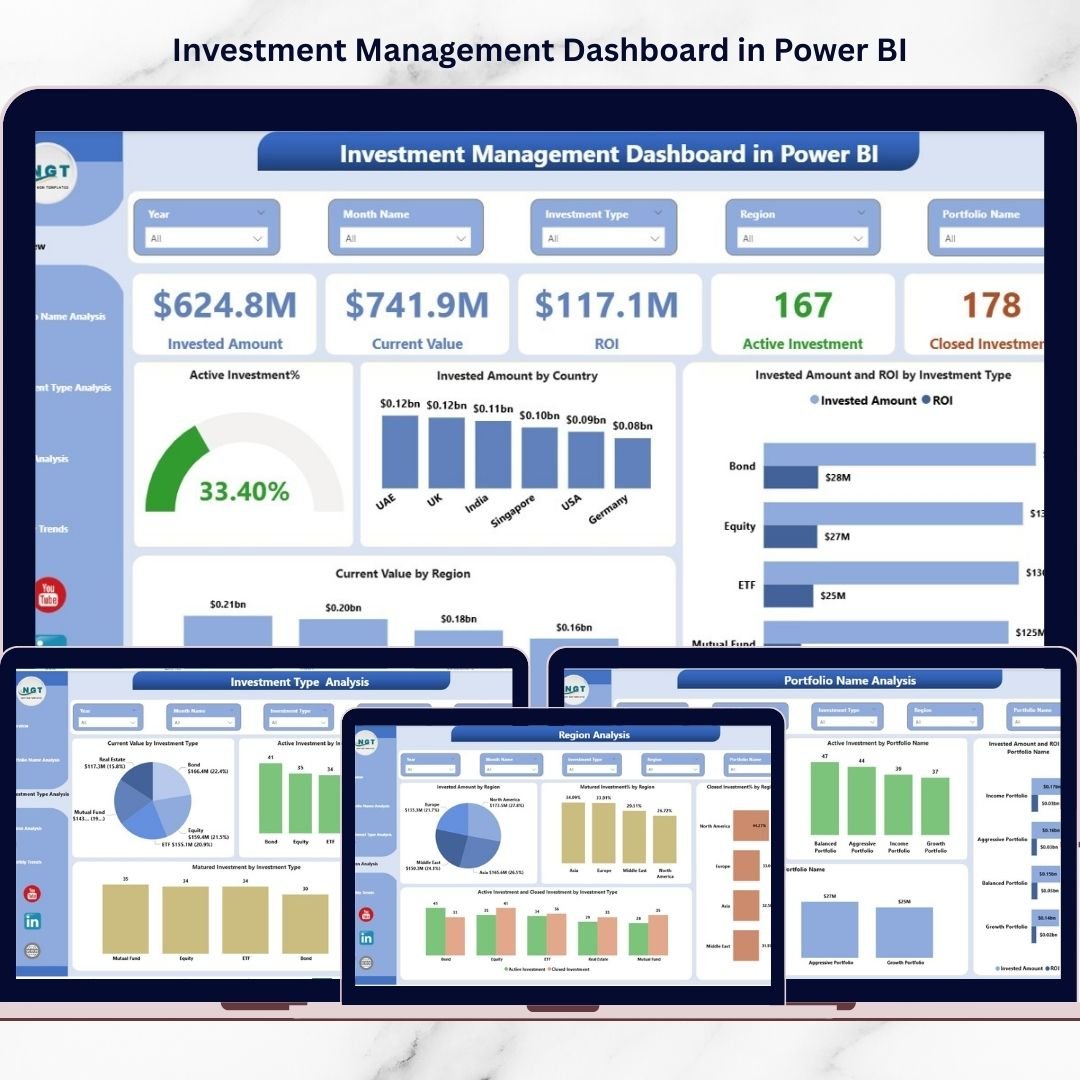
Whether you manage personal investments or oversee institutional portfolios, this dashboard provides a complete 360-degree view of investment performance through five powerful analytical pages: Overview, Portfolio Analysis, Investment Type Analysis, Region Analysis, and Monthly Trends.
With dynamic slicers, automated KPIs, and interactive visuals, decision-making becomes faster, smarter, and data-driven.
🚀 Key Features of Investment Management Dashboard in Power BI
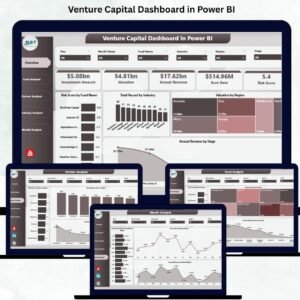
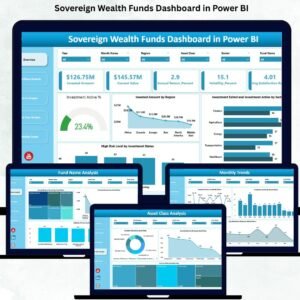
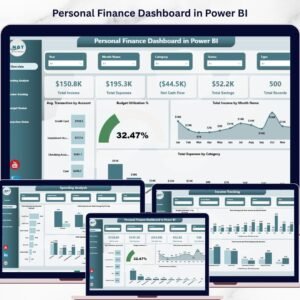
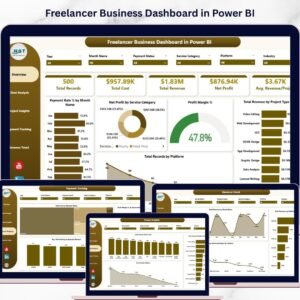
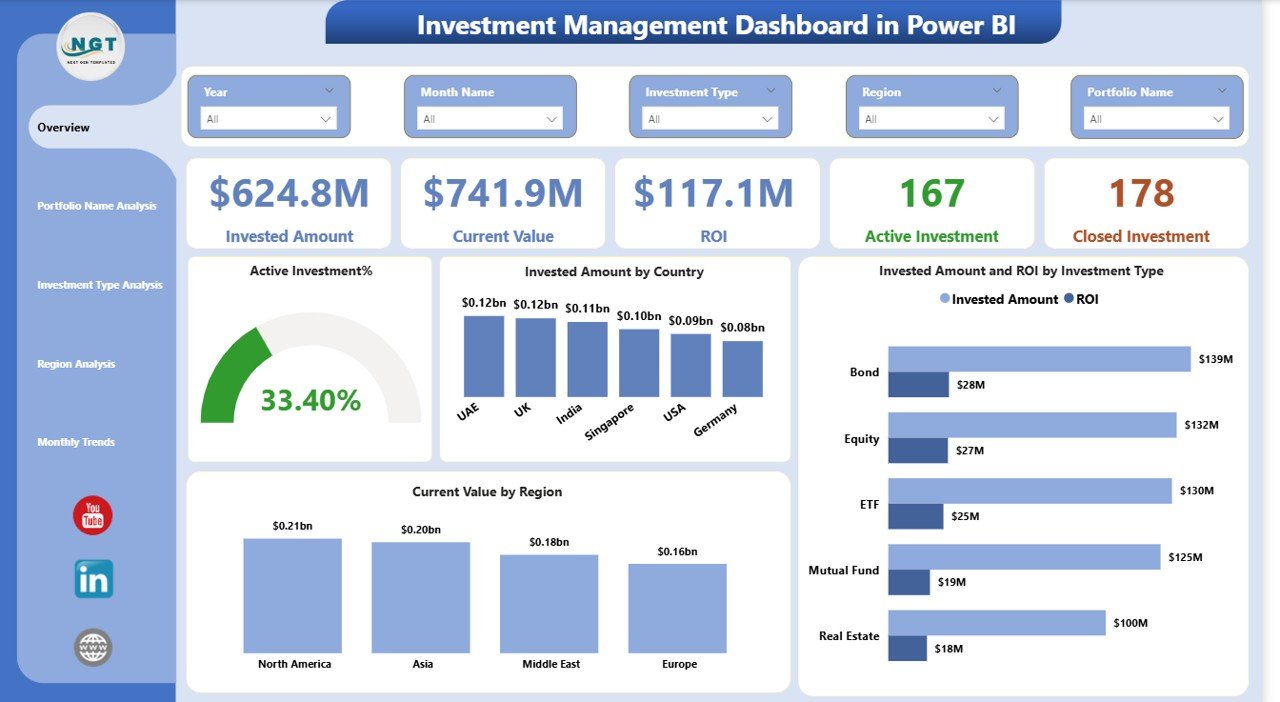
📊 Interactive KPI Monitoring – Instantly track Invested Amount, Current Value, ROI, Active Investments, and Closed Investments.
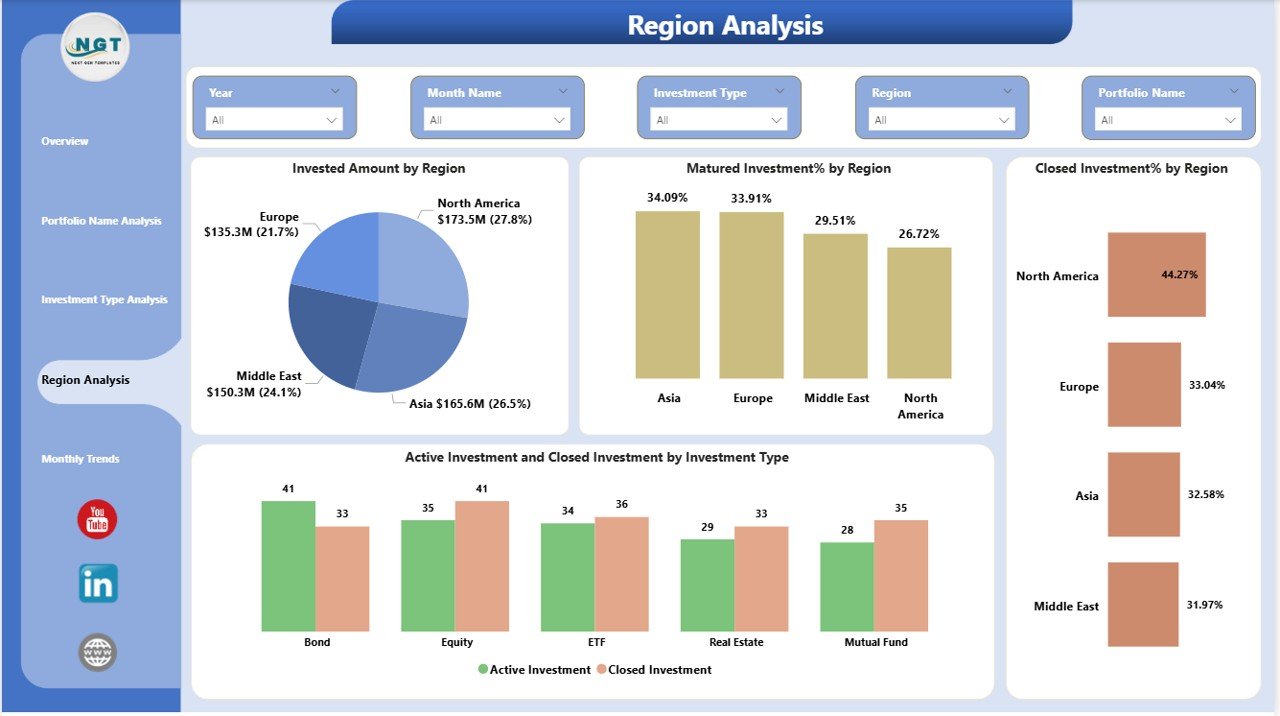
🌍 Geographical Investment Analysis – Understand regional performance and diversification risks easily.
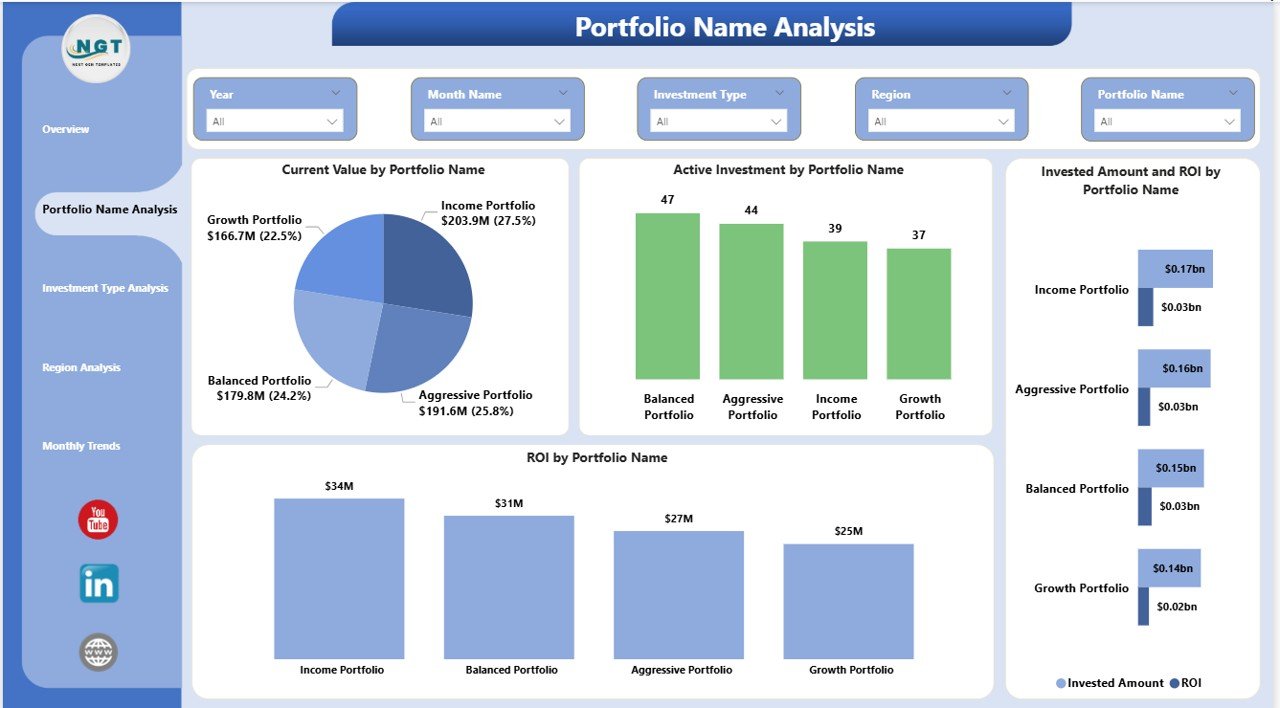
📈 Portfolio Performance Tracking – Compare multiple portfolios to identify top and underperforming investments.
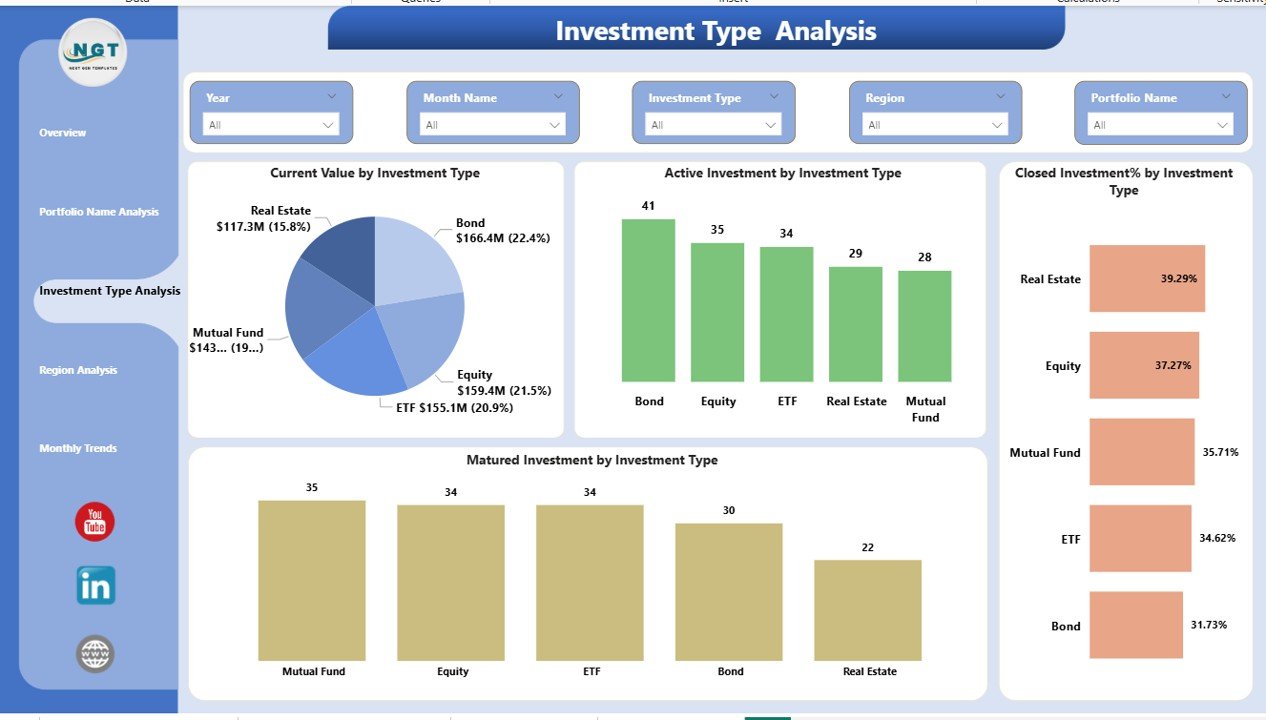
🔎 Investment Type Insights – Analyze equities, bonds, real estate, or other categories with dynamic visuals.
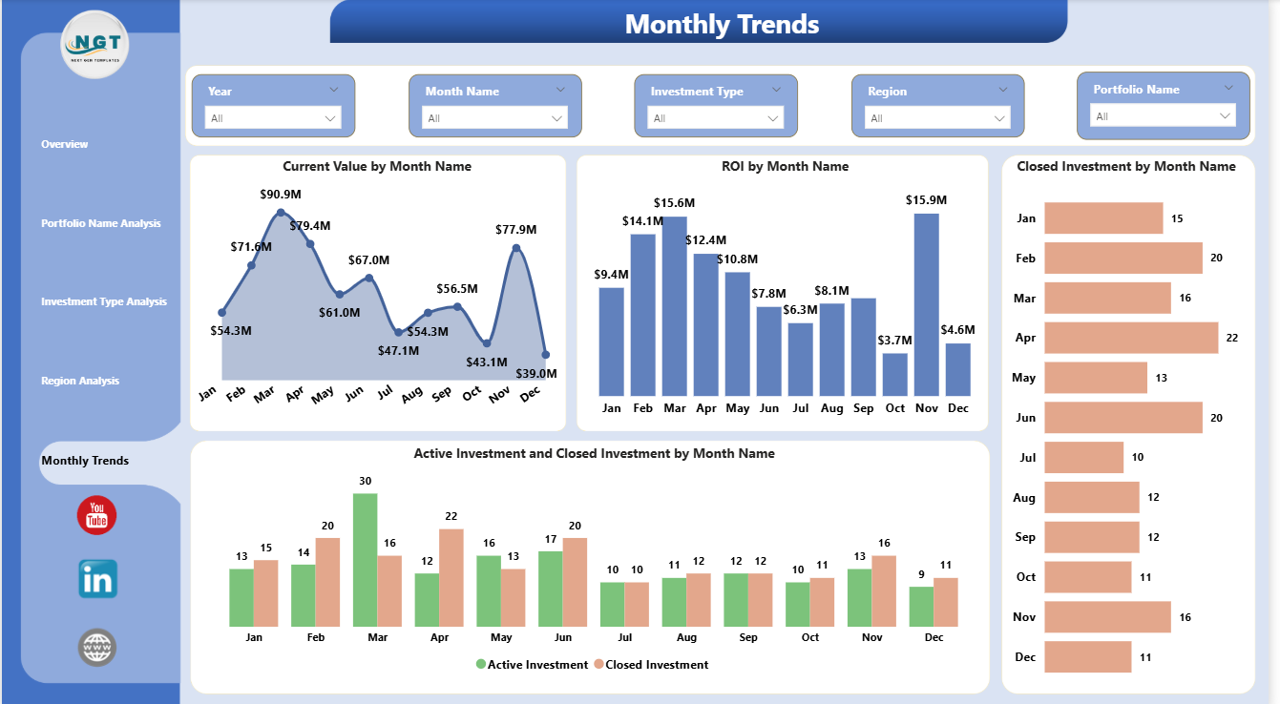
📅 Monthly Trend Analysis – Monitor ROI fluctuations and investment growth patterns over time.
⚡ Dynamic Filters & Slicers – Explore insights instantly using interactive filtering options.
🧠 Automated Calculations – Eliminate manual formulas and reporting errors.
📑 Professional Financial Reporting – Present investment performance clearly to stakeholders.
📦 What’s Inside the Investment Management Dashboard in Power BI
When you download this product, you receive a professionally designed Power BI dashboard containing:
✅ Overview Dashboard Page with KPI cards and summary visuals
✅ Portfolio Name Analysis Page for portfolio comparison
✅ Investment Type Analysis Page for category performance
✅ Region Analysis Page for geographic insights
✅ Monthly Trends Page for time-based analytics
✅ Ready-to-use data model structure
✅ Interactive slicers and dynamic visuals
✅ Fully customizable Power BI file
Everything is pre-built so you can start analyzing immediately.
⚙️ How to Use the Investment Management Dashboard in Power BI
Using this dashboard is simple — even for beginners.
1️⃣ Import your investment dataset into Power BI.
2️⃣ Refresh the dashboard to update KPIs automatically.
3️⃣ Use slicers to filter by portfolio, investment type, or region.
4️⃣ Analyze ROI trends and performance visuals.
5️⃣ Identify growth opportunities and optimize investment strategies.
Within minutes, your investment data turns into professional analytics reports.
👥 Who Can Benefit from This Investment Management Dashboard
This dashboard is designed for a wide range of financial professionals and investors:
💼 Portfolio Managers managing multiple investment portfolios
📊 Financial Analysts performing performance evaluation
💰 Wealth Advisors tracking client investments
🏢 Investment Firms requiring centralized analytics
📈 Individual Investors seeking smarter decision-making
🏦 Asset Management Companies monitoring diversification
👨💻 Finance Teams preparing performance reports
Whether beginner or expert, anyone can use this dashboard to understand investments more clearly.
By replacing manual reporting with interactive analytics, this dashboard helps you reduce risk, save time, and make confident investment decisions backed by real data.
Instead of guessing performance outcomes, you gain instant visibility into portfolio health, allocation balance, and profitability trends — all inside one powerful Power BI solution.
Click here to read the Detailed blog post
Watch the step-by-step video tutorial: