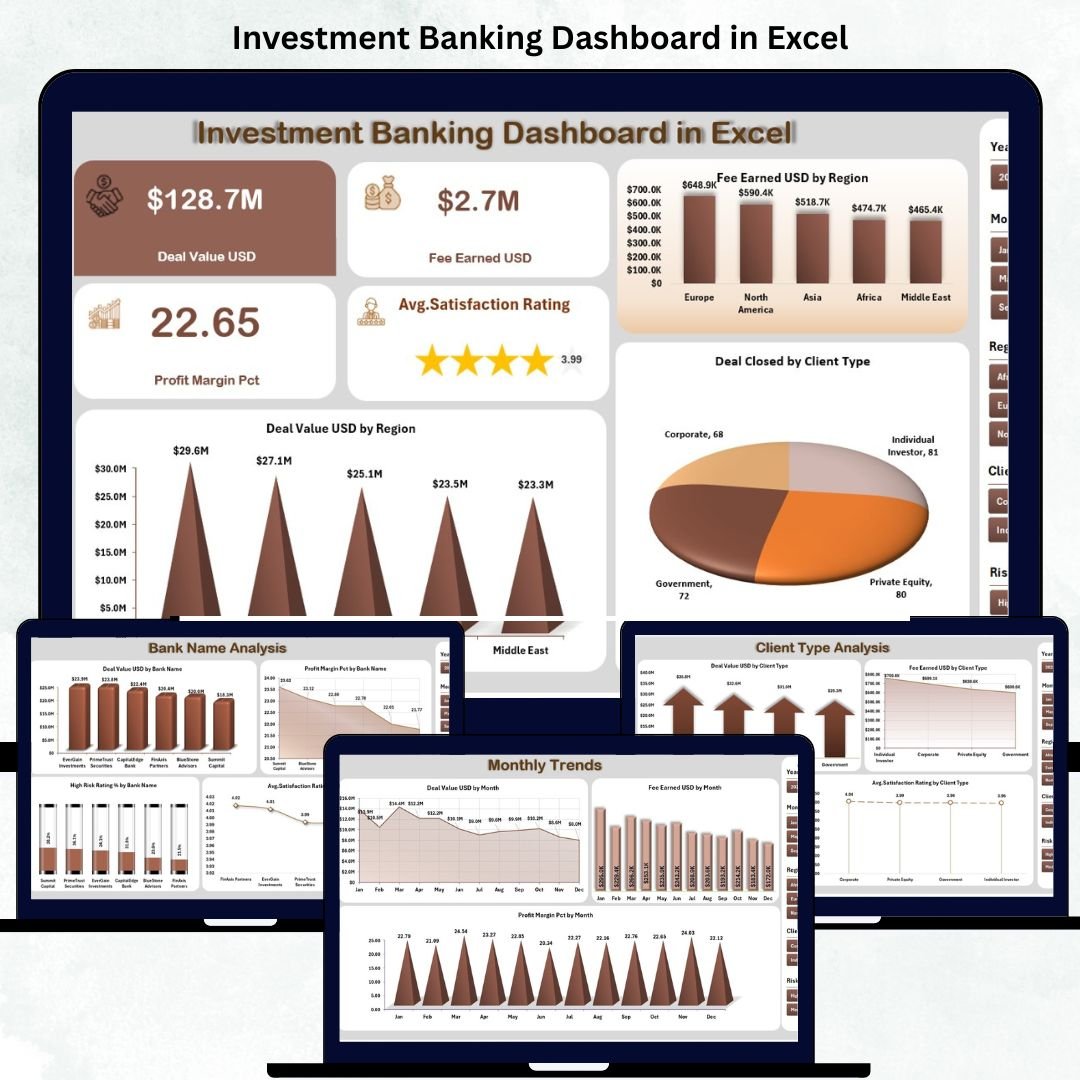
In today’s fast-moving financial world, investment banks deal with massive volumes of data every single day — from multi-million-dollar deals to client satisfaction, profit margins, and market risks. Without the right visualization tools, this valuable information can remain buried in spreadsheets. That’s where the Investment Banking Dashboard in Excel becomes your ultimate advantage.
This ready-to-use Excel-based dashboard converts raw banking data into clear, interactive visuals that help executives, analysts, and portfolio managers track deals, monitor profits, and evaluate performance — all in one centralized platform.
Built entirely in Microsoft Excel, it’s designed for simplicity, precision, and flexibility. You don’t need expensive BI software or coding skills — just plug in your data and get instant, actionable insights that drive smarter financial decisions.
⚙️ Key Features of the Investment Banking Dashboard in Excel
📊 Five Analytical Pages: Overview, Bank Analysis, Client Type Analysis, Sector Analysis, and Monthly Trends.
🧭 Page Navigator: Quickly move between pages using the left-side navigation panel.
📅 Dynamic Slicers: Filter instantly by month, region, or sector.
💰 KPI Cards: Display Total Deal Value, Total Fees Earned, and Profit Margin (%).
📈 Interactive Charts: Deal Value by Region, Fees by Bank, Profit by Sector, and Trend by Month.
🔍 Drill-Down Analysis: Explore details by Bank Name, Client Type, or Industry.
📑 Support & Data Sheets: Backend structure for easy updates and flexible data management.
✅ Fully Editable: Add new KPIs, charts, or data fields without altering core formulas.
💡 Real-Time Performance: Refresh slicers to update visuals instantly — no lag, no coding.
📊 What’s Inside the Dashboard
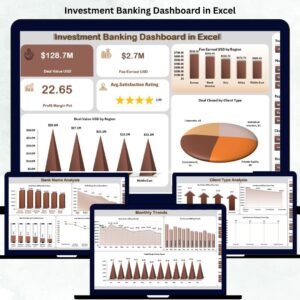
🏦 1️⃣ Overview Page – Performance at a Glance
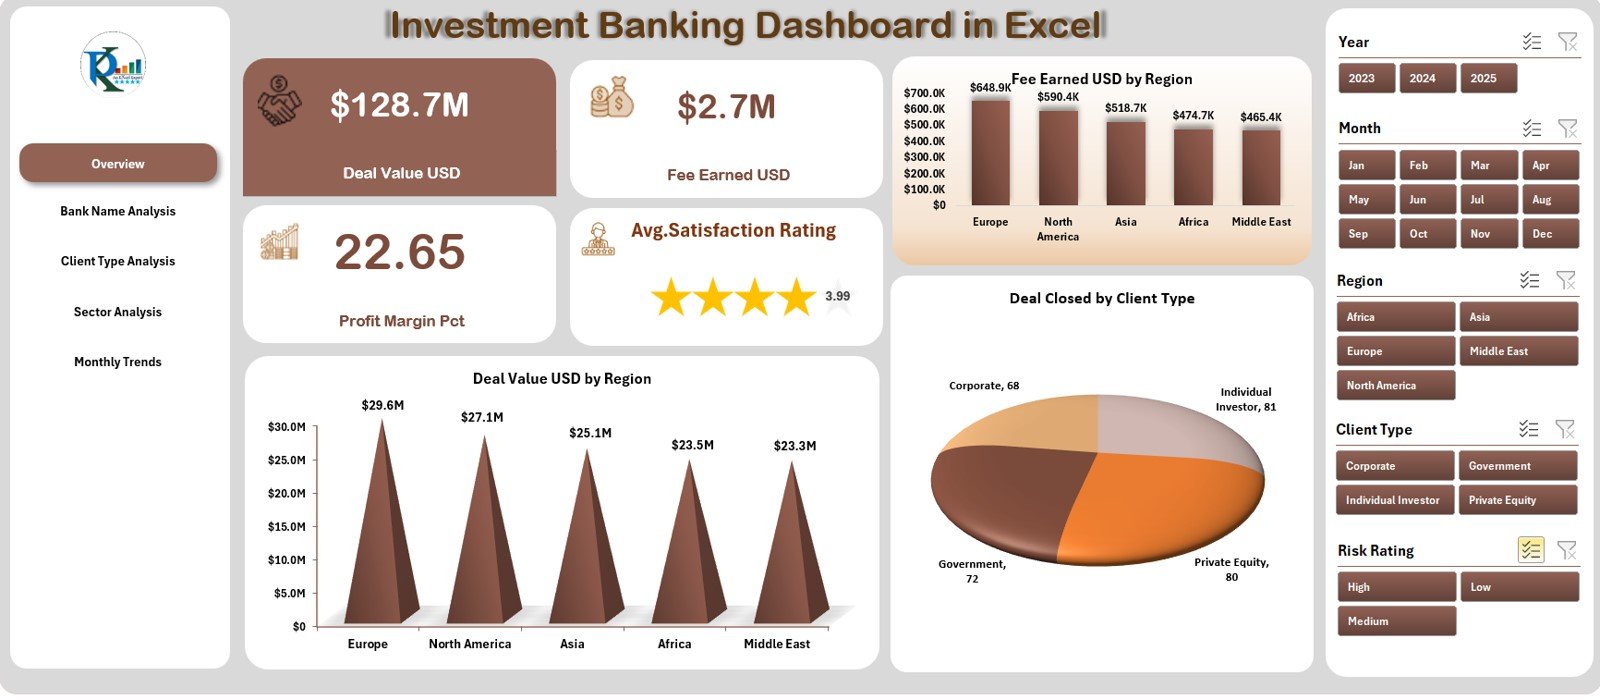
The heart of the dashboard.
-
Left panel: quick navigation.
-
Right side: slicers for Month and Region.
-
KPI cards for Total Deal Value, Total Fees, and Profit Margin.
-
Charts showing Deal Value by Region and Deals Closed by Client Type.
💡 Purpose: Provide an executive snapshot of financial performance in seconds.
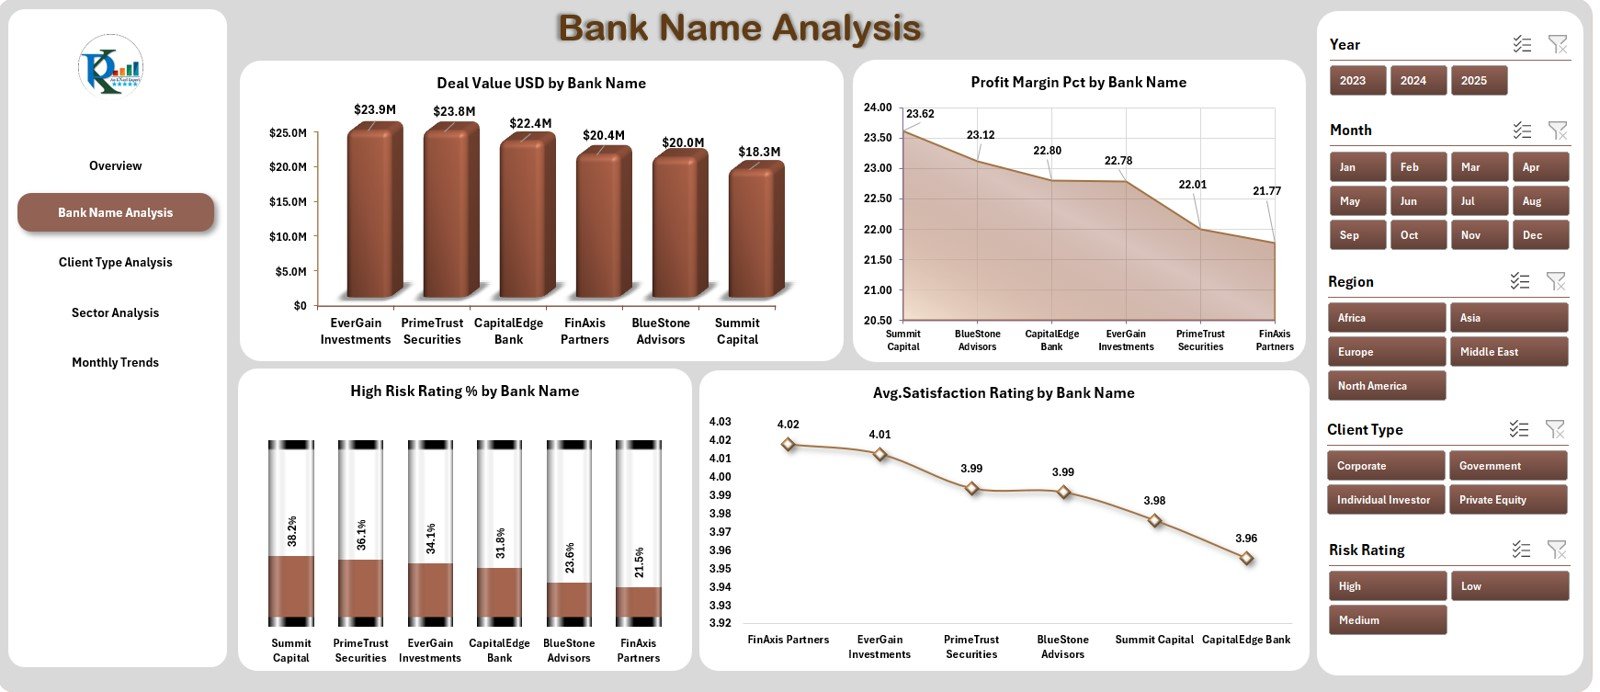
🏛️ 2️⃣ Bank Name Analysis – Compare Institutional Performance
Dive deep into how each bank performs.
-
Deal Value (USD) by Bank Name.
-
Profit Margin (%) by Bank.
-
High-Risk Rating (%) by Bank.
-
Average Client Satisfaction Score.
📊 Purpose: Identify strong performers and areas needing operational or strategic attention.
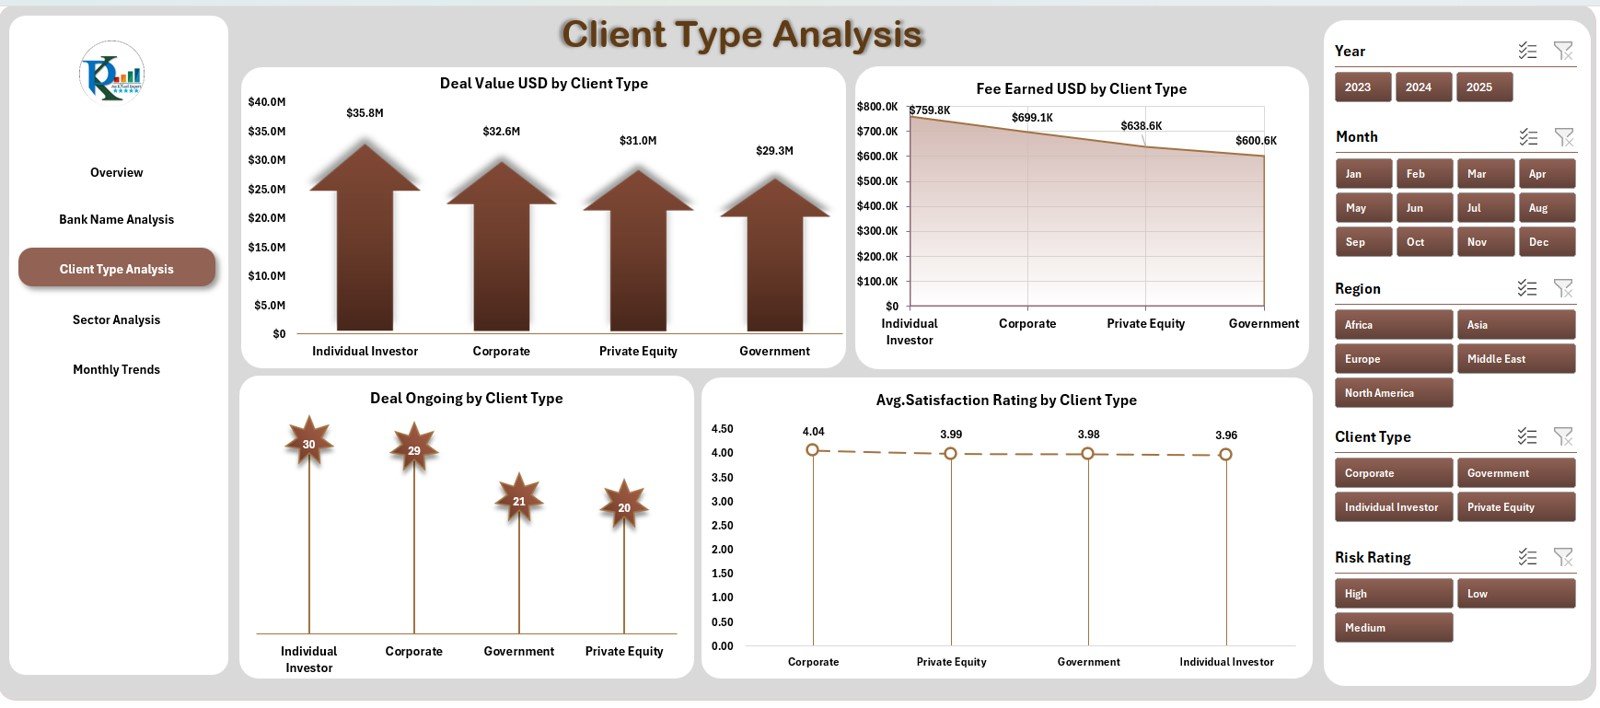
👥 3️⃣ Client Type Analysis – Understand Your Customer Segments
Measure contributions from retail, corporate, and institutional clients.
-
Deal Value and Fee Earned by Client Type.
-
Ongoing Deals and Average Satisfaction Scores.
💡 Purpose: Align resources with the most profitable and loyal client groups.
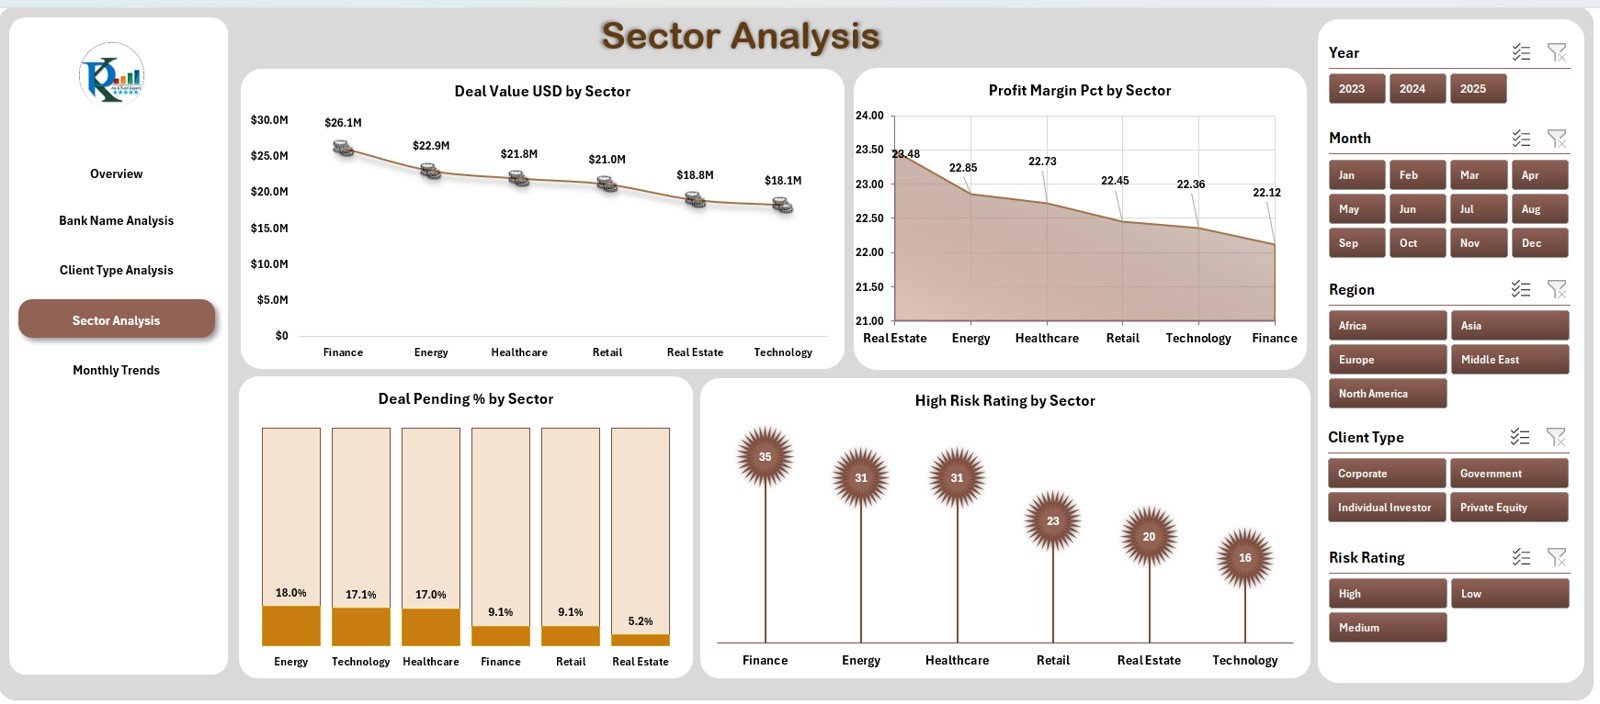
🏭 4️⃣ Sector Analysis – Track Industry Performance
Analyze deal volume and profitability by industry sectors such as Tech, Energy, Healthcare, and Real Estate.
-
Deal Value (USD) by Sector.
-
Profit Margin (%) and Risk Rating by Sector.
📈 Purpose: Discover high-growth sectors and balance your investment portfolio.
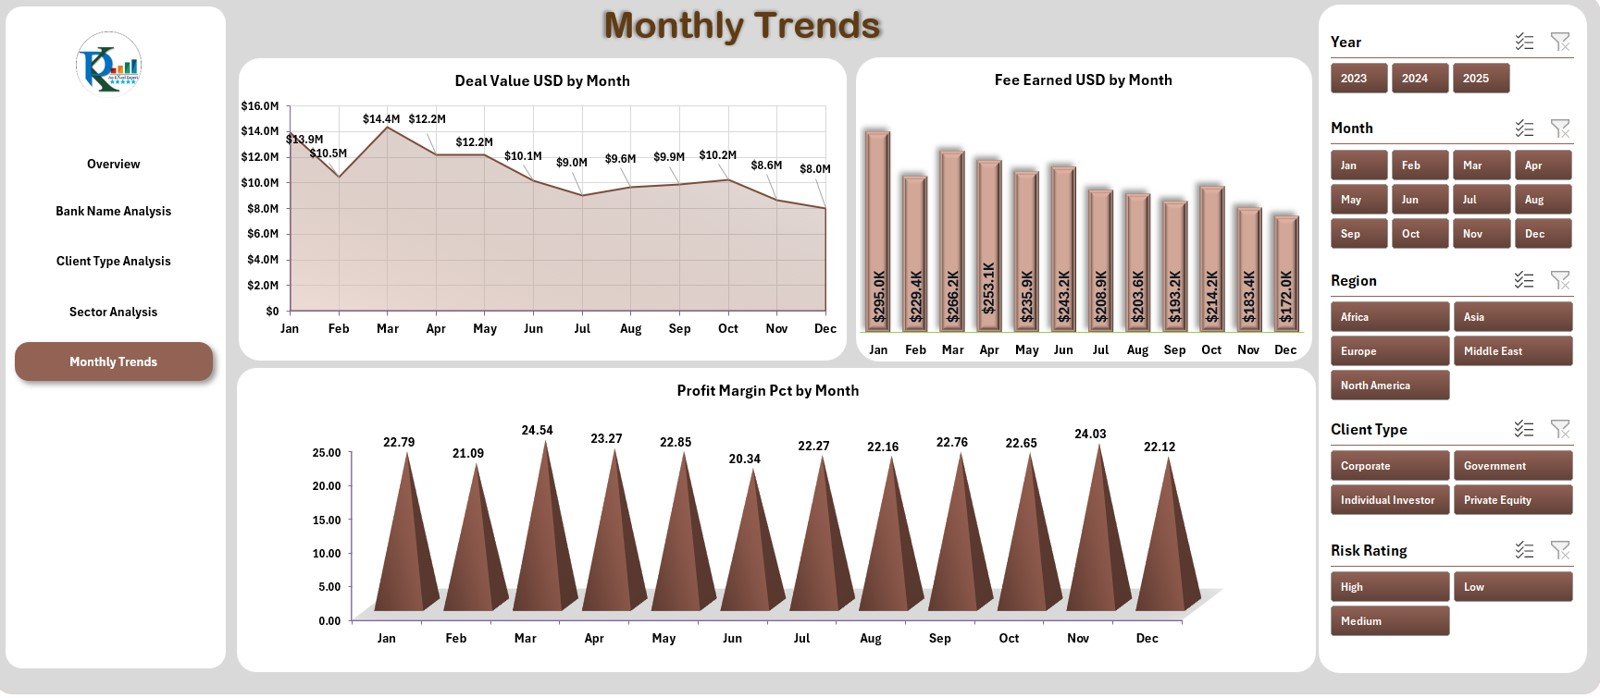
📅 5️⃣ Monthly Trends – Spot Growth and Seasonality
View time-based performance trends with dual charts.
-
Deal Value and Fee Earned by Month.
-
Profit Margin (%) over time.
📊 Purpose: Identify profitable periods, forecast future performance, and plan strategies accordingly.
🌟 Advantages of Using This Dashboard
✅ Centralized Data View: Consolidates all KPIs into one interactive file.
✅ Instant Insights: Use slicers to update visuals in real time.
✅ Better Decision-Making: Quickly identify trends, gaps, and high-value opportunities.
✅ Customizable Design: Adapt charts and KPIs to match your firm’s reporting needs.
✅ Professional Presentation-Ready: Ideal for investor decks and management reviews.
✅ Cost-Effective Solution: Harness Excel’s full analytics power — no BI license required.
✅ Collaboration Friendly: Share via email or cloud for team access.
💡 Best Practices for Effective Use
📌 Define clear KPIs before data entry.
📌 Validate raw data monthly to maintain accuracy.
📌 Use consistent colors and fonts for visual clarity.
📌 Protect core formulas and set data validation.
📌 Update monthly and compare YoY progress.
📌 Utilize conditional formatting to flag risks and opportunities.
📌 Back up previous versions to track historical performance.
🧩 Who Can Benefit from This Dashboard
💼 Investment Bankers – Monitor deal pipelines and profit margins.
📊 Financial Analysts – Analyze trends and KPIs for strategic reporting.
🏢 Portfolio Managers – Track sector-wise investment returns.
📈 Executives & CFOs – Gain a bird’s-eye view of institutional performance.
🤝 Client Relations Teams – Measure satisfaction and retention metrics.
🧠 Why Excel is Ideal for Investment Analytics
-
Universal, familiar interface for finance professionals.
-
Dynamic formulas and PivotCharts eliminate manual reporting.
-
No extra software costs or technical barriers.
-
Fully customizable and shareable across teams.
-
Scalable — can integrate with Power Query or Power BI for advanced analytics.
🧩 Conclusion
The Investment Banking Dashboard in Excel turns spreadsheets into a powerful financial control center. With five data-driven pages, it lets you monitor deals, profits, clients, and sectors from one intuitive interface.
Whether you’re presenting quarterly results or tracking daily deals, this dashboard ensures accuracy, clarity, and confidence in your decisions.
💼 Empower your banking team with data-driven intelligence today!


Reviews
There are no reviews yet.