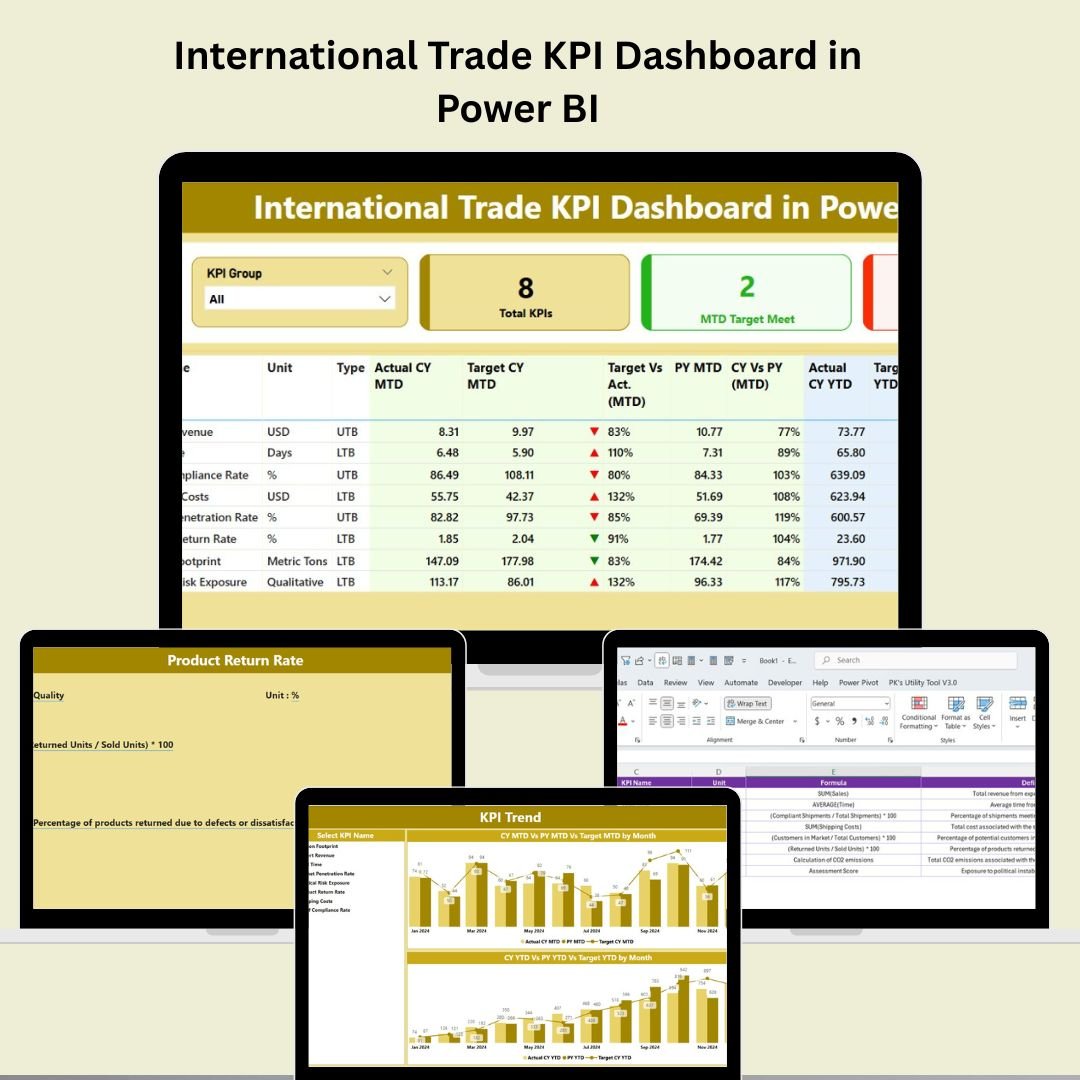
Managing global trade isn’t just about tracking exports and imports—it’s about turning complex trade data into decisions that drive success. That’s why we created the International Trade KPI Dashboard in Power BI—a dynamic, Excel-driven solution that transforms raw numbers into real-time insights you can act on.
Built for import-export professionals, analysts, and decision-makers, this ready-to-use Power BI dashboard helps you monitor key performance indicators, compare results over time, and align trade performance with your strategic goals—all in one place.
Let’s take a closer look at what this powerful trade analytics solution can do for your business 👇
✨ Key Features of International Trade KPI Dashboard in Power BI
📋 Summary Page – Your Real-Time Snapshot
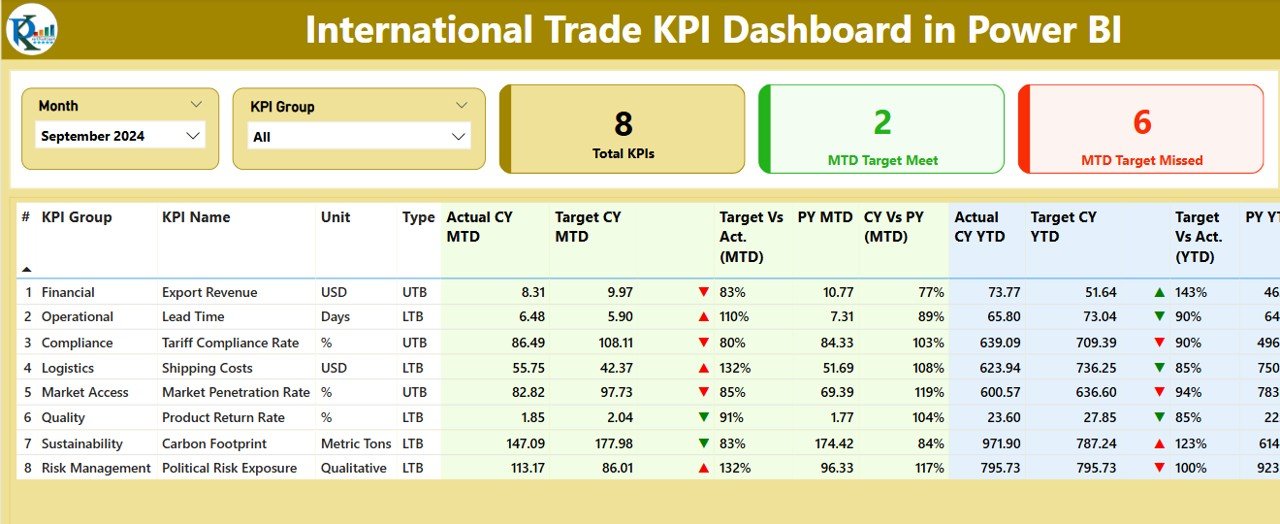
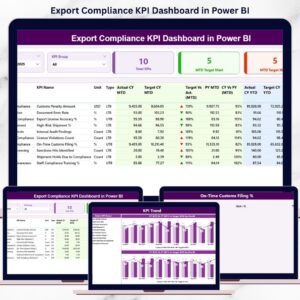
Track Month-To-Date and Year-To-Date performance at a glance:
-
🔄 Month and KPI Group slicers for dynamic filtering
-
📌 KPI Overview Cards:
-
Total KPI Count
-
MTD Target Met
-
MTD Target Missed
-
-
📈 Detailed table displaying:
-
KPI Number, Group, Name, Unit, Type (UTB or LTB)
-
MTD/YTD Actuals vs Targets
-
Green/Red arrow indicators
-
Previous Year comparisons
-
This is your command center for instant trade intelligence.
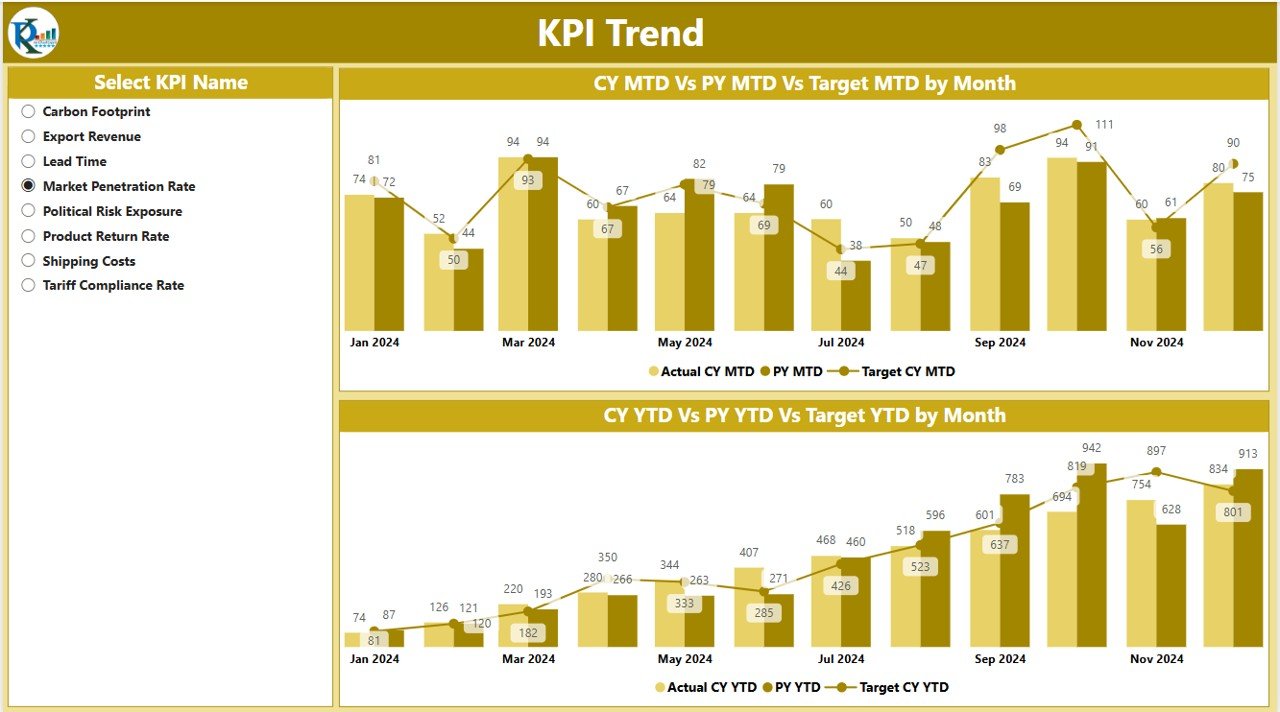
📉 KPI Trend Page – Visualize Growth Over Time
Spot trends and patterns across months:
-
Dual combo charts:
-
MTD: Actual vs Target vs Previous Year
-
YTD: Actual vs Target vs Previous Year
-
-
🎯 Filter by KPI Name for focused analysis
Perfect for identifying what’s improving—and what needs attention.
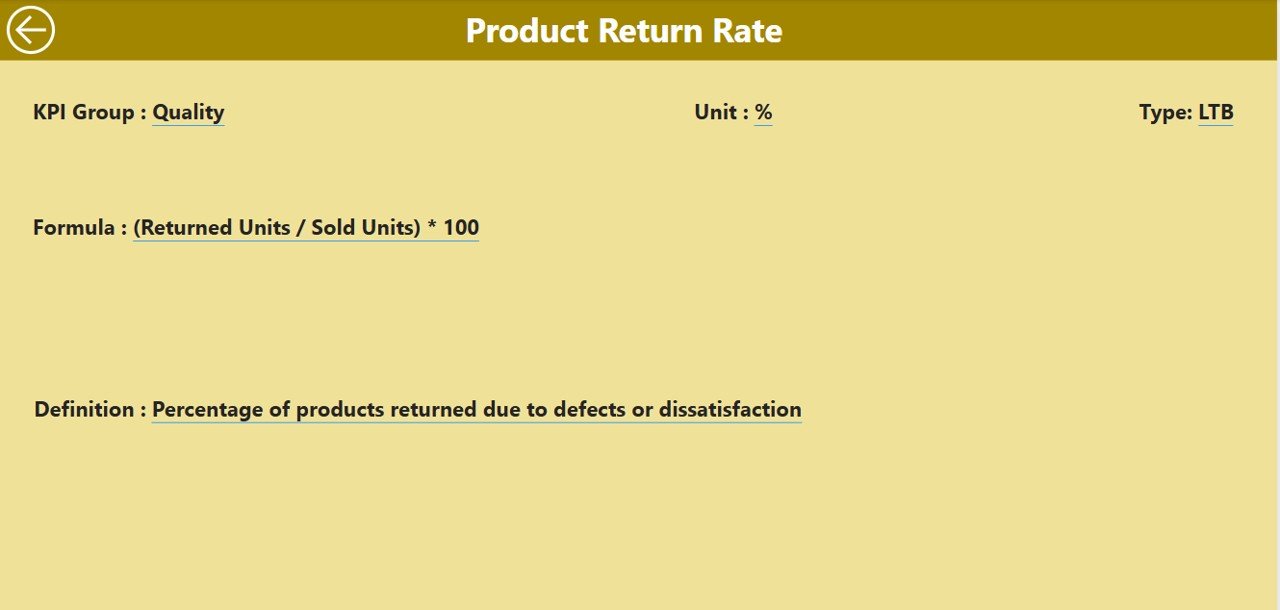
🔎 KPI Definition Page – Drill Into the Metrics
Click on any KPI for a deep dive:
-
View its formula, definition, and unit of measurement
-
Use the Back button to return seamlessly
This helps your team understand what each KPI truly means.
📂 What’s Inside the Dashboard
🔗 Excel-Driven, with 3 Structured Input Sheets:
-
Input_Actual Sheet – Enter KPI Name, Month, MTD/YTD actuals
-
Input_Target Sheet – Define MTD/YTD targets
-
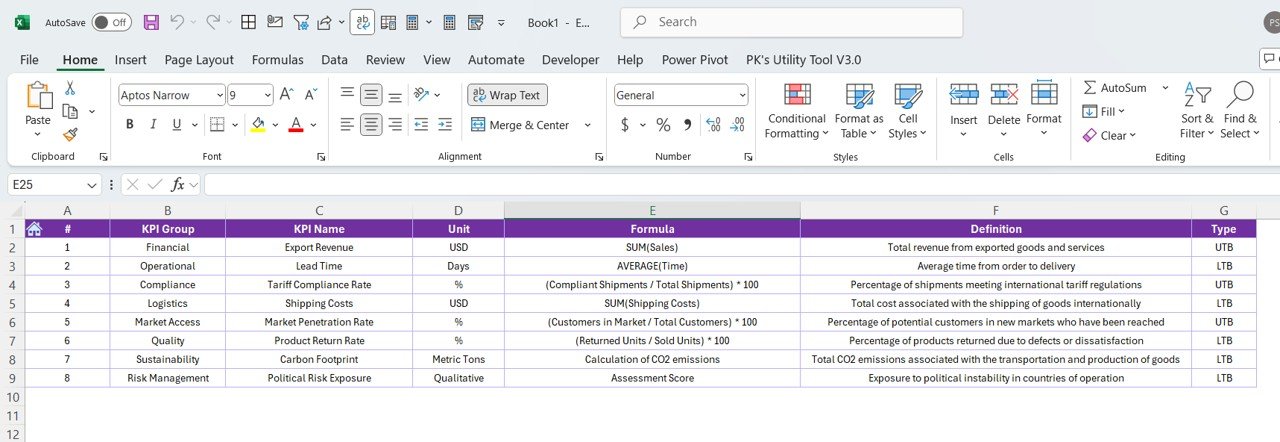
KPI Definition Sheet – Set KPI Name, Group, Unit, Formula, Type, and Definition
This structure ensures clean data ingestion, easy updates, and reliable analysis.
🛠️ How to Use the International Trade KPI Dashboard
-
🔄 Update Excel sheets monthly with latest values
-
📥 Open the Power BI file and hit Refresh
-
🧠 Use slicers to filter by month and KPI group
-
📊 Review charts and cards for real-time insights
-
🕵️ Drill into underperforming KPIs for root cause analysis
-
📤 Share or export visuals for reports and presentations
It’s as simple as Excel input + Power BI output = Instant insights!
👥 Who Can Benefit from This Dashboard?
🌐 Trade Analysts – Analyze import/export KPIs
🏗️ Supply Chain Managers – Monitor freight, customs, and logistics
📦 Import/Export Coordinators – Ensure compliance and speed
📈 Business Intelligence Teams – Build actionable insights
🧑💼 Executives – Get high-level performance summaries
💼 Consultants – Deliver smarter reports to clients
Whether you manage bulk shipments or niche exports, this tool gives you the clarity you need.
🔗 Click here to read the Detailed blog post
📺 Visit our YouTube channel to learn step-by-step video tutorials












Reviews
There are no reviews yet.