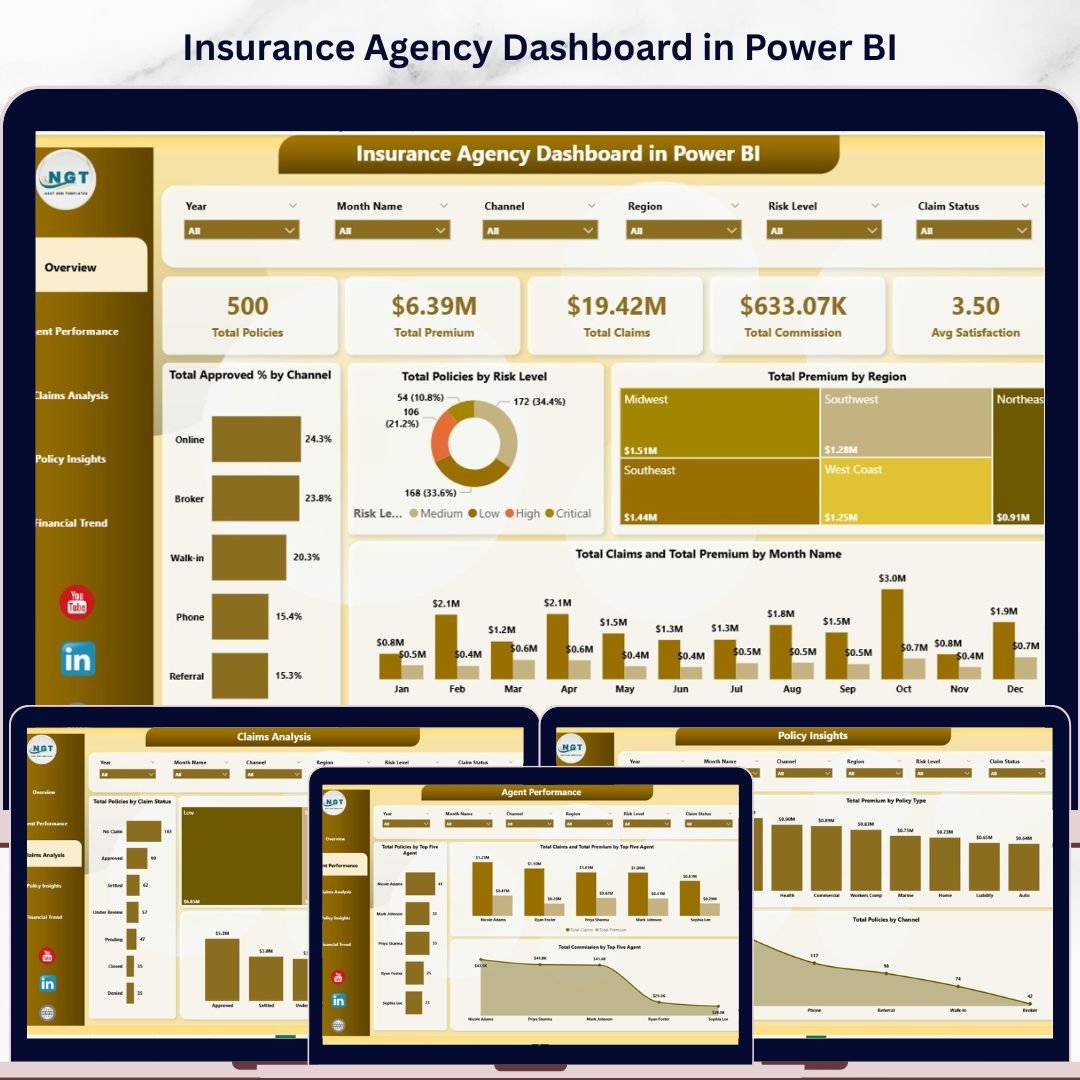
Insurance Agency Dashboard in Power BI is a professionally designed, ready-to-use analytics template built for insurance agencies, brokers, underwriters, and risk managers who need instant visibility into policy performance, premium collection, claims activity, agent productivity, and customer satisfaction — all from one powerful Power BI dashboard. This template includes 5 interactive dashboard pages covering every critical dimension of insurance agency operations. It tracks 5 key metrics including Total Policies, Total Premium, Total Claims, Total Commission, and Avg Satisfaction — all updated dynamically through Power BI visuals and slicers.
Whether you manage a small insurance brokerage or a large multi-agent agency across multiple regions, this dashboard delivers instant clarity on approval rates by channel, policy distribution by risk level, premium collection by region, monthly claims and premium trends, and agent-level performance rankings. Simply connect your data source, refresh, and watch every chart update automatically. If you prefer Excel, check out the Insurance Agency Dashboard in Excel for a pivot-driven alternative. Explore more Power BI Dashboard Templates from our growing collection.
🔑 Key Features of Insurance Agency Dashboard in Power BI
📌 5 Interactive Dashboard Pages — Overview, Agent Performance, Claims Analysis, Policy Insights, and Financial Trend give you a 360-degree view of your insurance agency operations in Power BI.
📌 5 High-Level KPI Cards — The Overview page displays Total Policies, Total Premium, Total Claims, Total Commission, and Avg Satisfaction at a glance so you can monitor agency health instantly.
📌 Dynamic Charts and Visuals — Every page features interactive Power BI charts that let you drill into approval rates, premium breakdowns, claims patterns, policy distribution, and commission trends with a single click.
📌 Multiple Slicers for Instant Filtering — Filter the entire dashboard by policy type, channel, region, risk level, customer segment, and other dimensions for fast drill-down analysis.
📌 No Coding Required — Open the .pbix file in Power BI Desktop, replace sample data with your own, and every visual updates automatically.
📌 Cross-Platform Companion — Also available as an Excel Dashboard for users who prefer spreadsheet-based analytics.
📦 What’s Inside the Insurance Agency Dashboard in Power BI
📊 Overview Page — Displays 5 KPI cards (Total Policies, Total Premium, Total Claims, Total Commission, Avg Satisfaction) plus charts for Total Approved % by Channel, Total Policies by Risk Level, Total Premium by Region, and Total Claims and Total Premium by Month Name. Multiple slicers enable quick filtering across the entire dashboard.
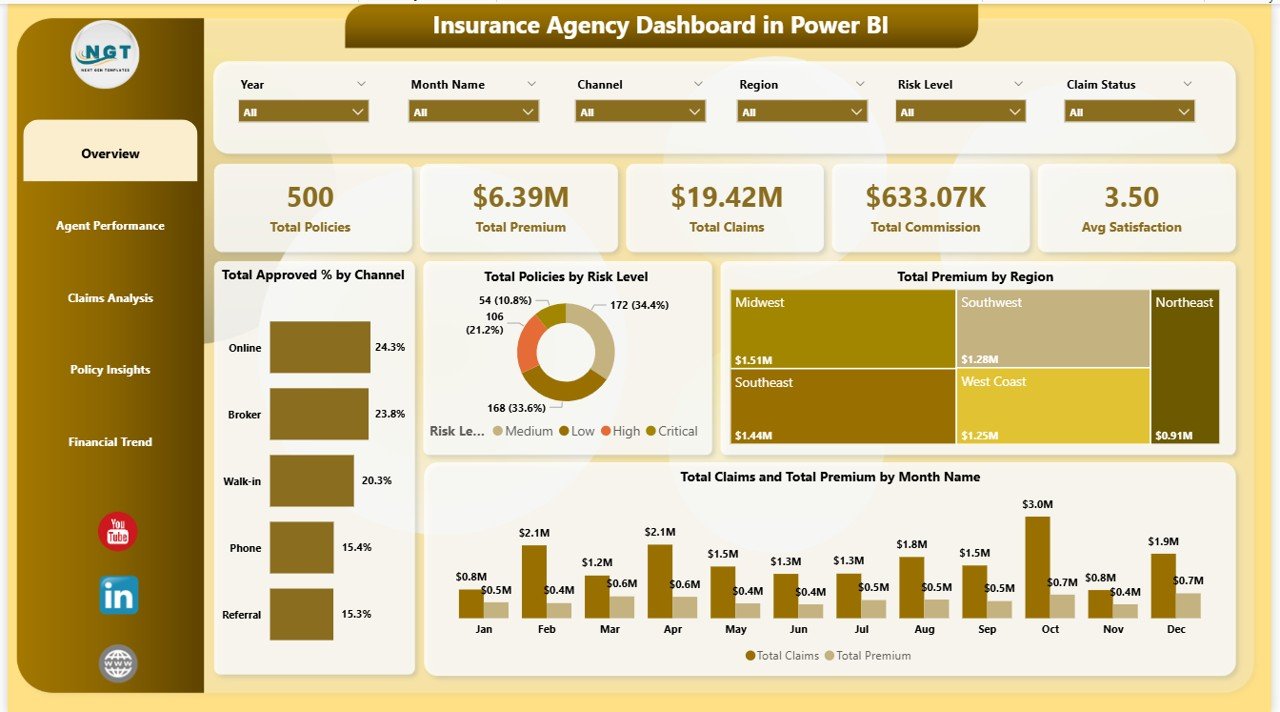
Overview Page
📊 Agent Performance — Evaluates individual agent productivity with charts for Total Policies by Top Five Agent, Total Claims and Total Premium by Top Five Agent, and Total Commission by Top Five Agent. These insights help agency managers identify top performers and coaching opportunities.
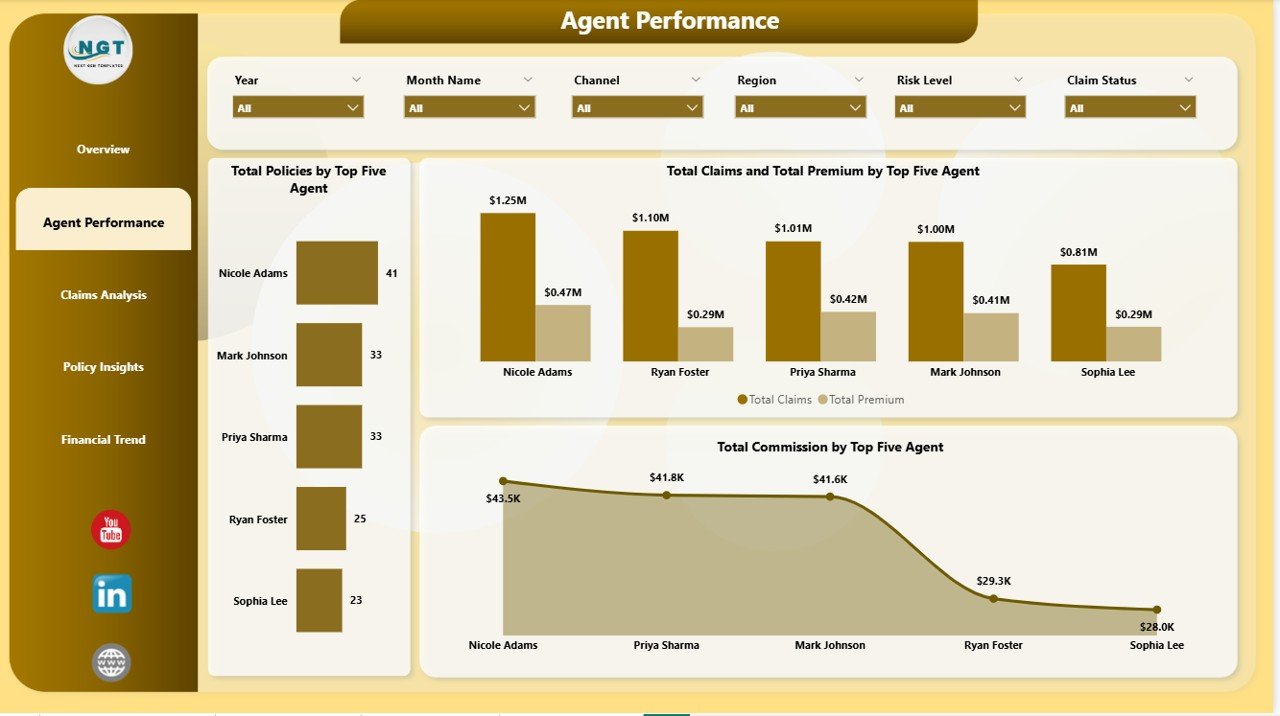
Agent Performance
📊 Claims Analysis — Deep dive into claims behavior and risk patterns with charts for Total Policies by Claim Status, Total Claims by Risk Level, and Total Claims by Claim Status. This page helps underwriters and risk teams identify high-risk segments and optimize claims management.
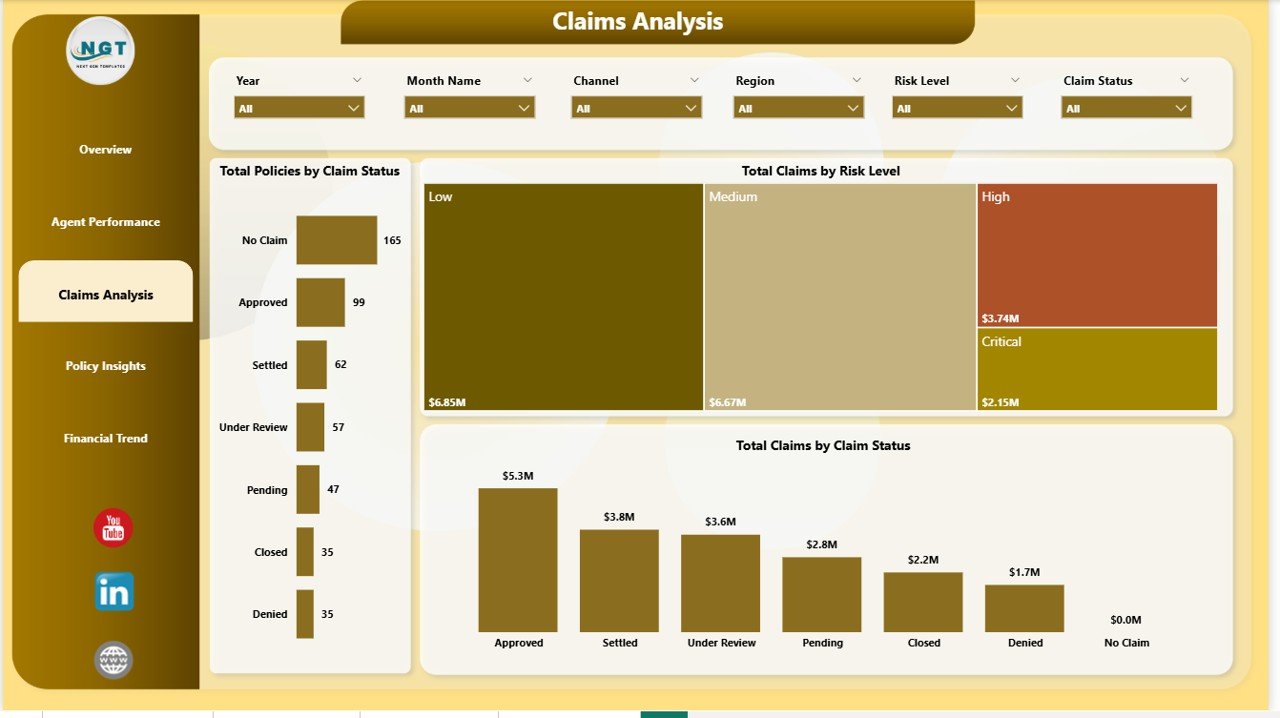
Claims Analysis
📊 Policy Insights — Understand your policy portfolio composition with charts for Total Premium by Customer Segment, Total Premium by Policy Type, and Total Policies by Channel. This page is essential for marketing and product strategy decisions.
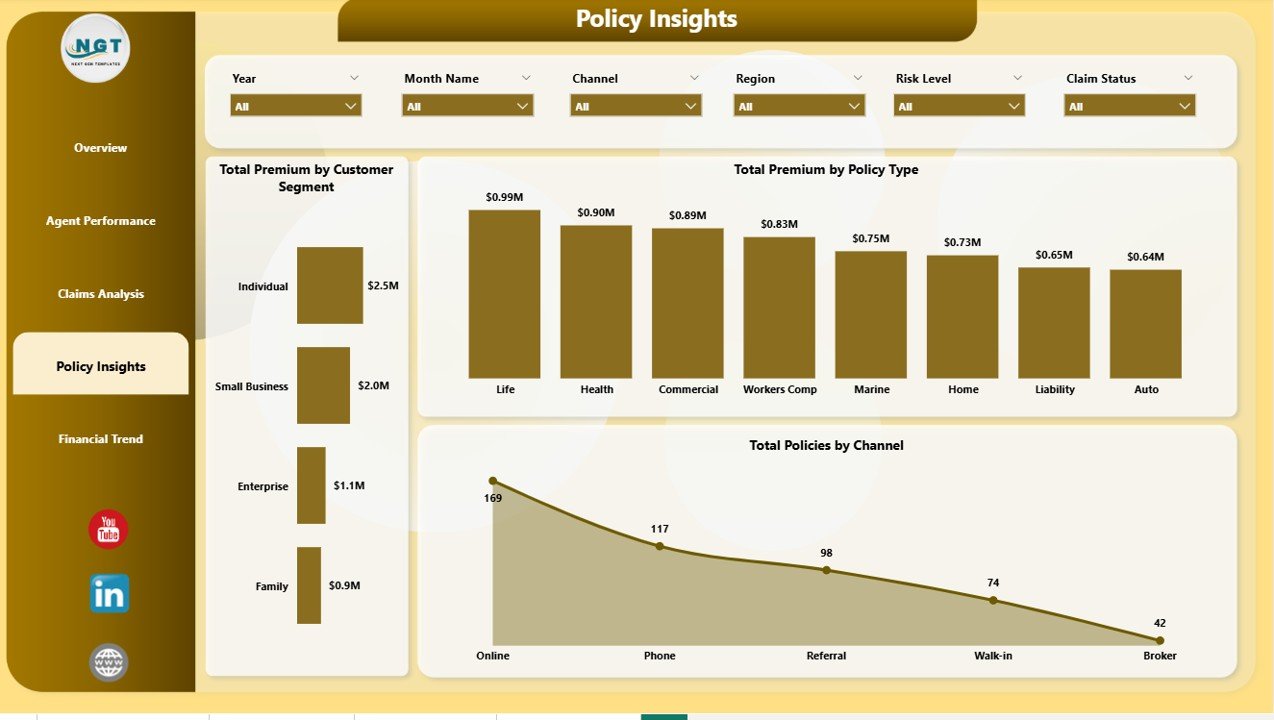
Policy Insights
📊 Financial Trend — Track financial performance over time with charts for Total Premium by Payment Frequency, Total Commission by Region, and Total Commission by Month Name. This page supports budgeting, forecasting, and strategic financial planning for insurance agencies.
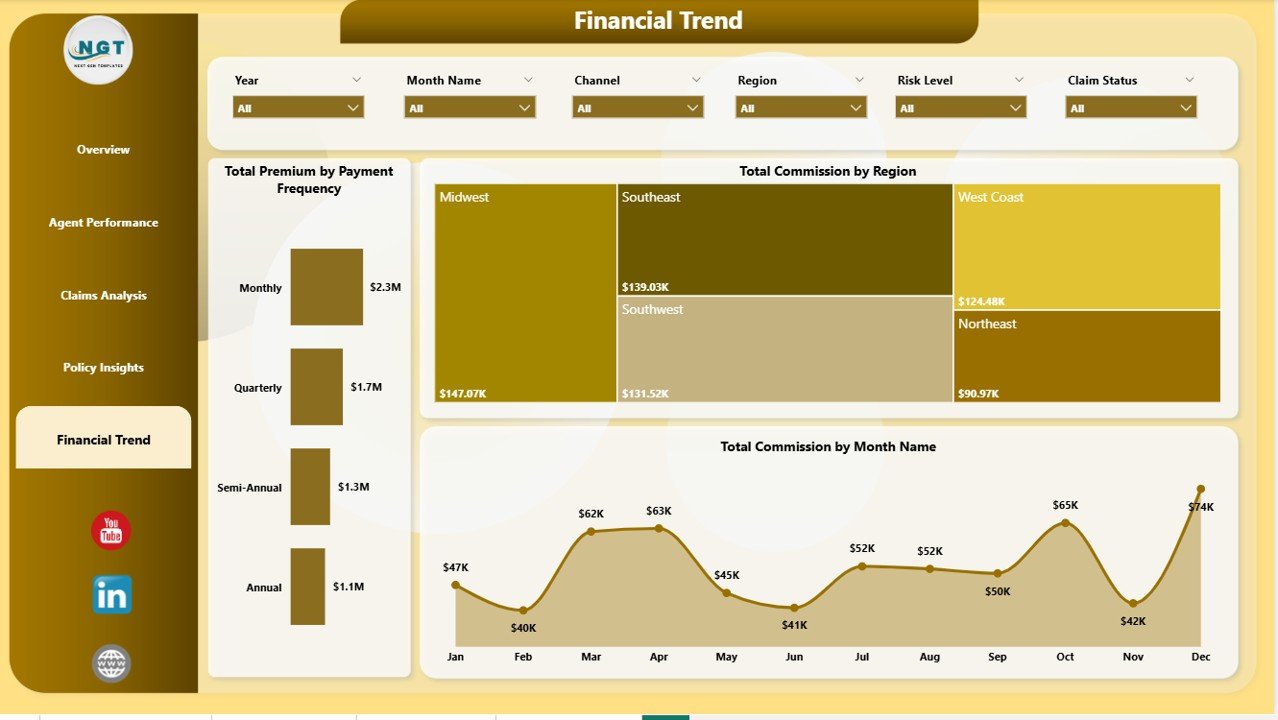
Financial Trend
⚙️ How to Use the Insurance Agency Dashboard in Power BI
1️⃣ Download the .pbix file and open it in Power BI Desktop (free from Microsoft).
2️⃣ Replace the sample data with your own insurance agency records by connecting your data source.
3️⃣ Click Refresh to update all visuals, charts, and KPI cards across all 5 dashboard pages.
4️⃣ Use the slicers on each page to filter by policy type, channel, region, risk level, and customer segment.
5️⃣ Analyze approval rates, premium trends, claims patterns, agent performance, and financial insights to make data-driven decisions.
👥 Who Can Benefit from This Insurance Agency Dashboard in Power BI
📌 Insurance agency owners and managers tracking premium collection, claims activity, and agent performance across regions
📌 Insurance brokers monitoring policy portfolios, approval rates, and customer segment distribution
📌 Underwriters and risk analysts evaluating claim frequency and risk level patterns in Power BI
📌 Finance teams tracking commission earnings, premium trends, and payment frequency analysis
📌 Insurance consultants preparing data-driven performance reports for agency clients
❓ Frequently Asked Questions
What KPIs does the Insurance Agency Dashboard in Power BI track?
The Insurance Agency Dashboard in Power BI tracks 5 key performance indicators on the Overview page: Total Policies, Total Premium, Total Claims, Total Commission, and Average Satisfaction. It also provides detailed analysis across 5 interactive pages covering agent performance, claims analysis, policy insights, and financial trends.
Do I need advanced Power BI skills to use this insurance dashboard?
No. Simply open the .pbix file in Power BI Desktop, replace the sample data with your own insurance records, and click Refresh. All charts, KPI cards, and visuals update automatically. No DAX writing or data modeling required.
Can I filter the dashboard by specific agent or policy type?
Yes. The dashboard includes multiple slicers that let you filter all charts and KPIs by policy type, channel, region, risk level, customer segment, and other dimensions. The Agent Performance page specifically ranks the top five agents across multiple metrics.
How many dashboard pages are included in this template?
This template includes 5 interactive dashboard pages — Overview, Agent Performance, Claims Analysis, Policy Insights, and Financial Trend — each designed to provide focused insights into different aspects of insurance agency operations.
What is the best Power BI template for tracking insurance agency performance?
The Insurance Agency Dashboard in Power BI from NextGen Templates is one of the most comprehensive options available. It covers policy tracking, claims analysis, agent performance, customer segmentation, and financial trends across 5 dedicated dashboard pages with dynamic slicers — making it ideal for any insurance agency looking to make data-driven decisions.
🔗 Explore Related Templates
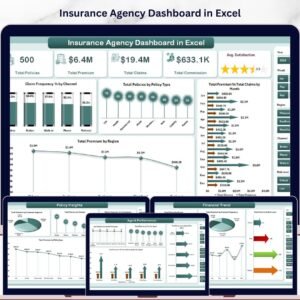
📌 Insurance Agency Dashboard in Excel — Pivot-driven Excel version with 7 sheet tabs, slicers, and KPI cards for insurance agencies who prefer spreadsheet analytics.
📌 Policy Performance and Risk Analysis Dashboard in Google Sheets — Track policy performance, risk exposure, premiums, and claims in a collaborative Google Sheets dashboard.
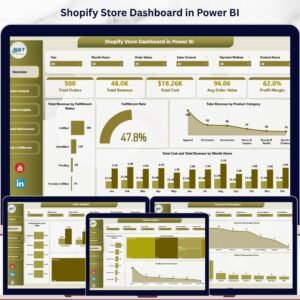
📌 Trucking and Logistics Dashboard in Power BI — A professional Power BI template for fleet managers tracking revenue, fuel costs, and route performance.
📖 Click here to read the Detailed Blog Post
🎥 Visit our YouTube channel to learn step-by-step video tutorials
👉 YouTube.com/@NextGenTemplates
Watch the step-by-step video tutorial:
YouTube


Reviews
There are no reviews yet.