
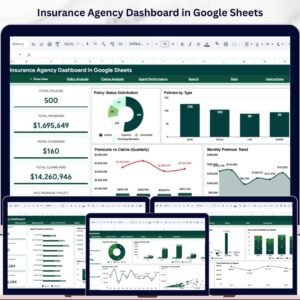
Insurance Agency Dashboard in Google Sheets is a comprehensive, ready-to-use analytics template designed for insurance agencies, brokers, underwriters, and risk managers who need to monitor policy performance, premium collection, claims activity, agent productivity, and risk levels from a single interactive Google Sheets dashboard. This powerful template includes 6 professionally designed sheet tabs with 5 high-level KPI cards, interactive charts, slicer-based filtering, a policy search page, and a structured data sheet — all running inside Google Sheets with zero software installation required.Insurance Agency Dashboard in Google Sheets
Whether you manage a small brokerage or oversee a multi-agent insurance operation, this dashboard centralizes your policy, premium, claims, and agent data into one clean, interactive interface. Simply open the Google Sheets copy link from the included PDF guide, replace the sample data, and start exploring your insurance agency metrics instantly. If you prefer Excel-based analytics, check out the Insurance Agency Dashboard in Excel, or for advanced reporting explore the Insurance Agency Dashboard in Power BI.
🔑 Key Features of Insurance Agency Dashboard in Google Sheets
📊 6 Interactive Dashboard Pages – This template includes an Overview page, Policy Analysis, Claims Analysis, Agent Performance, Search page, and Data Sheet — covering every critical dimension of insurance agency management.
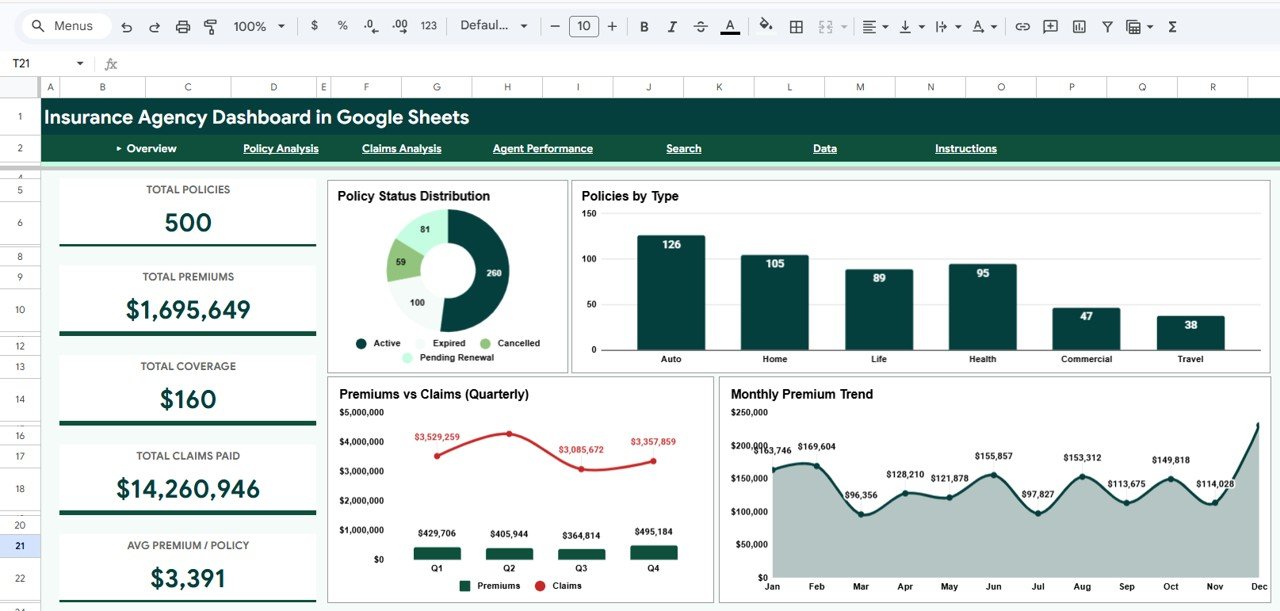
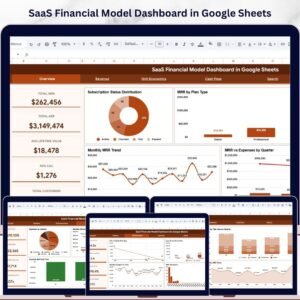
📈 5 Dynamic KPI Cards – The Overview page displays Total Policies, Total Premiums, Total Coverage, Total Claims Paid, and Avg Premium per Policy, giving you an instant operational snapshot of your entire insurance portfolio.
🔍 Interactive Slicers – Built-in slicers let you filter all charts and KPIs simultaneously by policy type, region, risk level, payment method, and other dimensions for focused analysis within seconds.
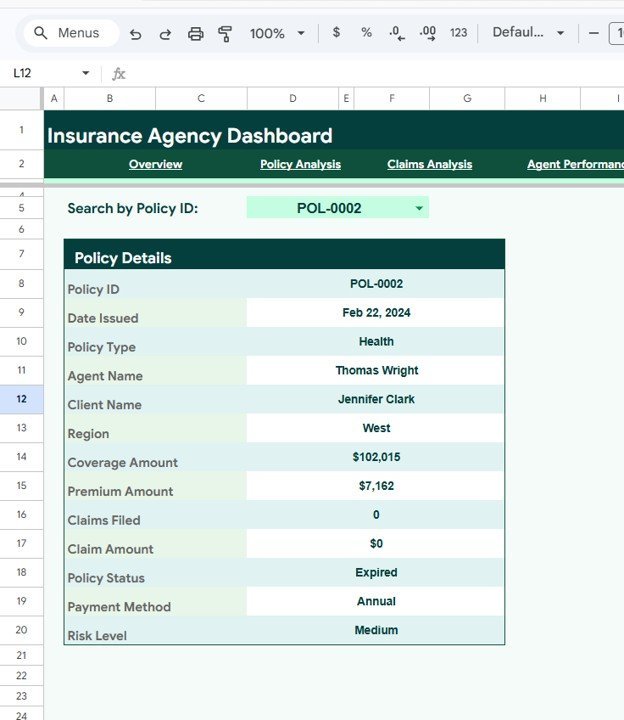
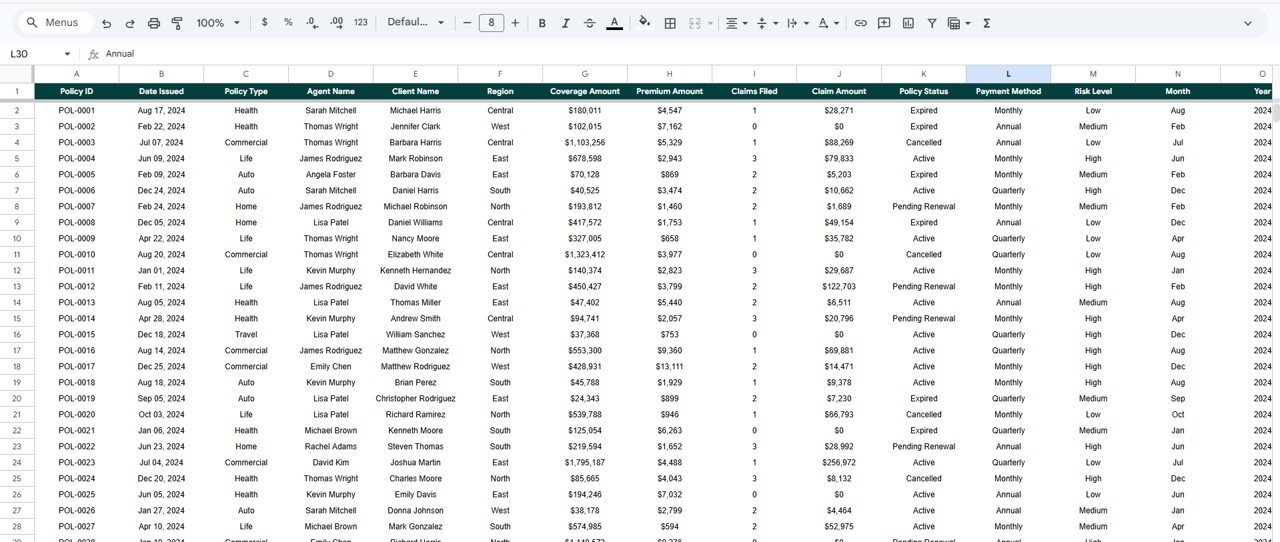
📋 Policy Search Functionality – The dedicated Search page lets you look up any Policy ID and instantly view complete details including Policy ID, Date Issued, Policy Type, Agent Name, Client Name, Region, Coverage Amount, Premium Amount, Claims Filed, Claim Amount, Policy Status, Payment Method, and Risk Level.
☁️ Cloud-Based Google Sheets Platform – No software installation needed. Open the link, paste your data, and the dashboard is live. Share with your team via Google Drive for real-time collaboration from any device.
📉 Formula-Driven Auto-Updates – All charts, KPI cards, and analysis pages recalculate automatically when you update the Data Sheet. No macros, no coding — pure Google Sheets formulas and native charts.
📦 What’s Inside the Insurance Agency Dashboard in Google Sheets
📌 Overview Page – 5 KPI cards (Total Policies, Total Premiums, Total Coverage, Total Claims Paid, Avg Premium/Policy) plus 4 analytical charts: Policy Status Distribution by Status Category, Policies by Type, Premiums vs Claims by Quarter, and Monthly Premium Trend by Month. Interactive slicers enable instant filtering across all visualizations.
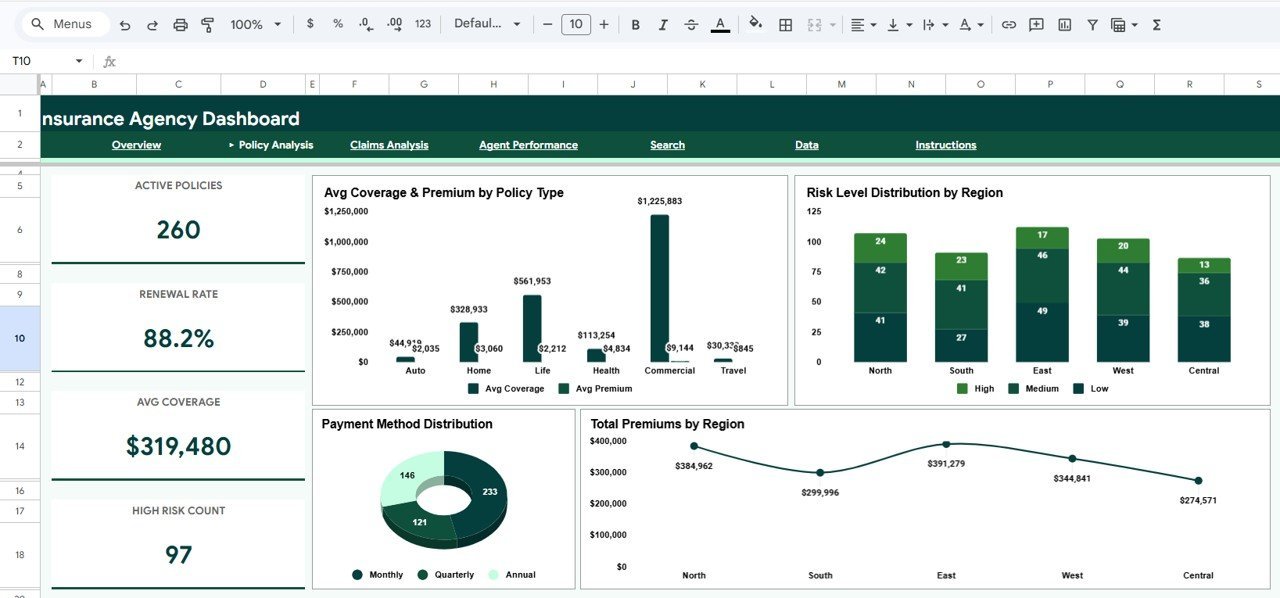
📌 Policy Analysis Page – Deep analysis with 4 charts: Avg Coverage and Premium by Policy Type, Risk Level Distribution by Region, Payment Method Distribution by Payment Method, and Total Premiums by Region. This page helps optimize your product mix and identify geographic premium patterns.
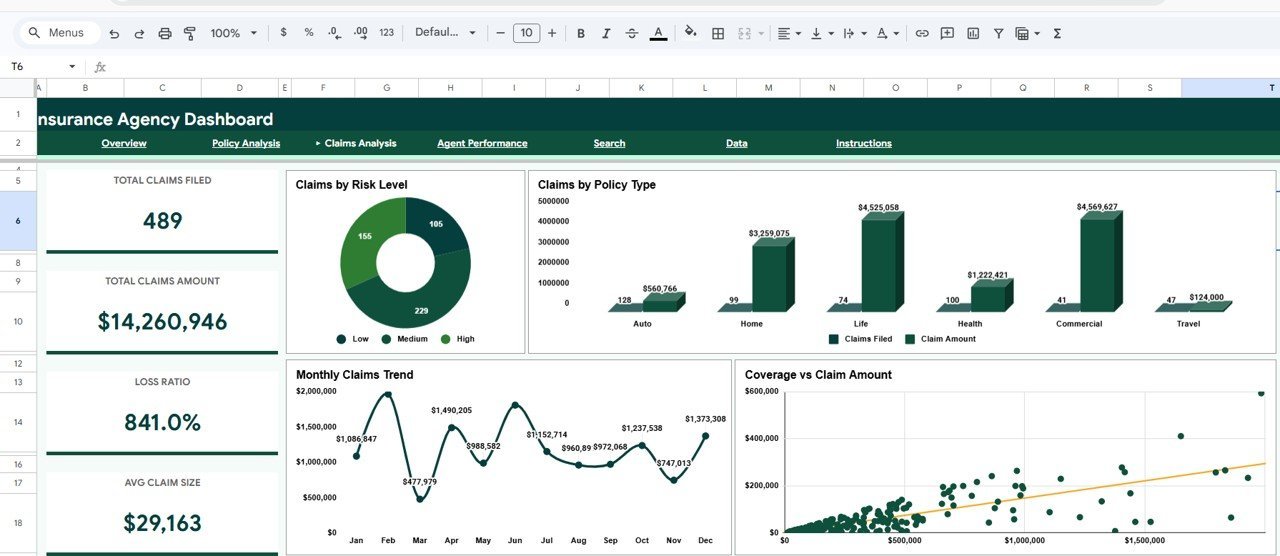
📌 Claims Analysis Page – Risk and claims intelligence with 4 charts: Claims by Risk Level, Claims by Policy Type, Monthly Claims Trend by Month, and Coverage vs Claim Amount. Identify high-risk segments and claims patterns proactively.
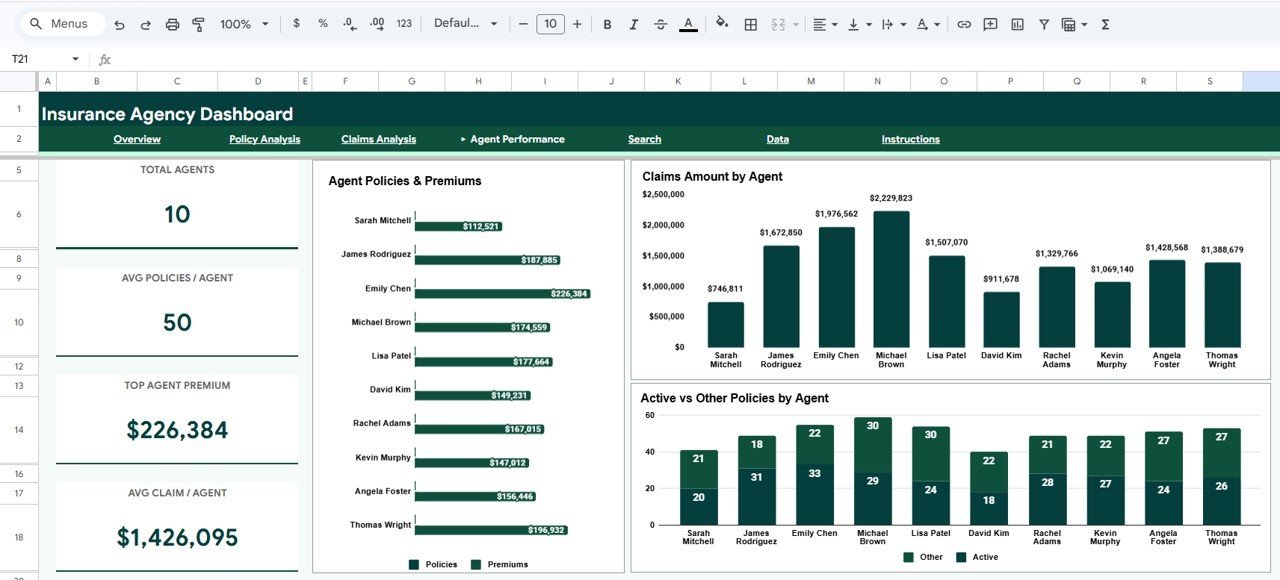
📌 Agent Performance Page – Evaluate agent productivity with 3 charts: Agent Policies and Premiums by Agent, Claims Amount by Agent, and Active vs Other Policies by Agent. Compare agents side by side for performance reviews and coaching.
📌 Search Page – Look up any Policy ID and view the full record including all 13 data fields from date issued to risk level. Essential for front-desk staff, billing teams, and managers who need quick access to individual policy information.
📌 Data Sheet – Structured data entry page with sample records. Replace with your own agency data in the same format and every dashboard page auto-updates instantly.
⚙️ How to Use the Insurance Agency Dashboard in Google Sheets
1️⃣ Purchase and download the template — open the included PDF guide which contains your Google Sheets copy link.
2️⃣ Click the copy link to create your own editable copy in Google Drive.
3️⃣ Navigate to the Data Sheet tab and replace the sample data with your actual insurance agency records (policies, premiums, claims, agents, clients).
4️⃣ Return to the Overview page — all KPI cards and charts auto-update with your data.
5️⃣ Use slicers to filter by policy type, region, risk level, or payment method for focused analysis.
6️⃣ Use the Search page to look up individual policy records by Policy ID.
7️⃣ Share the Google Sheet with your team for real-time collaborative analytics.
👥 Who Can Benefit from This Insurance Agency Dashboard in Google Sheets
🏢 Insurance Agency Owners – Monitor overall agency performance, premium trends, and claims exposure from one dashboard.
👤 Insurance Brokers & Agents – Track individual and team performance metrics including policies sold, premiums generated, and claims handled.
📊 Underwriters & Risk Managers – Analyze risk level distributions, coverage patterns, and claims trends across regions and policy types.
💼 Operations & Finance Teams – Monitor premium collection, claims payouts, and portfolio composition for financial planning and reporting.
🎓 Insurance Students & Analysts – Use the sample data as a learning tool for understanding insurance analytics and dashboard design.
❓ Frequently Asked Questions
What KPIs does the Insurance Agency Dashboard in Google Sheets track?
The Insurance Agency Dashboard in Google Sheets tracks 5 key performance indicators: Total Policies, Total Premiums, Total Coverage, Total Claims Paid, and Average Premium per Policy. It also includes 15+ analytical charts across 4 analysis pages covering policy distribution, claims patterns, agent performance, and premium trends.
Do I need coding skills to use this Google Sheets insurance dashboard?
No. This dashboard uses native Google Sheets formulas and charts. Simply replace the sample data in the Data Sheet tab with your own records and all 6 pages auto-update instantly. No macros, no Apps Script, no coding required.
Can I track individual agent performance with this dashboard?
Yes. The Agent Performance page includes 3 dedicated charts that compare agents by policies and premiums generated, claims amounts handled, and active vs other policy ratios. You can use slicers to filter by specific agents or regions.
Is this dashboard available in Excel or Power BI?
Yes. NextGenTemplates offers the Insurance Agency Dashboard in Excel with pivot tables and slicers, and the Insurance Agency Dashboard in Power BI with interactive visuals and DAX measures.
How do I replace the sample data with my own insurance data?
Navigate to the Data Sheet tab, clear the sample rows, and paste your insurance records following the same column structure — Policy ID, Date Issued, Policy Type, Agent Name, Client Name, Region, Coverage Amount, Premium Amount, Claims Filed, Claim Amount, Policy Status, Payment Method, and Risk Level. All charts and KPIs refresh automatically.
Can multiple team members access this dashboard simultaneously?
Yes. Since this is a Google Sheets dashboard, you can share it via Google Drive with view or edit access. Multiple team members can collaborate in real time from any device with internet access.
🔗 Explore Related Templates
📊 Insurance Agency Dashboard in Excel – Pivot-driven Excel version with slicers, KPI cards, and automated formulas for insurance analytics.
📈 Insurance Agency Dashboard in Power BI – Interactive Power BI version with 5 pages and dynamic slicers for advanced insurance reporting.
🌐 Insurance Agency Dashboard in HTML – Browser-based insurance analytics with zero software installation.
📖 Click here to read the Detailed Blog Post
Watch the step-by-step video tutorial:


Reviews
There are no reviews yet.