Influencer Marketing Dashboard has completely transformed digital advertising. Brands no longer rely only on traditional ads. Instead, they collaborate with creators across platforms like Instagram, YouTube, and TikTok to drive engagement and sales. However, many businesses still struggle to measure campaign performance properly. As a result, they overspend, miss key trends, and fail to identify high-performing influencers.
That is exactly where the Influencer Marketing Dashboard in Excel becomes a powerful solution 📊✨.
This ready-to-use Excel dashboard converts raw influencer campaign data into clear, structured, and actionable insights. It helps you track campaign budgets, engagement rates, revenue, cost per conversion, ROI, and more—all in one centralized system. Instead of jumping between multiple sheets, you gain instant visibility and control.
🔑 Key Features of Influencer Marketing Dashboard in Excel
📊 Centralized Campaign Tracking
Monitor all influencer campaigns in one structured Excel dashboard.
📈 Engagement & Revenue Monitoring
Track engagement rate %, revenue performance, and platform-wise results.
💰 Cost Efficiency Analysis
Measure cost per conversion (CPC), cost per click, and ROI easily.
🎯 Multi-Dimensional Insights
Analyze performance by campaign, category, region, platform, and month.
🧭 Interactive Page Navigator
Quickly switch between analytical pages for smooth reporting.
🧩 Excel-Based & Customizable
No complex software required. Easily modify formulas and visuals.
📦 What’s Inside the Influencer Marketing Dashboard in Excel
This dashboard includes 5 powerful analytical pages along with backend data and support sheets.
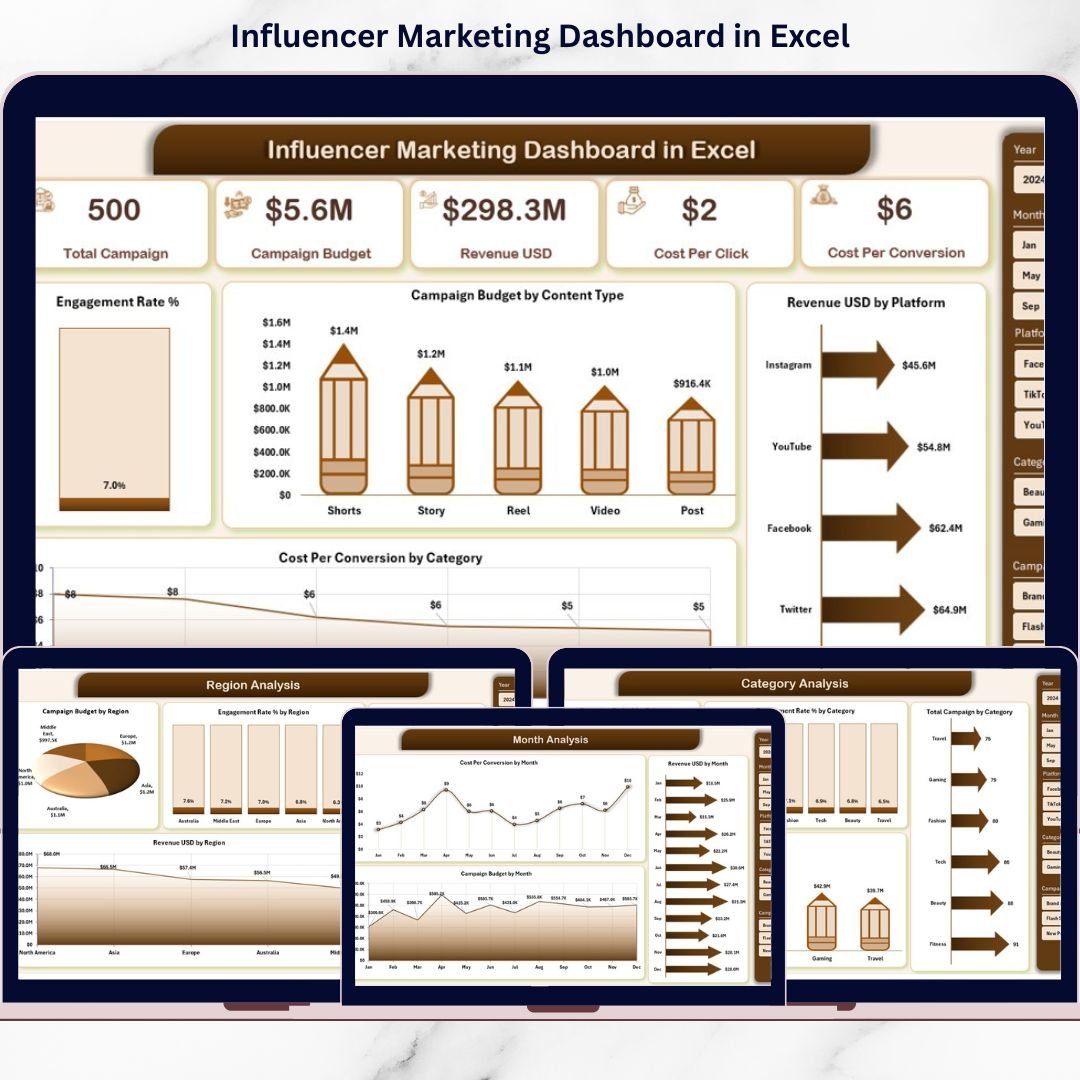
📌 Overview Page – Executive Summary

The main dashboard view with:
-
4 KPI cards (Total Budget, Revenue, Engagement Rate %, Cost Per Conversion)
-
Engagement Rating % chart
-
Campaign Budget by Content Type
-
Revenue by Platform
-
Cost Per Conversion by Category
-
Right-side slicer for filtering
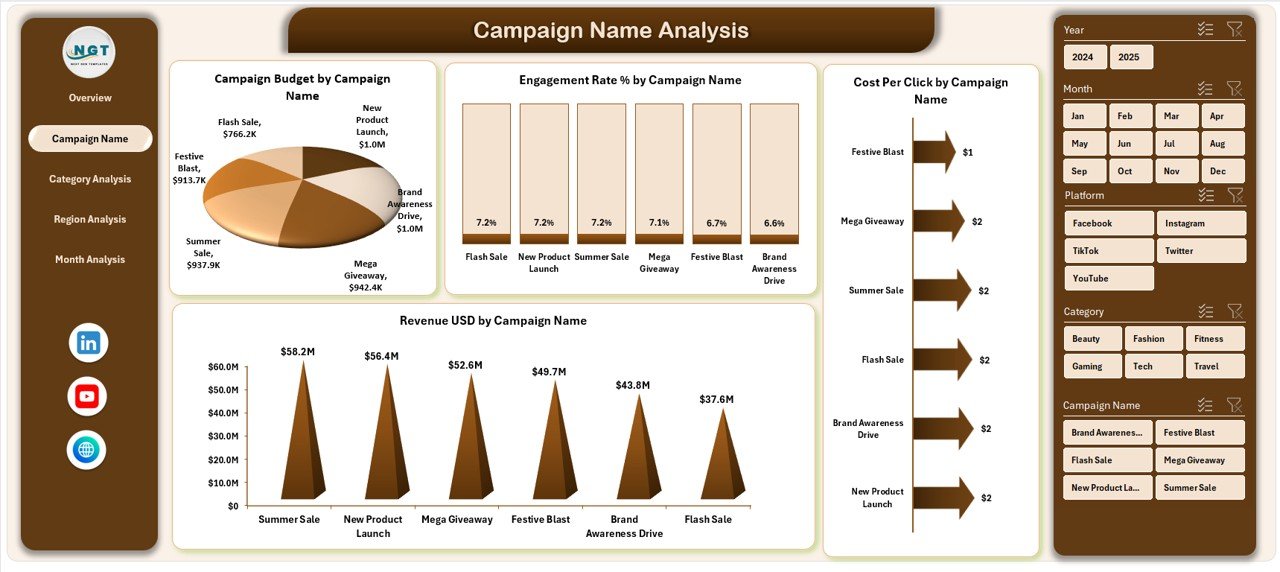
📢 Campaign Name Analysis Page
Compare performance by campaign:
-
Engagement % by Campaign
-
Budget by Campaign
-
Revenue by Campaign
-
Cost Per Conversion by Campaign
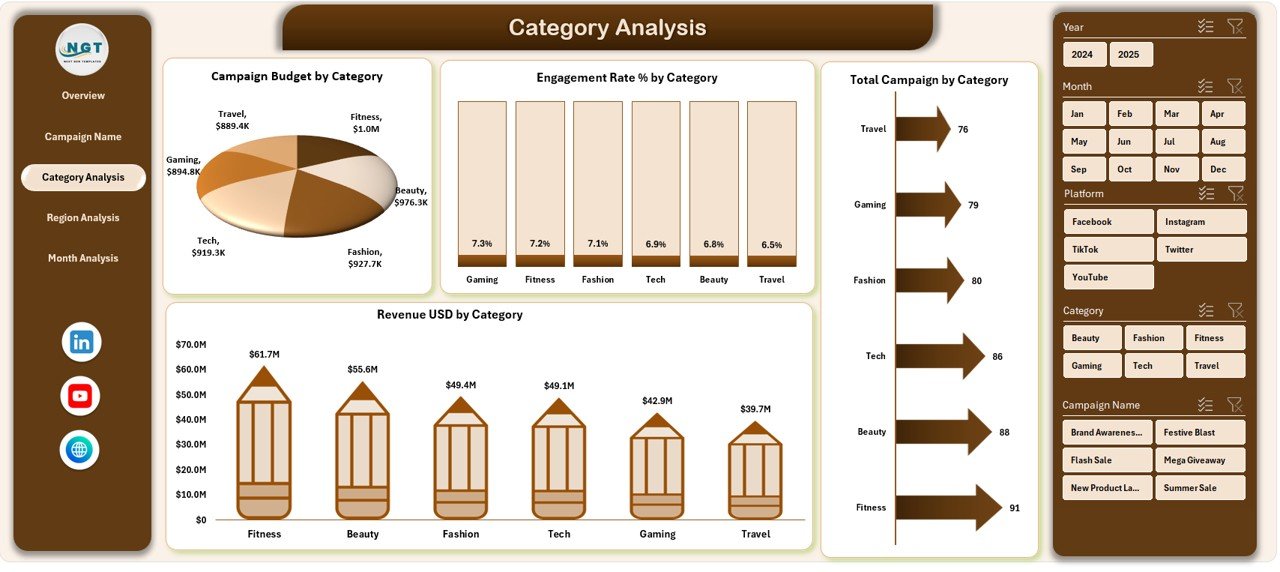
🎯 Category Analysis Page
Evaluate performance by content category (Fashion, Tech, Fitness, etc.):
-
Engagement % by Category
-
Budget by Category
-
Revenue by Category
-
Total Campaigns by Category
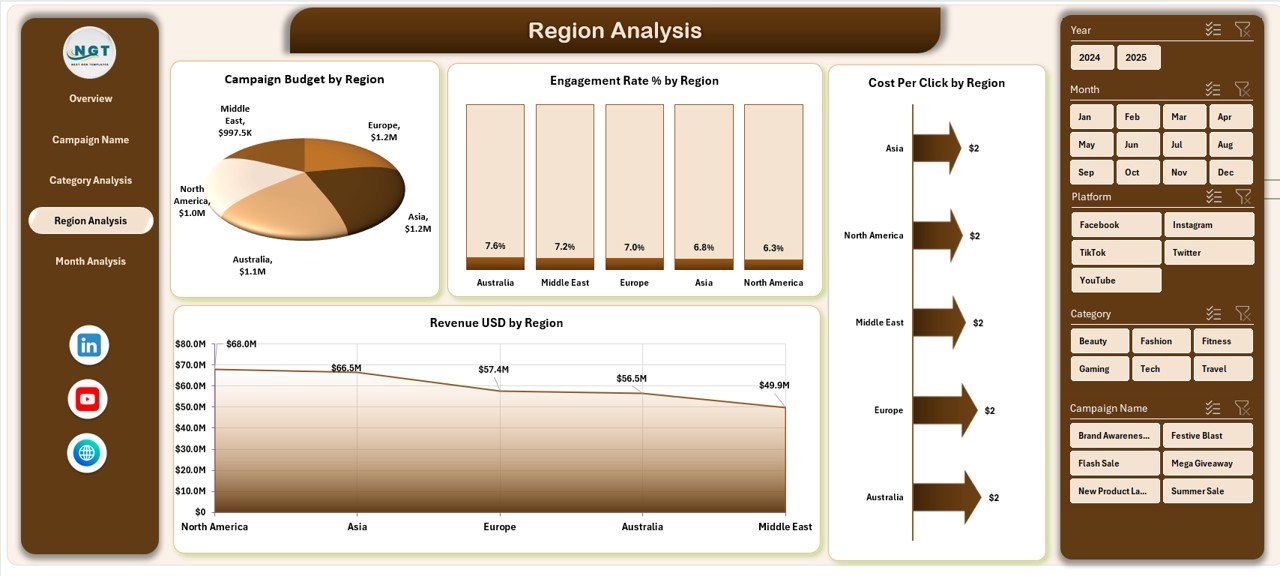
🌍 Region Analysis Page
Analyze geographic performance:
-
Engagement % by Region
-
Budget by Region
-
Revenue by Region
-
Cost Per Click by Region
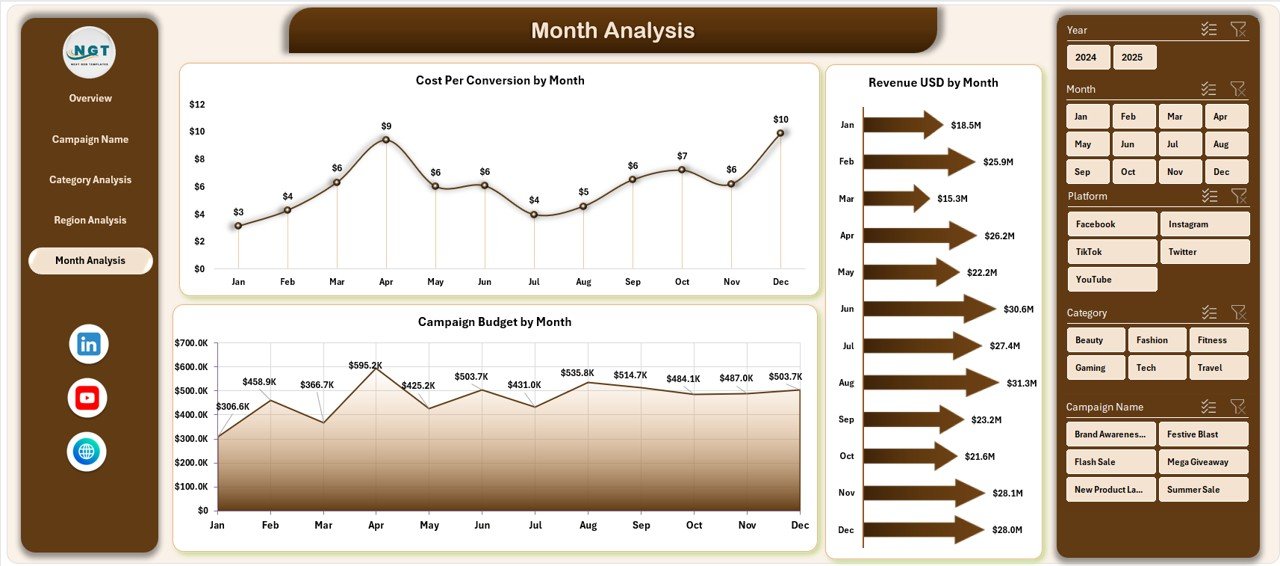
📅 Month Analysis Page
Track performance trends over time:
-
Budget by Month
-
Revenue by Month
-
Cost Per Conversion by Month
📄 Data Sheet & Support Sheet
Enter campaign-level data such as:
Campaign Name, Influencer Name, Platform, Category, Region, Budget, Impressions, Clicks, Engagement, Conversions, Revenue.
Pivot tables and charts update automatically once data is refreshed.
🛠️ How to Use the Influencer Marketing Dashboard in Excel
Getting started is simple:
1️⃣ Enter campaign data in the Data Sheet
2️⃣ Refresh pivot tables
3️⃣ Use slicers to filter by campaign, region, or category
4️⃣ Review KPI cards and charts
5️⃣ Identify high-performing campaigns
6️⃣ Optimize budget allocation
7️⃣ Improve ROI through data-driven decisions
Within minutes, your influencer data becomes marketing intelligence.
👥 Who Can Benefit from This Influencer Marketing Dashboard in Excel
📈 Digital Marketing Agencies
🛍️ E-commerce Brands
📊 Brand Managers
📱 Social Media Teams
🚀 Startups & Growth Marketers
If you manage influencer campaigns, this dashboard helps you stay organized and performance-focused.