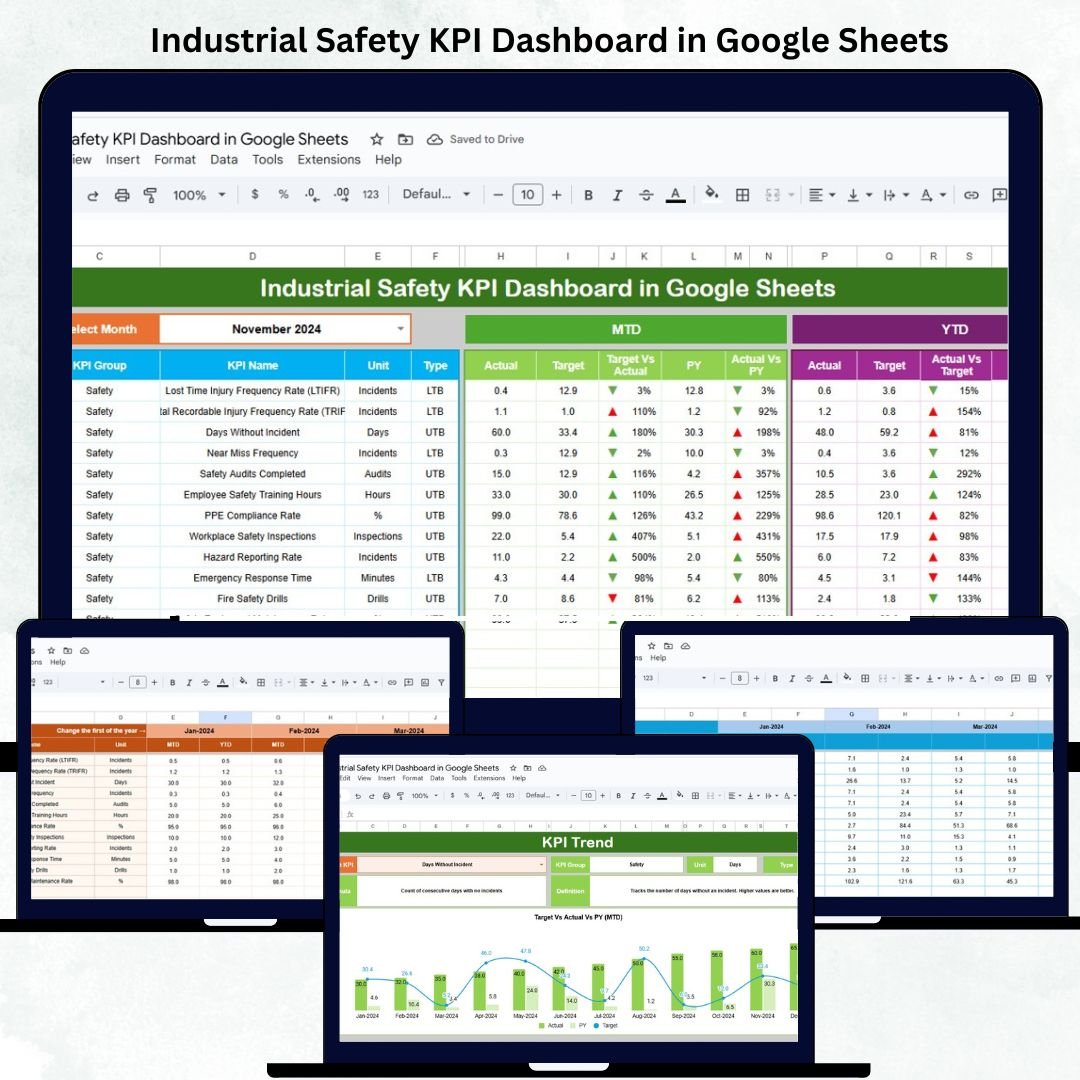
In today’s fast-paced industrial world, safety is more than a compliance requirement — it’s a key measure of organizational excellence. The Industrial Safety KPI Dashboard in Google Sheets is a ready-to-use, automated tool that enables safety professionals and operations leaders to monitor, analyze, and improve workplace safety metrics in real time. 🦺📊
This powerful dashboard transforms raw safety data into clear visuals, actionable KPIs, and insightful trends, empowering EHS (Environment, Health & Safety) teams to make smarter, data-driven decisions — all within Google Sheets. No coding, no complex software — just practical analytics that drive results. ⚙️✅
🔑 Key Features of the Industrial Safety KPI Dashboard in Google Sheets
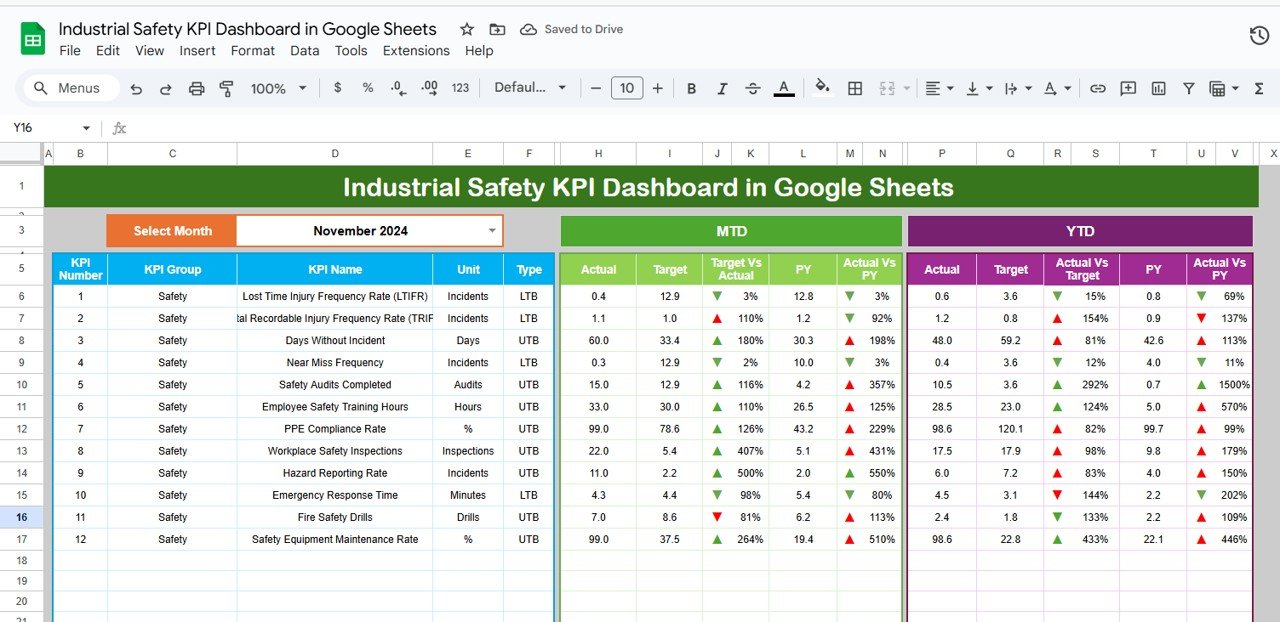
📋 Dashboard Sheet Tab (Main Interface)
-
Interactive and visually rich dashboard for monitoring safety performance.
-
Includes month selector (Range D3) for quick MTD (Month-to-Date) and YTD (Year-to-Date) analysis.
-
Automated conditional formatting:
-
🟢 Upward Arrow (↑) – Indicates improved performance.
-
🔴 Downward Arrow (↓) – Highlights areas of decline.
-
-
KPI Cards include:
-
Total Incidents
-
Lost Time Injuries (LTI)
-
Total Recordable Incident Rate (TRIR)
-
Near Misses
-
Safety Training Completion %
-
Equipment Inspection Compliance %
-
Average Days Since Last Incident
-
Corrective Actions Closed %
-
PPE Compliance %
-
Lost Work Days
-
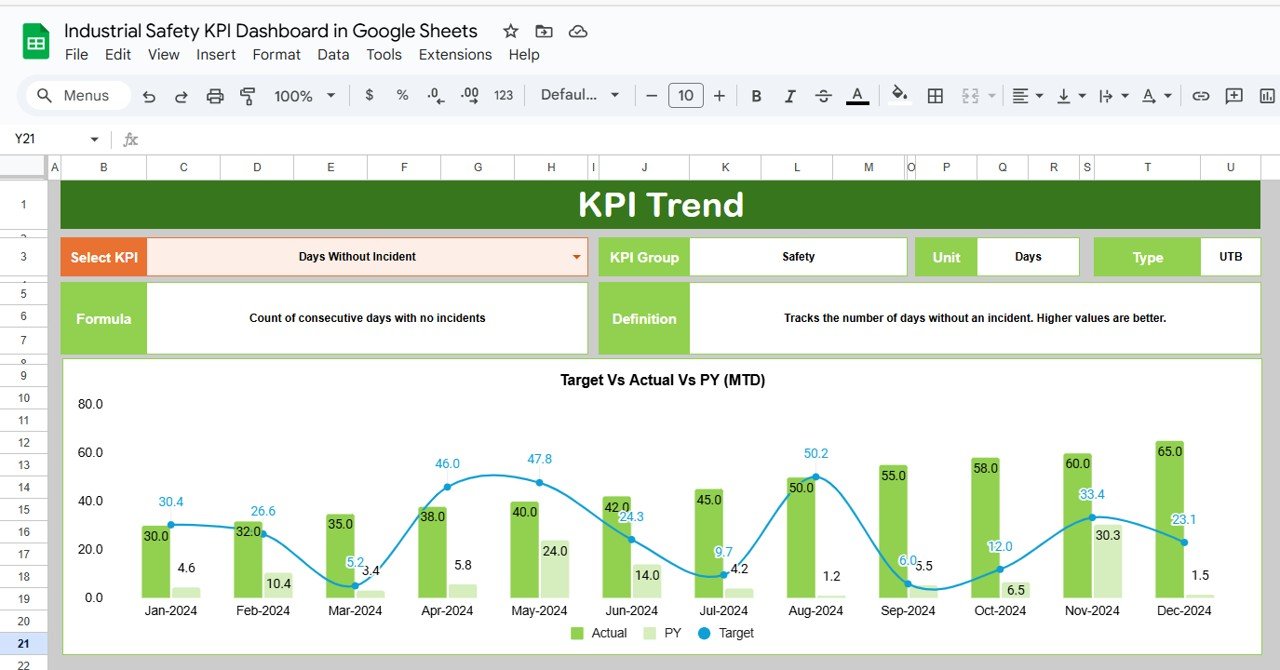
📈 KPI Trend Sheet Tab
-
Select a KPI (Cell C3) to view detailed monthly trends.
-
Displays KPI Group, Unit, Type (UTB/LTB), Formula, and Definition.
-
Enables pattern identification for proactive risk management.
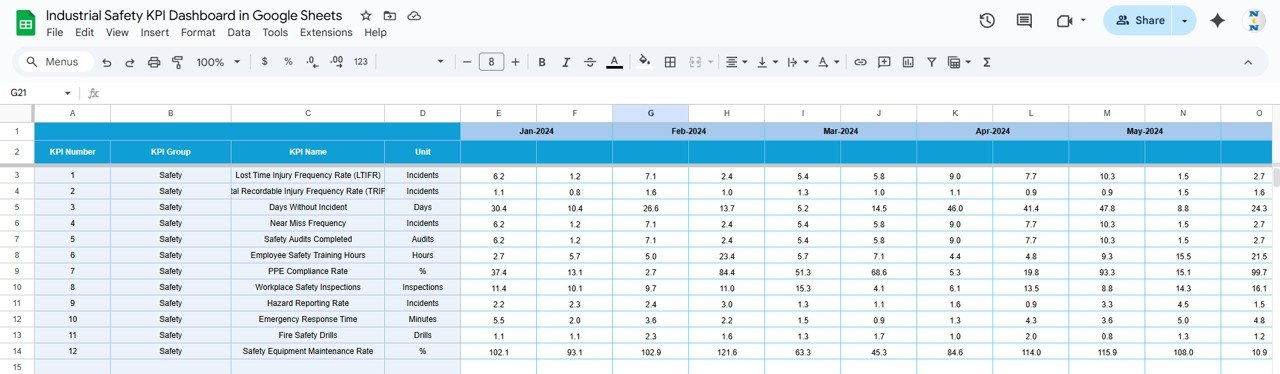
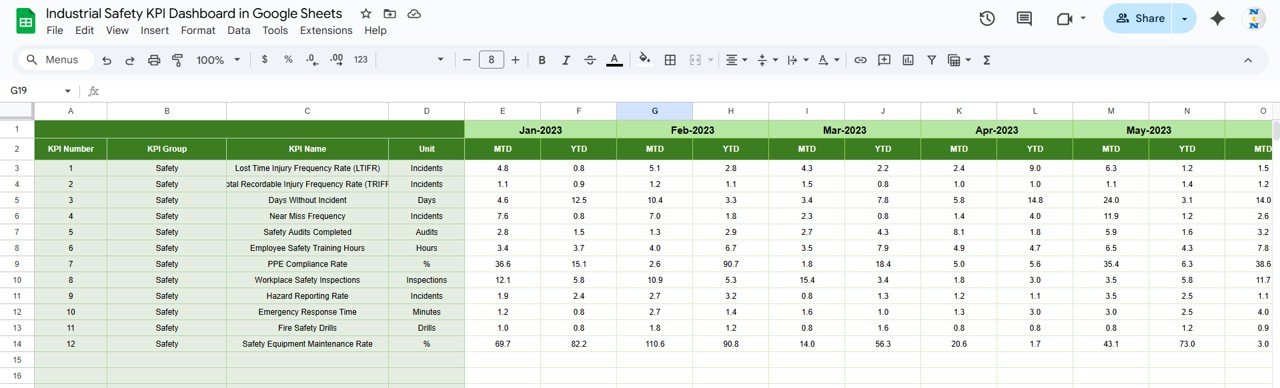
🧾 Actual Number Sheet Tab
-
Input monthly safety performance data.
-
Updates automatically across all dashboard visuals.
-
Easy to maintain and scale for different locations or plants.
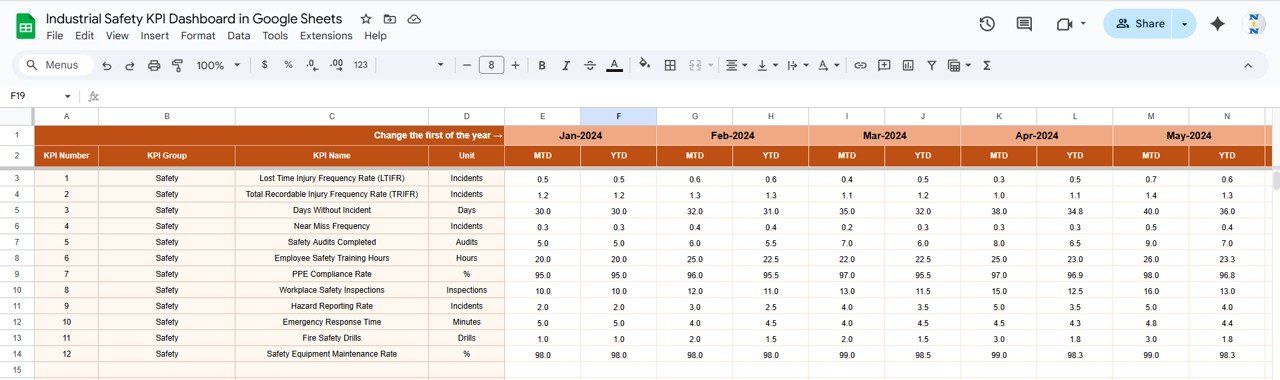
🎯 Target Sheet Tab
-
Set safety targets for MTD and YTD metrics.
-
Compare performance versus goals instantly.
📊 Previous Year Number Sheet Tab
-
Store and compare previous year’s safety KPIs.
-
View Year-over-Year (YoY) performance improvements.
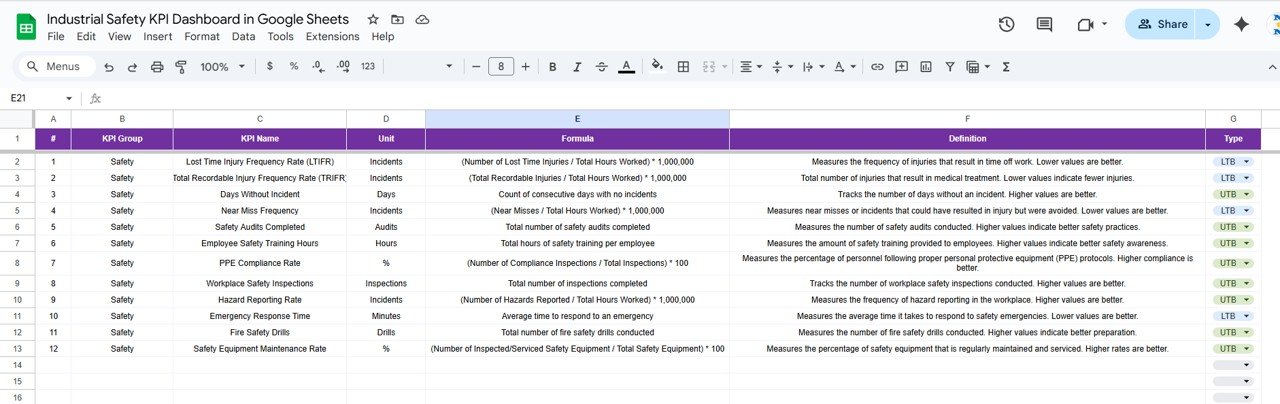
📖 KPI Definition Sheet Tab
-
Master table of all KPIs with formulas, definitions, and measurement types (UTB or LTB).
-
Ensures clarity and consistency in reporting.
📦 What’s Inside the Industrial Safety KPI Dashboard
✅ Pre-built Google Sheets file with six analytical tabs
✅ Automated KPI calculations with MTD and YTD comparisons
✅ Conditional color-coded visuals for better clarity
✅ Editable targets and thresholds
✅ Year-over-year tracking of key safety indicators
✅ No add-ons or macros required
✅ Collaborative design – accessible to multiple users simultaneously
Everything is structured to make safety tracking and reporting efficient, transparent, and effective. 🚀
🧑💼 Who Can Benefit from This Dashboard
🦺 EHS Professionals – Monitor incident rates, training, and compliance in real time.
🏭 Operations Managers – Identify unsafe patterns and reduce downtime.
📈 Safety Auditors – Track KPI history for performance benchmarking.
👷♂️ Supervisors – Maintain visibility into team safety practices.
💼 Executives & Directors – Gain confidence with accurate, visual safety metrics.
This tool is suitable for manufacturing units, logistics hubs, utilities, oil & gas, construction sites, and all industrial environments where safety is critical.
🧪 How to Use the Industrial Safety KPI Dashboard
1️⃣ Enter Monthly Data: Input KPI values in the Actual Number Sheet.
2️⃣ Set Targets: Define monthly and YTD targets in the Target Sheet.
3️⃣ Review Dashboard: Monitor automated visuals and KPI cards for instant insights.
4️⃣ Analyze Trends: Use the KPI Trend Tab to assess safety progress over time.
5️⃣ Benchmark Performance: Compare results with the previous year’s data.
💡 Pro Tip: Integrate with Google Forms for automatic incident logging and Google Apps Script for SLA or threshold alerts.
🌟 Why Choose This Dashboard
-
Centralized and visual safety performance tracking
-
Real-time updates and automated KPI comparisons
-
Helps achieve compliance and reduce risk exposure
-
Easy customization for additional KPIs or locations
-
Supports collaborative monitoring through Google Sheets
-
Promotes a culture of proactive safety management
With the Industrial Safety KPI Dashboard in Google Sheets, safety data becomes a catalyst for continuous improvement and operational excellence. 🌟


Reviews
There are no reviews yet.