Humanitarian work is built on urgency, accountability, and measurable impact. From food distribution and medical aid to shelter programs and emergency response, every initiative must be tracked with precision. Humanitarian Aid KPI Dashboard in Power BI But when performance data is scattered across spreadsheets, leaders struggle to see what truly matters.
Missed targets. Delayed insights. Weak donor confidence.
What if you could transform raw Excel data into a powerful, interactive humanitarian performance system?
That’s exactly what the Humanitarian Aid KPI Dashboard in Power BI delivers. 🚀
Humanitarian Aid KPI Dashboard in Power BI This ready-to-use Power BI solution converts structured Excel data into dynamic visuals, helping NGOs and aid organizations monitor Month-to-Date (MTD) and Year-to-Date (YTD) performance, compare Actual vs Target, and benchmark against Previous Year results — all inside a professional reporting environment.
No complex systems. No expensive enterprise software. Just smart, interactive performance tracking.
🚀 Key Feature of Humanitarian Aid KPI Dashboard in Power BI
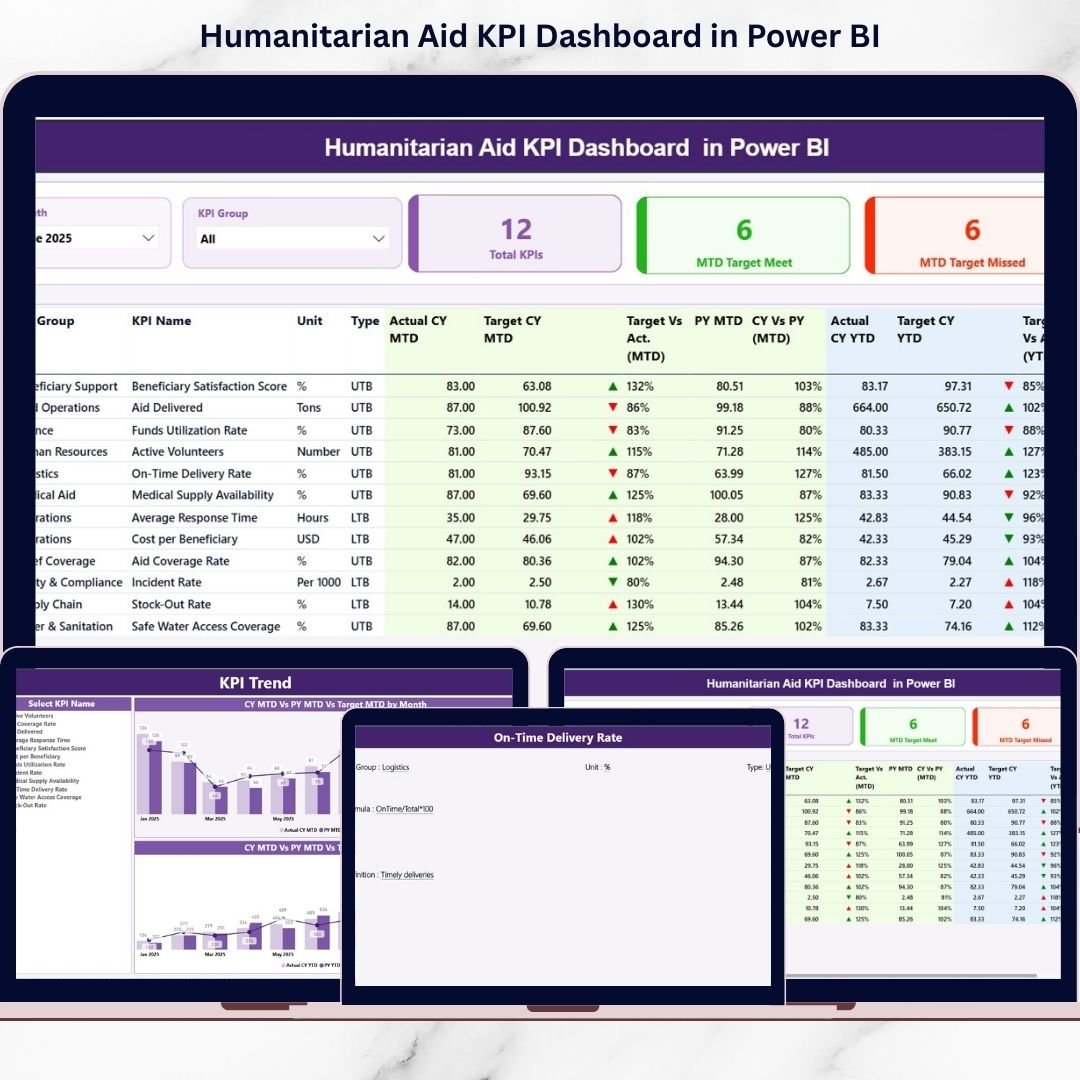
This dashboard includes 3 powerful, interactive pages designed for complete KPI visibility.
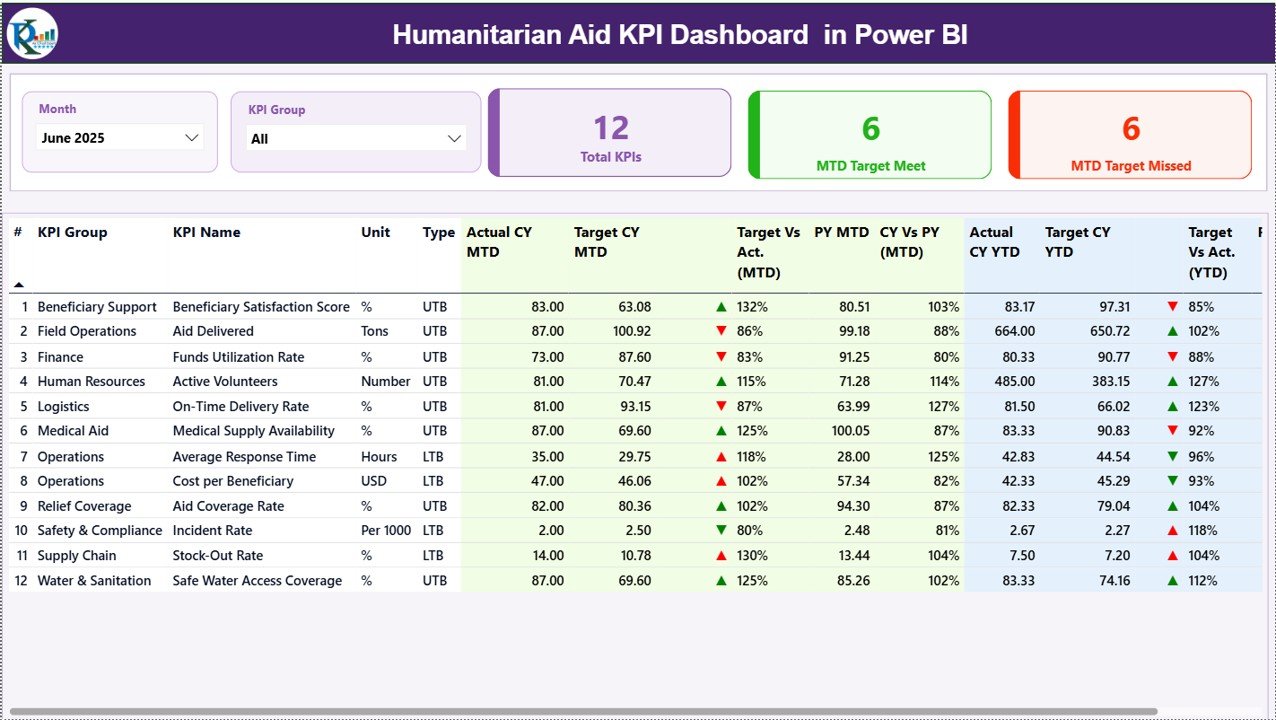
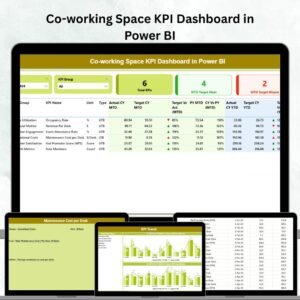
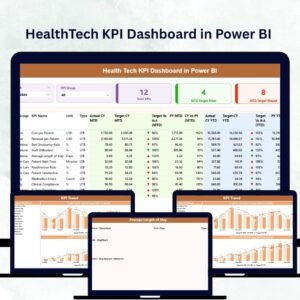
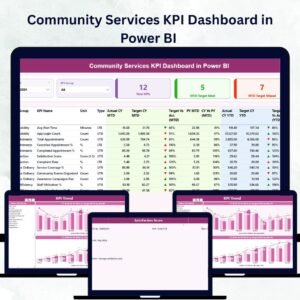
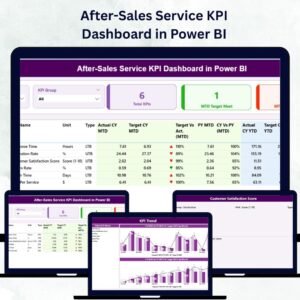
📊 Summary Page – Complete KPI Overview
Two slicers at the top allow you to filter by:
✔ Month
✔ KPI Group
The page displays:
✔ Total KPIs Count
✔ MTD Target Meet Count
✔ MTD Target Missed Count
Below, a detailed KPI table shows MTD & YTD performance, Target comparisons, Previous Year benchmarks, and performance indicators.
🟢 Visual Performance Icons
▲ Green arrow when KPI meets/exceeds target
▼ Red arrow when KPI underperforms
This enables instant performance clarity for leadership.
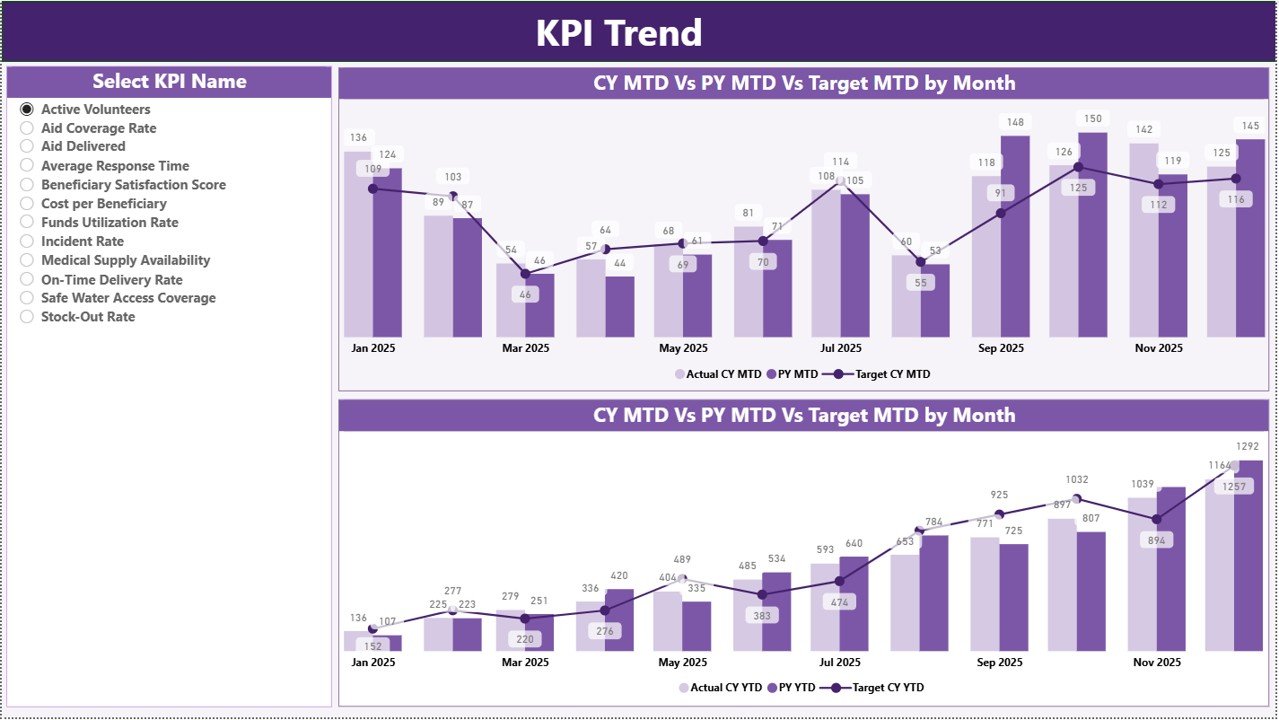
📈 KPI Trend Page – Performance Over Time
Select a KPI using the slicer and analyze:
✔ MTD Combo Chart (Actual vs Target vs PY)
✔ YTD Combo Chart (Actual vs Target vs PY)
Trend charts help detect patterns, growth, or warning signals early.
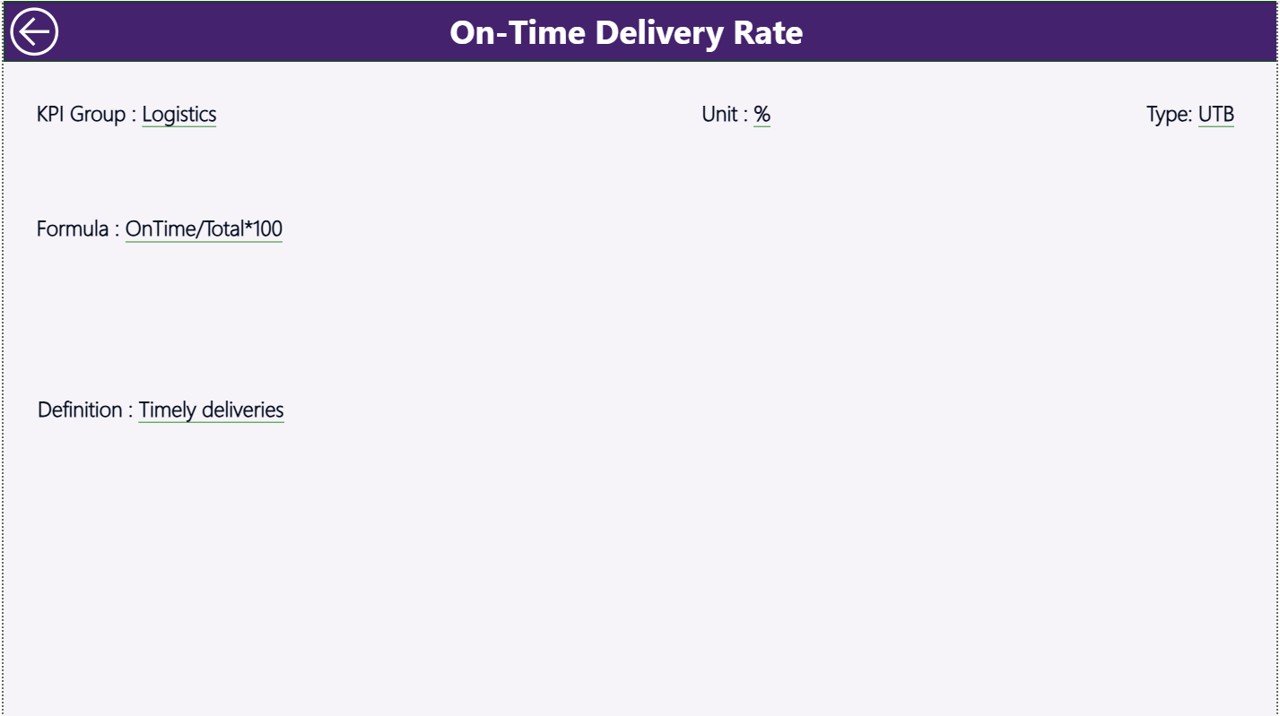
📘 KPI Definition Page – Drill-Through Transparency
Drill from the Summary page to view:
✔ KPI Formula
✔ KPI Definition
✔ Unit of Measurement
✔ KPI Type (LTB or UTB)
This strengthens governance and transparency.
📦 What’s Inside the Humanitarian Aid KPI Dashboard in Power BI
When you purchase this dashboard, you receive:
✔ 3 fully interactive Power BI pages
✔ Month & KPI Group slicers
✔ MTD and YTD tracking system
✔ Actual vs Target comparison logic
✔ Current Year vs Previous Year benchmarking
✔ Conditional performance icons
✔ Drill-through KPI documentation page
✔ Excel-integrated data model
This is not just a dashboard — it’s a professional humanitarian performance monitoring system.
🛠 How to Use the Humanitarian Aid KPI Dashboard in Power BI
Getting started is simple:
1️⃣ Update data in the Excel file:
• Input Actual Sheet
• Input Target Sheet
• KPI Definition Sheet
2️⃣ Open Power BI Desktop.
3️⃣ Click Refresh.
The dashboard updates instantly.
To analyze performance:
✔ Select Month from slicer
✔ Filter KPI Group
✔ Review MTD & YTD metrics
✔ Click a KPI to drill into detailed definition
Even teams with basic Power BI knowledge can manage this dashboard easily.
🌍 Who Can Benefit from This Humanitarian Aid KPI Dashboard in Power BI
This dashboard is ideal for:
🤝 NGOs
🌍 International Relief Agencies
🏥 Health & Medical Aid Programs
🍚 Food Distribution Initiatives
🏠 Shelter & Rehabilitation Projects
📊 Donor Reporting Teams
👩💼 Executive Leadership
Whether you operate locally or globally, this dashboard provides structured visibility into your impact.
The Humanitarian Aid KPI Dashboard in Power BI helps you:
✔ Improve transparency
✔ Strengthen accountability
✔ Optimize resource allocation
✔ Detect underperformance quickly
✔ Enhance donor confidence
✔ Measure year-over-year progress
Instead of reacting to issues late, you gain proactive control.
If your organization wants professional, interactive, and data-driven humanitarian performance monitoring, this Power BI dashboard is your ultimate solution.
Click here to read the Detailed blog post
Visit our YouTube channel to learn step-by-step video tutorials:
👉 https://youtube.com/@PKAnExcelExpert