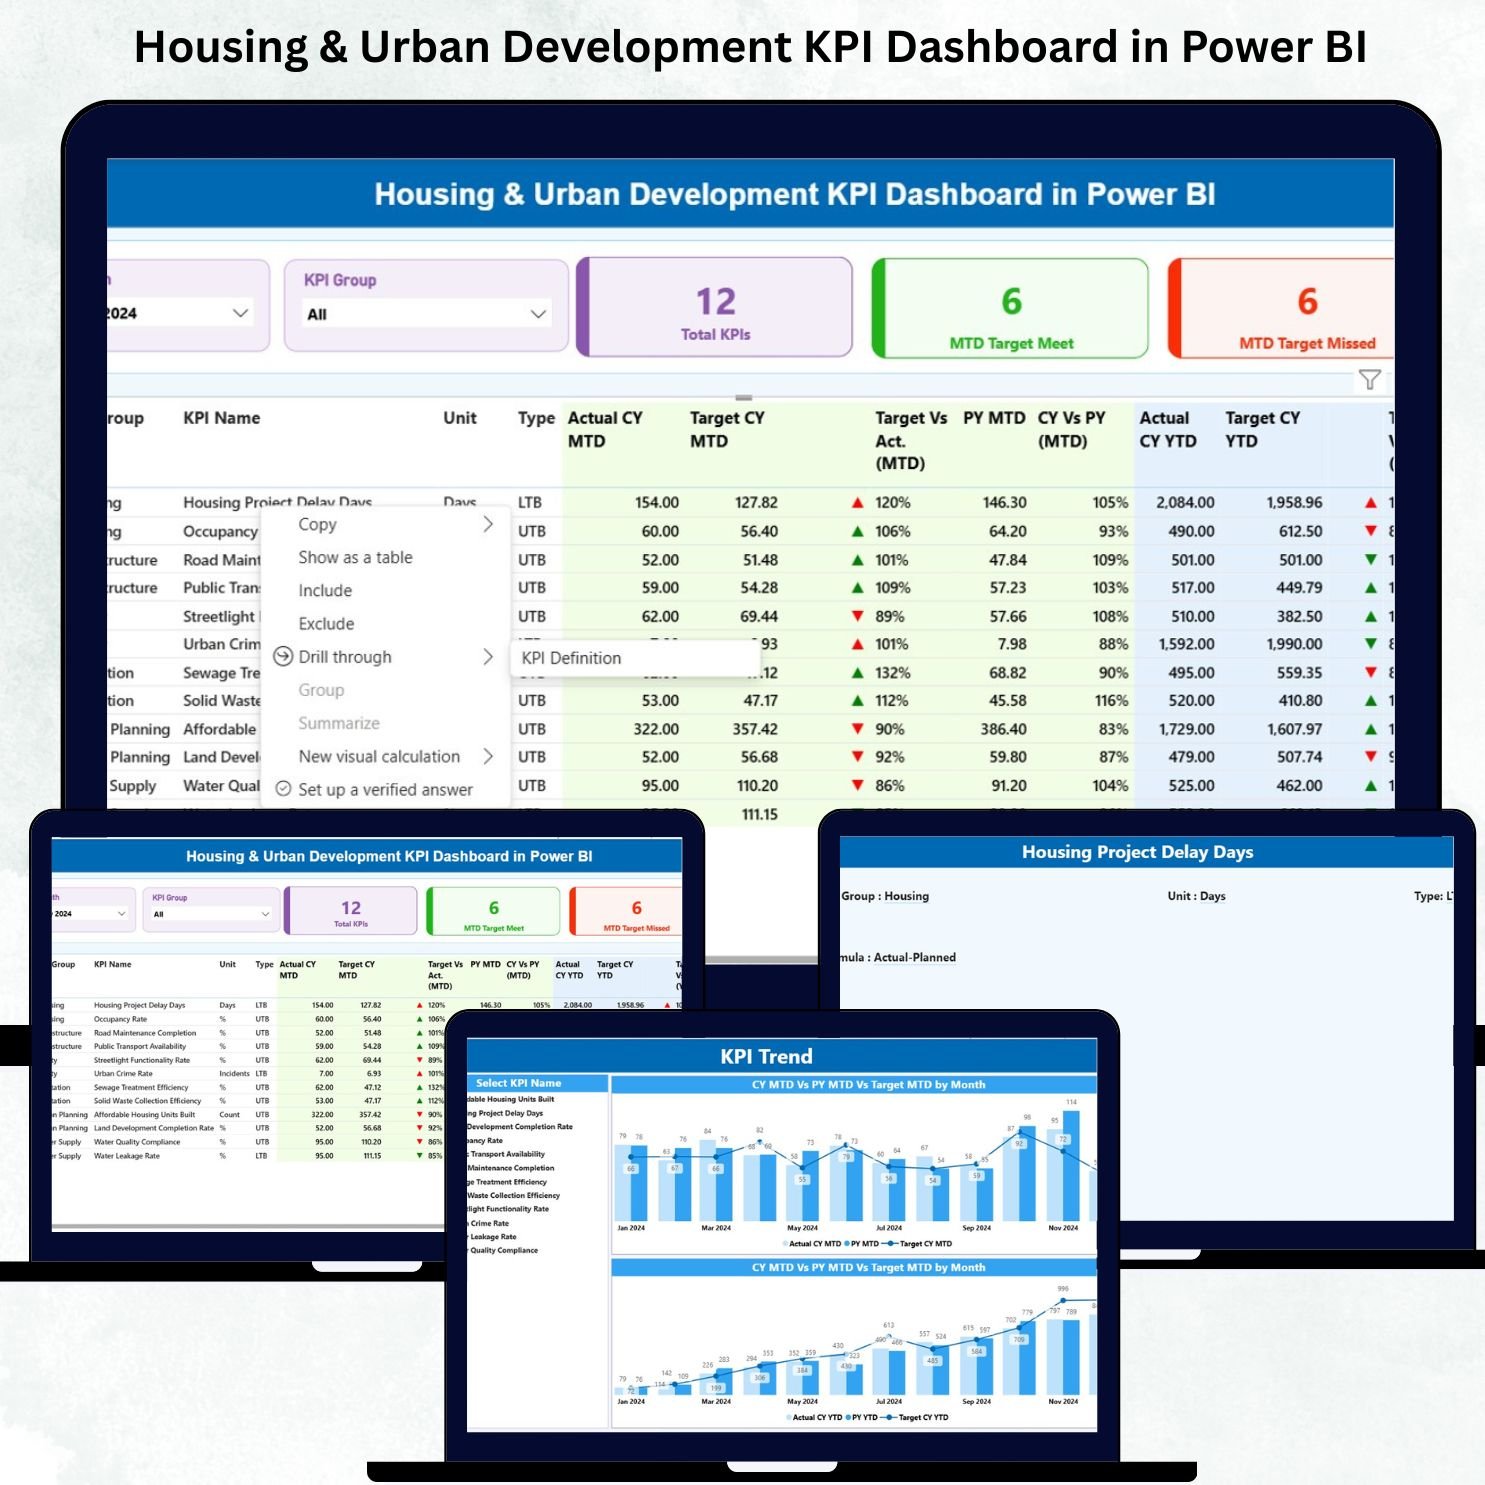
Housing & Urban Development KPI Dashboard in Power BI is a powerful and easy-to-use reporting solution designed for government departments, smart city teams, housing boards, and urban development authorities. This dashboard transforms complex operational and infrastructure data into clear visuals that help teams track performance, detect issues, and make faster decisions. Whether you manage public housing, construction approvals, land allocation, budget utilization, or community development programs, this dashboard gives you the visibility and control you need—all in one place.Housing & Urban Development KPI Dashboard in Power BI.
With automated MTD and YTD calculations, trend charts, KPI definitions, and drill-through pages, this Power BI dashboard ensures your department always stays on top of progress. It also uses a simple Excel file as its data source, making updates extremely easy for any team member.
✨ Key Features of the Housing & Urban Development KPI Dashboard in Power BI
This ready-to-use dashboard comes with a complete performance tracking system that helps you monitor every major activity within housing and urban development.Housing & Urban Development KPI Dashboard in Power BI
💡 ✔ Real-Time Visibility Across All KPIs
Easily track progress on housing construction, roadwork, land development, building approvals, and community programs—right on your screen.
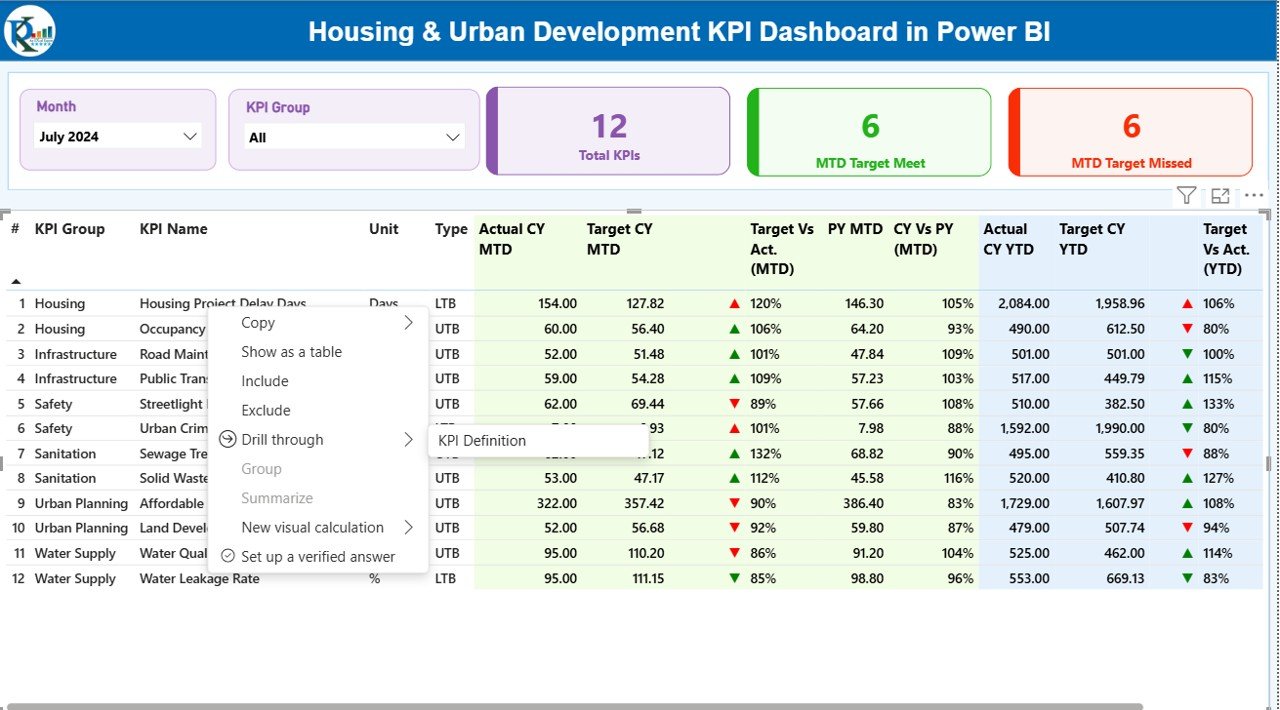
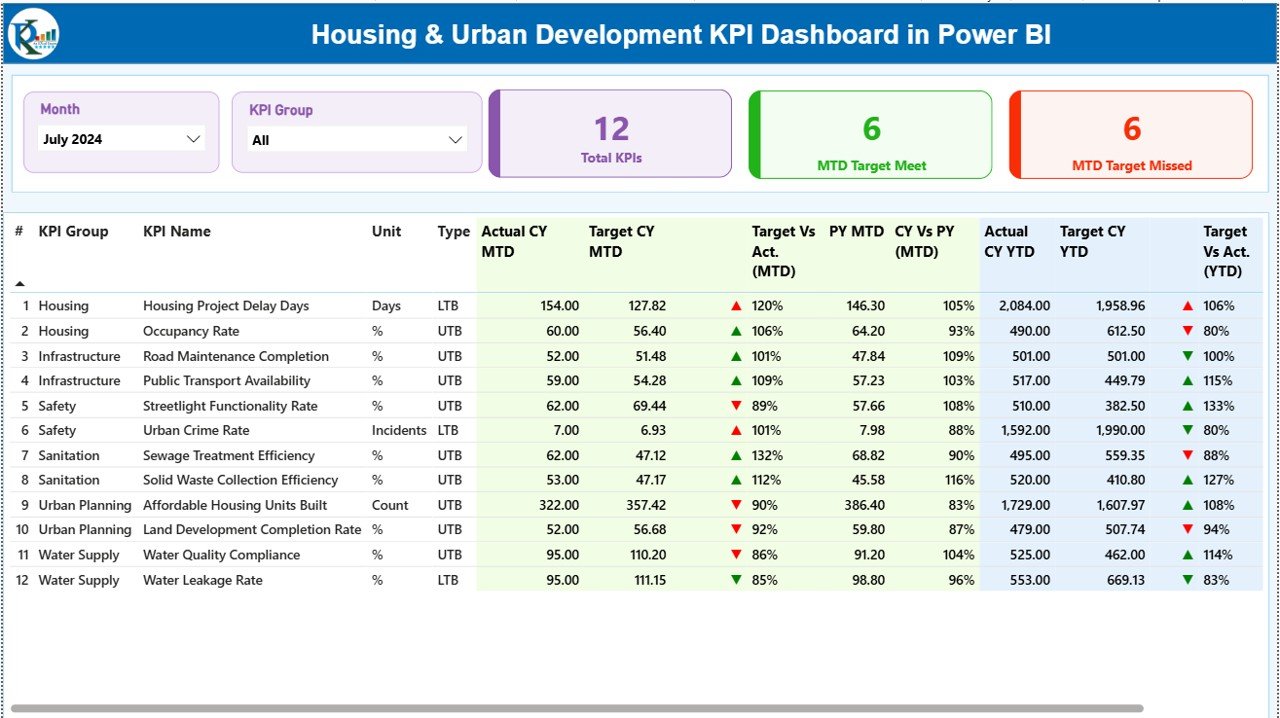
📊 ✔ Summary Page with Smart Filters
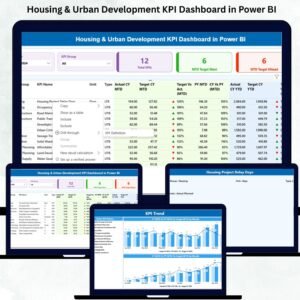
Select Month and KPI Group to instantly view targeted insights. The dashboard shows:
-
Total KPIs Count
-
MTD Target Met Count
-
MTD Target Missed Count
📘 ✔ Detailed KPI Table
View all KPI information such as unit, type (LTB/UTB), MTD values, YTD values, PY comparisons, icons, percentage gaps, and more.
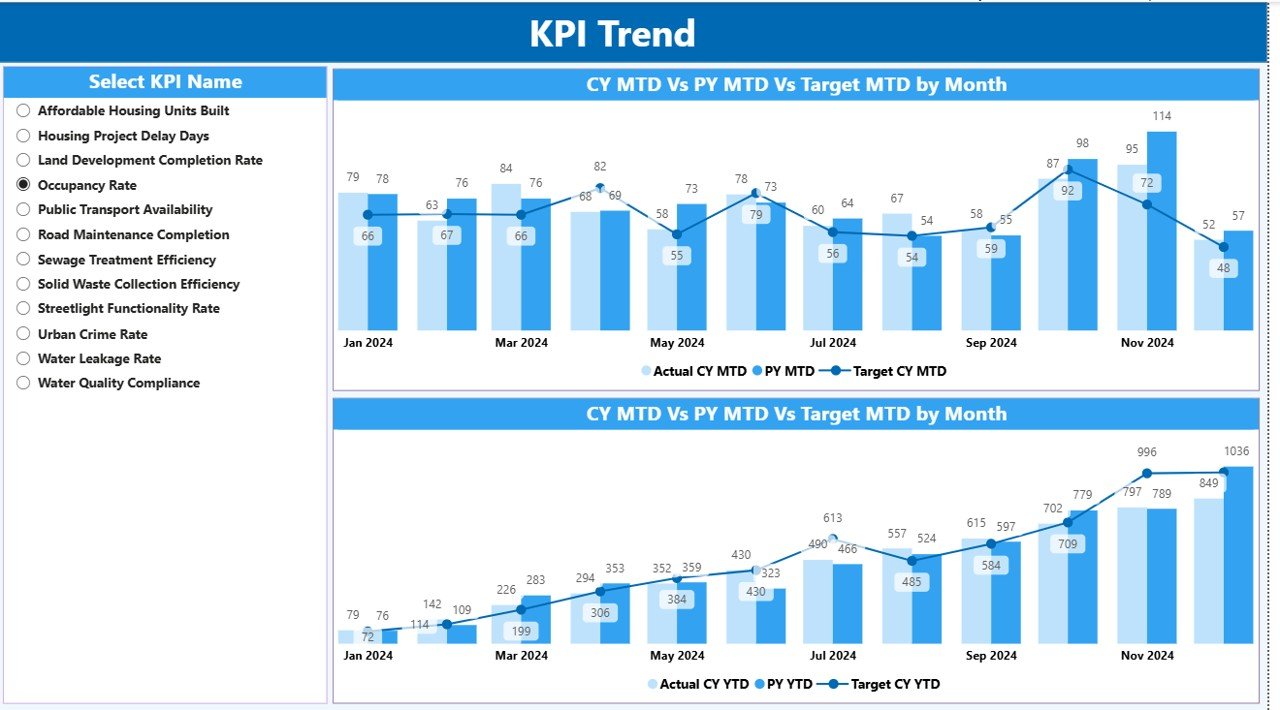
📈 ✔ KPI Trend Page
Analyze month-wise performance and compare Current Year vs Previous Year to identify improvement or decline.
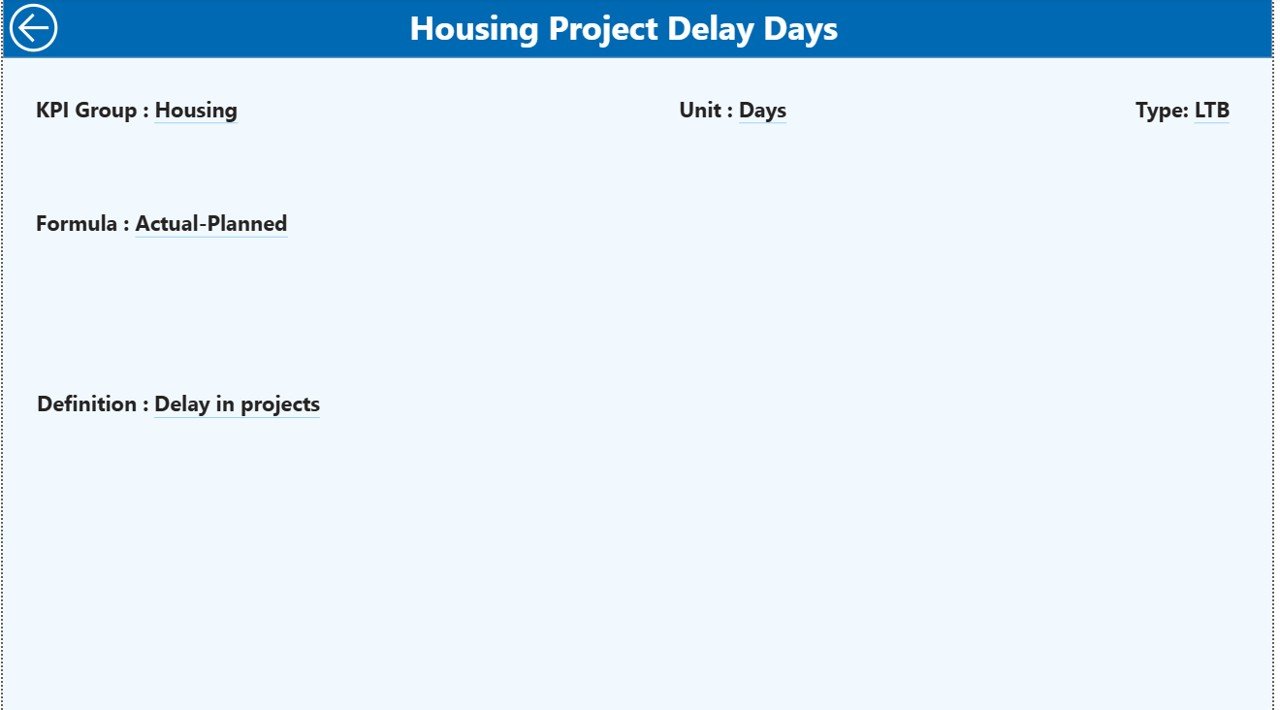
📄 ✔ KPI Definition Page
Understand exactly how each KPI is calculated using formulas, definitions, units, and type guidelines.
📥 ✔ Easy Excel-Based Input
Just fill in Actuals, Targets, and KPI definitions in the Excel file—Power BI updates everything automatically.Housing & Urban Development KPI Dashboard in Power BI
📦 What’s Inside the Housing & Urban Development KPI Dashboard
When you download this digital product, you get a complete monitoring system:
🗂 1. Power BI Dashboard File (.PBIX)
Fully built and ready to use with three interactive pages:
-
Summary Page
-
KPI Trend Page
-
KPI Definition Page
📘 2. Excel Data Source (3 Sheets)
-
Input_Actual – Enter month-wise MTD & YTD values
-
Input_Target – Enter MTD & YTD targets
-
KPI Definition – Define each KPI with formula, type, and description
📝 3. KPI Structure & Tracking Framework
Designed specifically for Housing & Urban Development operations.
📚 4. User Guide Instructions
Simple, step-by-step usage guidance for smooth implementation.Housing & Urban Development KPI Dashboard in Power BI
⚙️ How to Use the Housing & Urban Development KPI Dashboard in Power BI
You don’t need to be an expert in Power BI—just follow these quick steps:
🧩 Step 1: Update the Excel File
Enter Actual and Target values each month in the pre-formatted sheets.
🔄 Step 2: Refresh the Dashboard in Power BI
With one click, all visuals update automatically.
🔍 Step 3: Select Filters
Choose Month and KPI Group to view specific performance areas.
📊 Step 4: Analyze MTD & YTD Performance
Understand which KPIs are meeting goals and which need immediate attention.
📈 Step 5: Review Trends
Track long-term behavior and detect seasonal or recurring issues.
📝 Step 6: Drill Through for KPI Details
Right-click any KPI → “Drill Through” → View full formula, description, and definition.
💼 Step 7: Share Reports with Teams
Export to PDF, publish to Power BI Service, or share with leadership in minutes.Housing & Urban Development KPI Dashboard in Power BI
👥 Who Can Benefit from This Housing & Urban Development KPI Dashboard
This dashboard is created specifically for public sector efficiency and performance monitoring.
🏗 ✔ Housing Boards & Authorities
Track construction progress, occupancy rate, cost per unit, and affordable housing KPIs.
🏙 ✔ Urban Development Departments
Monitor land approvals, infrastructure progress, environmental compliance, and more.
🚧 ✔ Smart City & Municipal Corporation Teams
Manage cross-department KPIs in a consolidated view.
📋 ✔ Project Managers & Planning Officers
Understand delays, highlight risks, and plan better resource allocation.
💼 ✔ Government Reporting & Finance Teams
Track budget utilization and compare target vs actual performance.
🧩 ✔ Consultants & Urban Planners
Use data-driven insights for planning, proposals, and presentations.
### Click here to read the Detailed blog post
Watch the step-by-step video tutorial:


Reviews
There are no reviews yet.