Managing a housing society requires constant monitoring of finances, services, maintenance activities, compliance, and resident satisfaction. However, many societies still depend on manual Excel reports, registers, or scattered data files. As a result, committees struggle to identify performance gaps, rising costs, and service delays at the right time.
That is exactly where the Housing Societies KPI Dashboard in Power BI delivers real value.
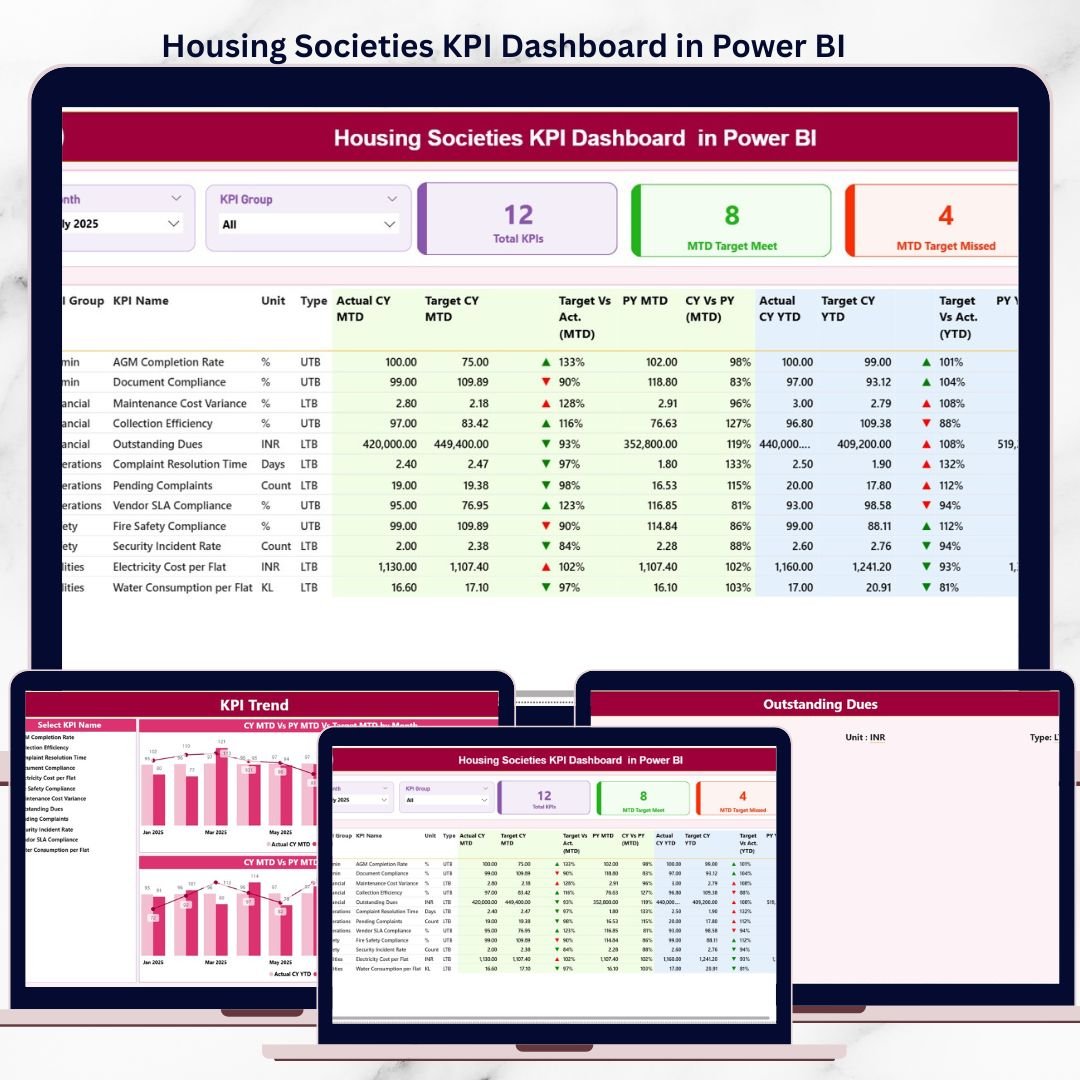
This ready-to-use Power BI dashboard converts raw housing society data into clear, visual, and actionable insights. Instead of guessing or reacting late, committees can now track KPIs in real time, compare performance with targets and previous years, and take confident, data-driven decisions.
Built for transparency and ease of use, this dashboard helps housing societies improve governance, accountability, and operational efficiency—without complex systems or heavy manual work.
✅ Key Features of Housing Societies KPI Dashboard in Power BI
-
📊 Centralized KPI Monitoring – Track all housing society KPIs in one interactive Power BI dashboard
-
🎛️ Month & KPI Group Slicers – Instantly filter performance by month or KPI category
-
🎯 MTD & YTD Performance Tracking – Monitor short-term and long-term results together
-
🔄 Actual vs Target & Previous Year Comparison – Identify gaps and improvement areas clearly
-
⬆️⬇️ Visual KPI Status Icons – Green ▲ and Red ▼ indicators highlight performance instantly
-
📈 Dynamic KPI Trend Analysis – Analyze MTD and YTD trends using combo charts
-
🧠 Drill-Through KPI Definitions – Access formulas and definitions only when needed
📦 What’s Inside the Housing Societies KPI Dashboard in Power BI
This Power BI solution includes three professionally designed pages, supported by a structured Excel data model.
🧭 Summary Page
The main overview page providing instant clarity on society performance.
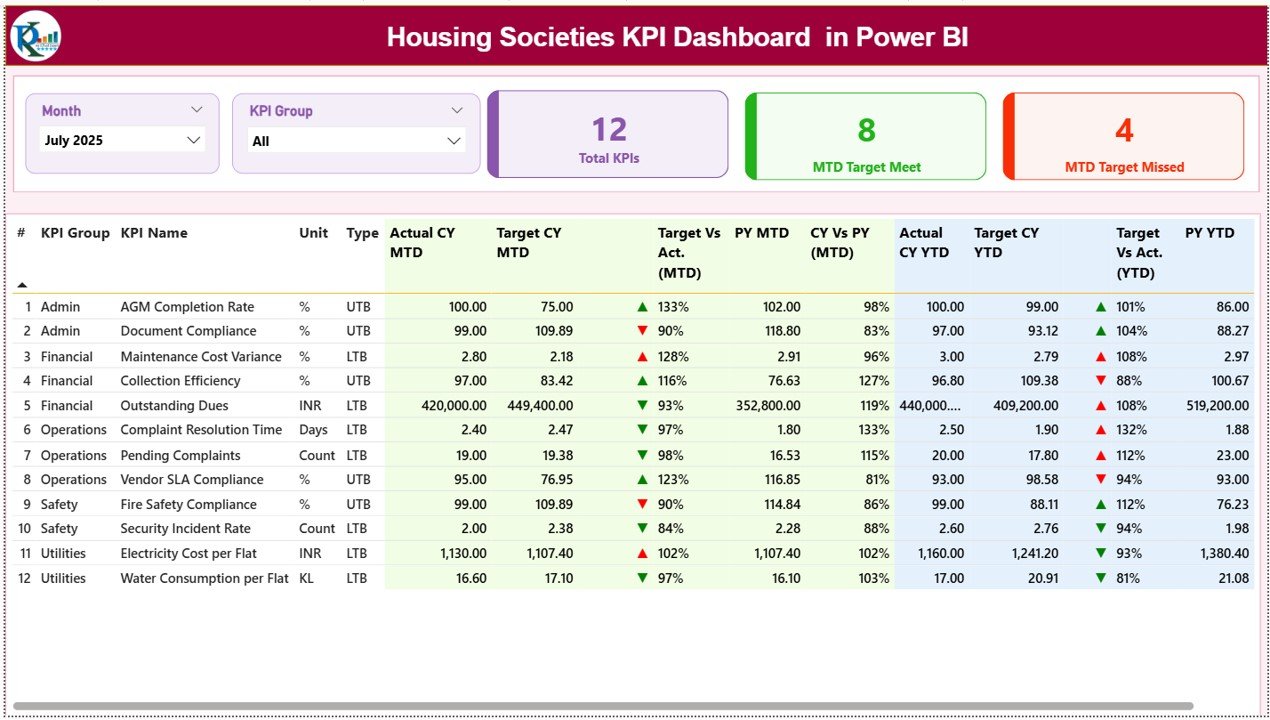
Key elements include:
-
Month slicer for period selection
-
KPI Group slicer for category-wise filtering
-
KPI cards showing:
-
Total KPIs
-
MTD Target Met count
-
MTD Target Missed count
-
-
A detailed KPI table displaying MTD, YTD, Target, Previous Year values, and variance percentages
This page enables committee members to understand performance health in seconds.
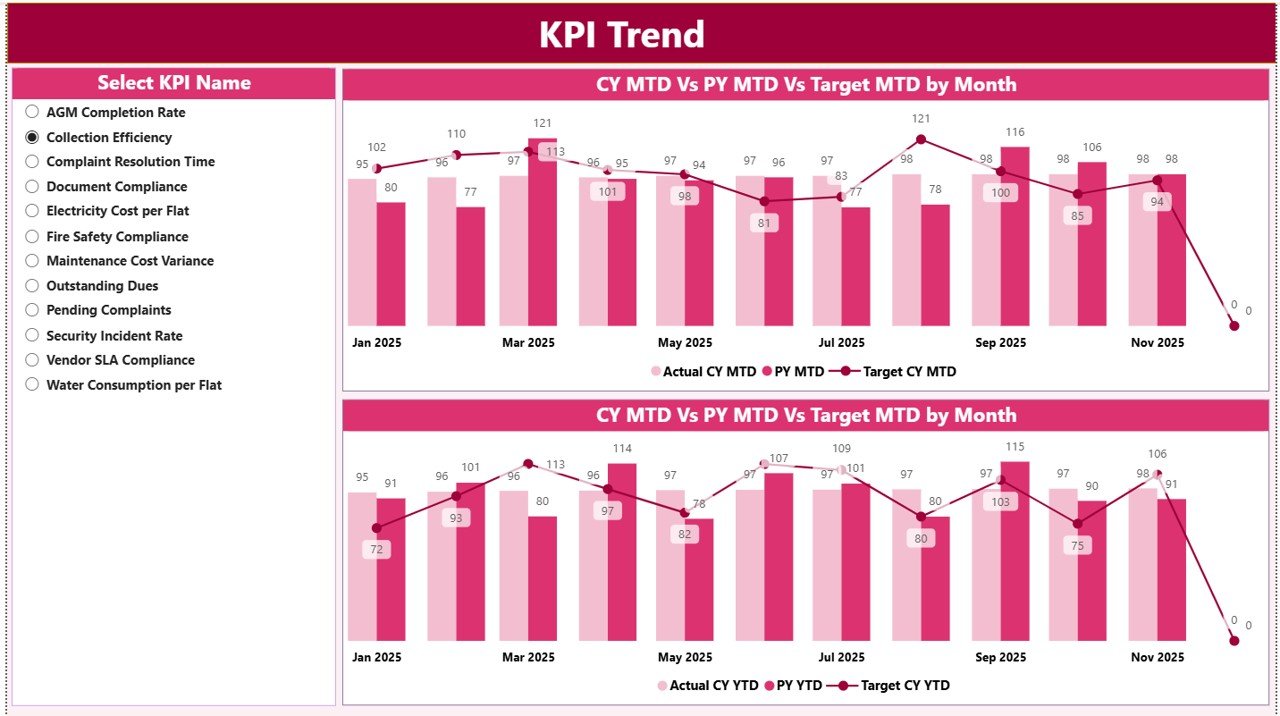
📈 KPI Trend Page
This page focuses on visual trend analysis.
Key highlights:
-
KPI Name slicer for selecting individual KPIs
-
MTD combo chart showing Actual, Target, and Previous Year
-
YTD combo chart showing long-term performance behavior
Trend visuals help users move beyond static numbers and understand performance patterns.
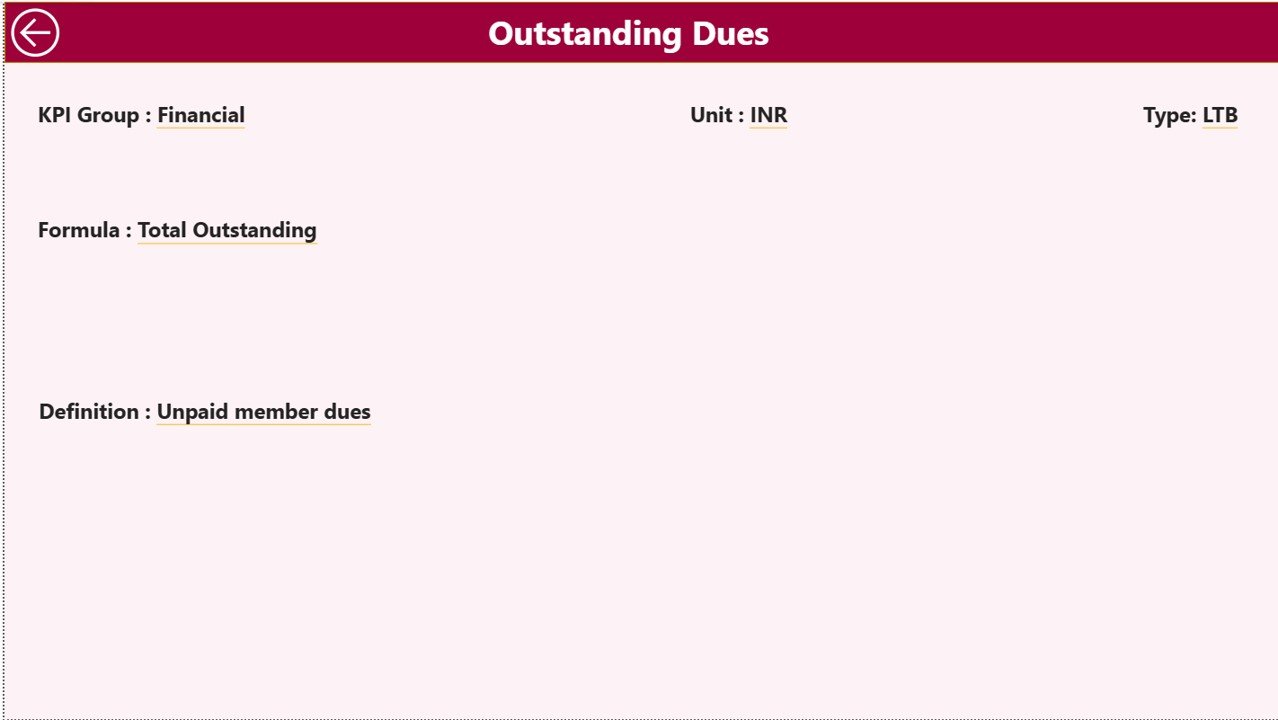
📘 KPI Definition Page (Drill-Through)
A hidden drill-through page used for governance and clarity.
Displays:
-
KPI Formula
-
KPI Definition
-
Back navigation to Summary Page
This keeps the main dashboard clean while ensuring transparency when required.
🛠️ How to Use the Housing Societies KPI Dashboard in Power BI
Using this dashboard is simple and structured:
1️⃣ Enter Actual, Target, and Previous Year data in Excel
2️⃣ Refresh the Power BI dashboard
3️⃣ Select Month and KPI Group using slicers
4️⃣ Review MTD and YTD performance instantly
5️⃣ Analyze trends and variances visually
6️⃣ Drill through for KPI definitions when needed
No advanced Power BI expertise is required—basic Power BI interaction skills are sufficient.
👥 Who Can Benefit from This Housing Societies KPI Dashboard?
This dashboard is ideal for:
-
🧑💼 Housing Society Committee Members
-
🏢 Apartment Owners Associations
-
🛠️ Society & Facility Managers
-
📋 Consultants and Auditors
-
🧠 Management & Advisory Teams
Whether managing a small residential society or a large apartment complex, this dashboard scales easily.
📖 Click here to read the Detailed blog post
🎥 Visit our YouTube channel to learn step-by-step video tutorials
👉 Youtube.com/@PKAnExcelExpert


Reviews
There are no reviews yet.