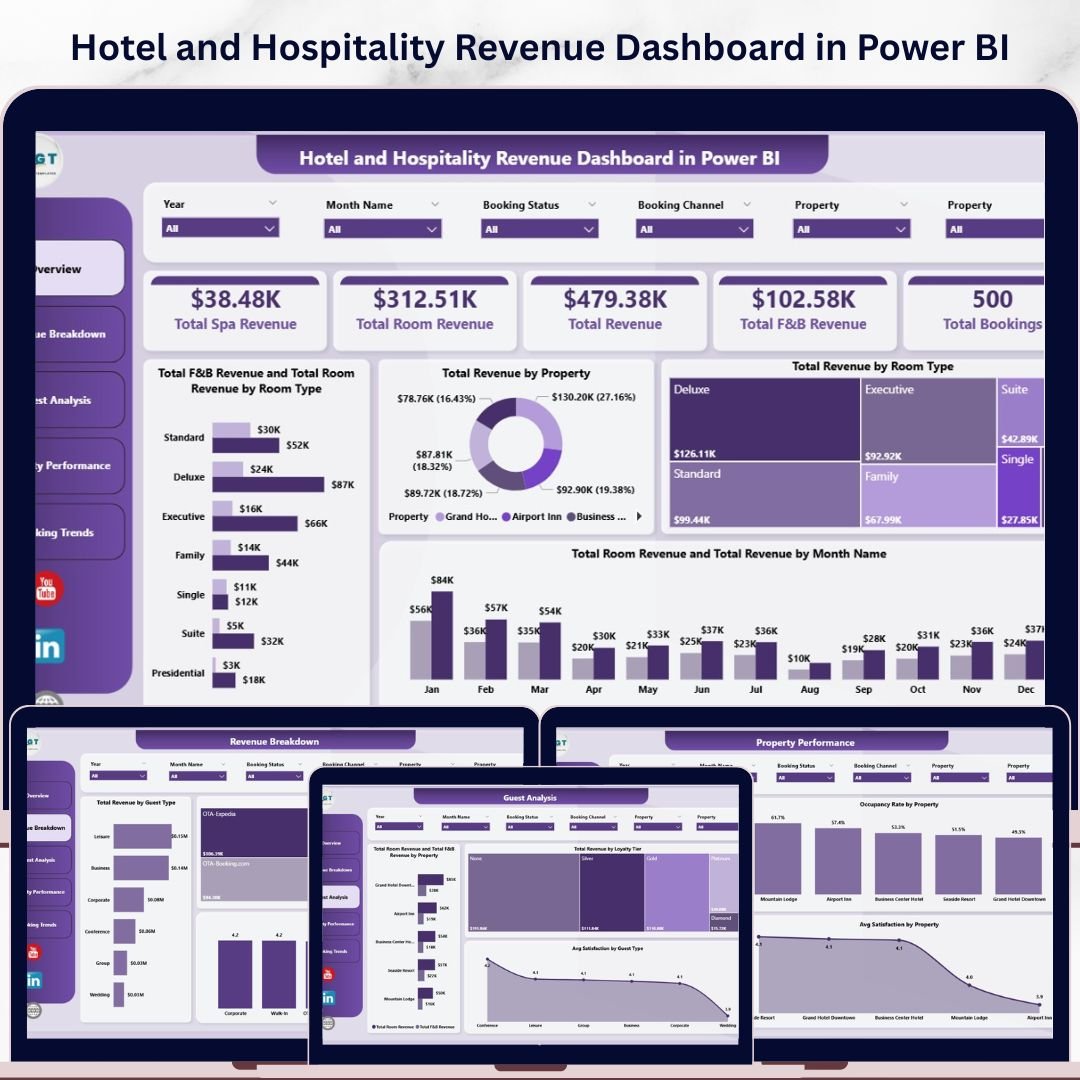


Hotel and Hospitality Revenue Dashboard in Power BI is a professionally designed, ready-to-use Power BI dashboard template that gives hotel managers, revenue analysts, and hospitality professionals a complete view of their property’s financial performance. This template includes 5 interactive dashboard pages covering everything from room revenue and F&B analysis to guest satisfaction, booking trends, and property-level occupancy tracking. With built-in slicers for quick filtering and dynamic visuals, you get instant clarity on how your hotel business is performing across every key metric.
🔑 Key Features of Hotel and Hospitality Revenue Dashboard in Power BI
📌 5 Interactive Dashboard Pages – Overview, Revenue Breakdown, Guest Analysis, Property Performance, and Booking Trends give you a 360-degree view of hotel operations and revenue streams.
📌 KPI Summary Cards – Instantly view Total Spa Revenue, Total Room Revenue, Total Revenue, Total F&B Revenue, and Total Bookings at a glance on the Overview page.
📌 Dynamic Slicers & Filters – Apply multiple slicers to filter the entire dashboard by property, room type, guest type, booking channel, date range, and more for instant filtered views.
📌 Revenue Analysis by Room Type & Property – Compare Total F&B Revenue and Total Room Revenue by Room Type, analyze Total Revenue by Property, and track monthly revenue trends across all properties.
📌 Guest & Channel Insights – Break down revenue by Guest Type and Booking Channel, measure Avg Satisfaction by Booking Channel, and understand which loyalty tiers drive the most revenue.
📌 Property Performance Tracking – Monitor Total Bookings, Occupancy Rate, and Avg Satisfaction by Property to identify top-performing and underperforming locations.
📌 Booking Trend Analysis – Track Checked-Out vs Cancelled Bookings by Month, and analyze cancellation and checkout patterns by Booking Channel to optimize your booking strategy.
📌 Power BI Native – Built entirely in Power BI Desktop with DAX measures, relationships, and optimized data model. Just connect your data source and go.
📦 What’s Inside the Hotel and Hospitality Revenue Dashboard in Power BI
This Power BI Dashboard template contains 5 interactive pages designed to cover every aspect of hotel revenue management:
📊 Overview Page – High-level KPI cards showing Total Spa Revenue, Total Room Revenue, Total Revenue, Total F&B Revenue, and Total Bookings. Charts include Total F&B Revenue and Total Room Revenue by Room Type, Total Revenue by Property, Total Revenue by Room Type, and Total Room Revenue and Total Revenue by Month Name. Multiple slicers let you filter the dashboard instantly.
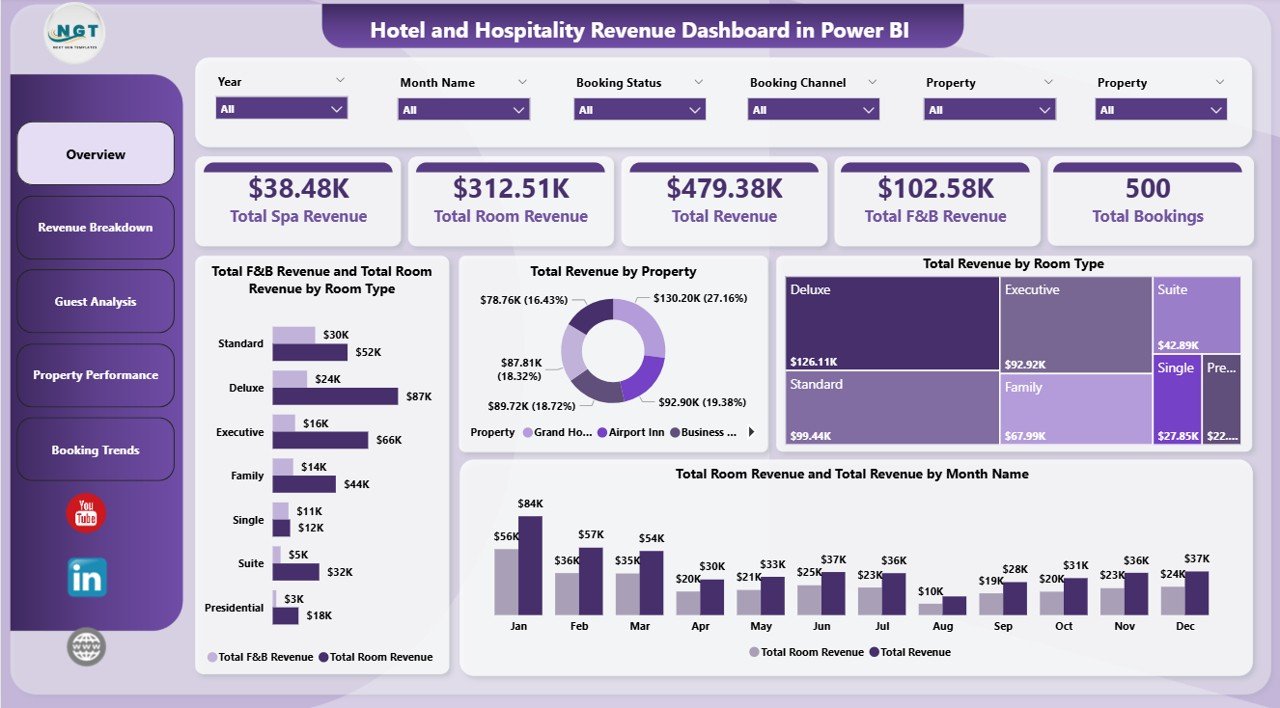 Hotel and Hospitality Revenue Dashboard in Power BI
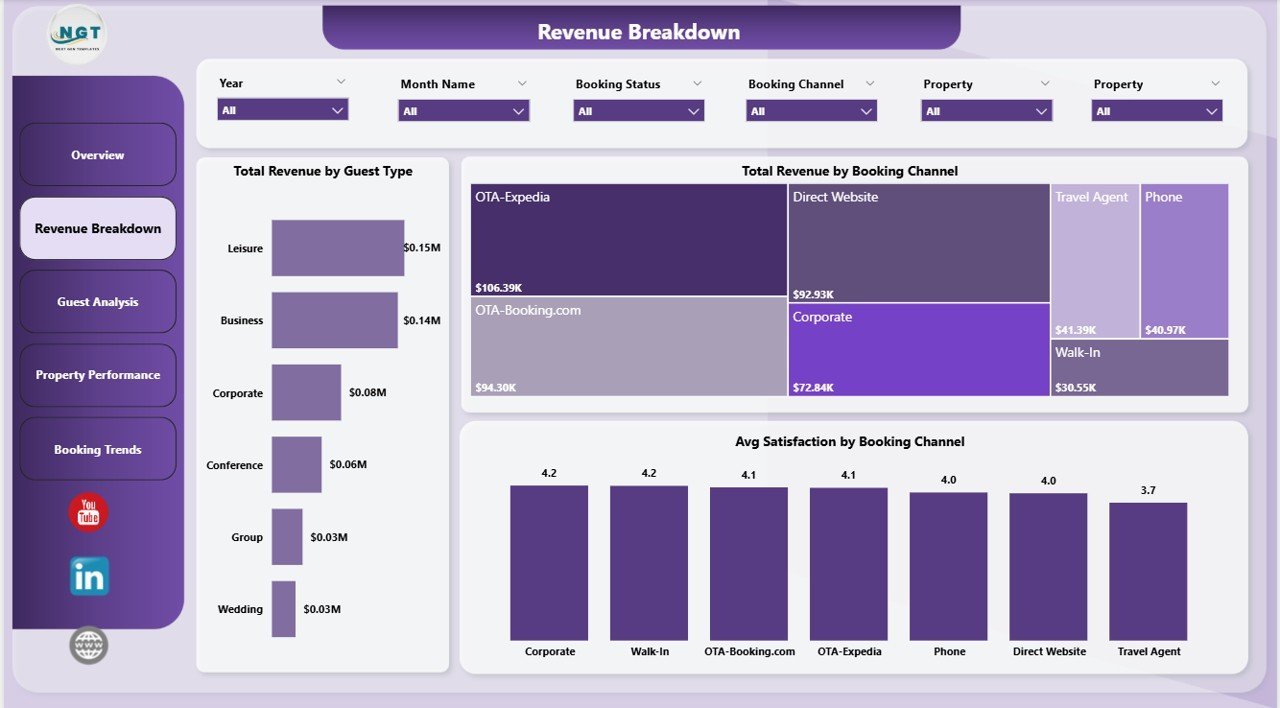
📊 Revenue Breakdown – Detailed revenue analysis with Total Revenue by Guest Type, Total Revenue by Booking Channel, and Avg Satisfaction by Booking Channel to understand which segments and channels drive revenue.
 Revenue Breakdown
📊 Guest Analysis – Deep dive into guest metrics with Total Room Revenue and Total F&B Revenue by Property, Total Revenue by Loyalty Tier, and Avg Satisfaction by Guest Type to optimize your guest experience strategy.
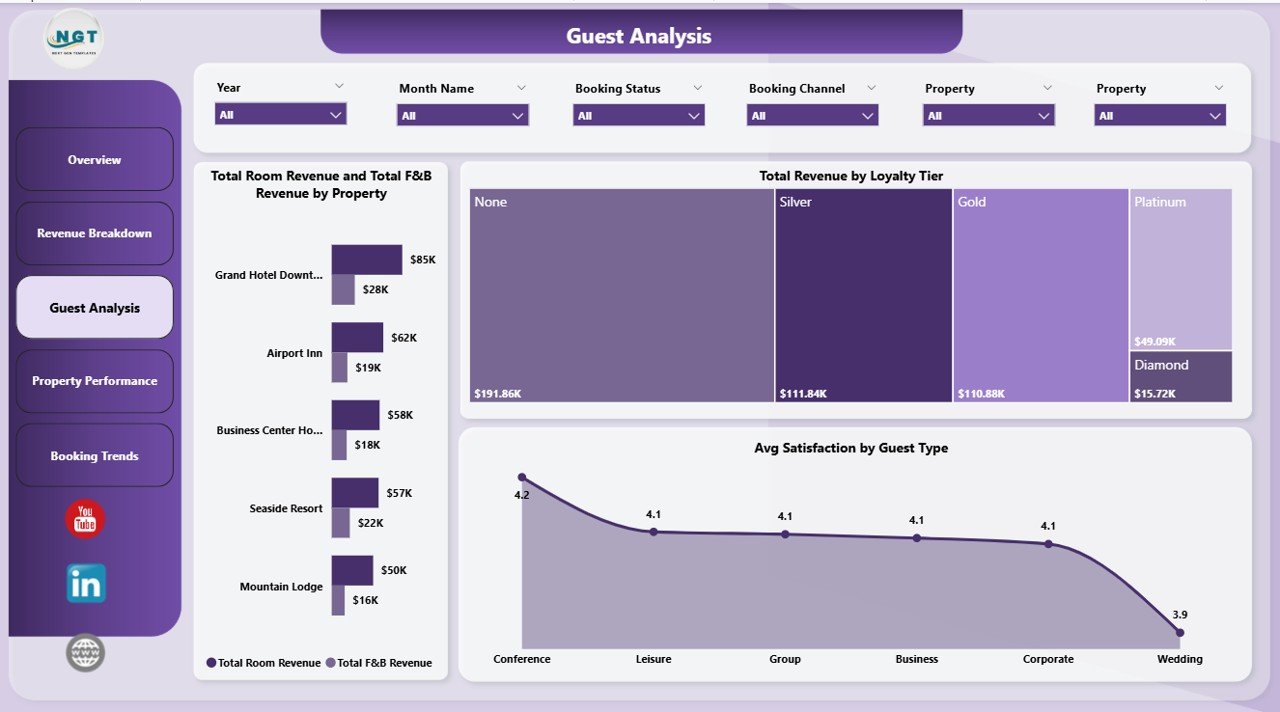 Guest Analysis
📊 Property Performance – Compare properties head-to-head with Total Bookings by Property, Occupancy Rate by Property, and Avg Satisfaction by Property to spot top performers and improvement areas.
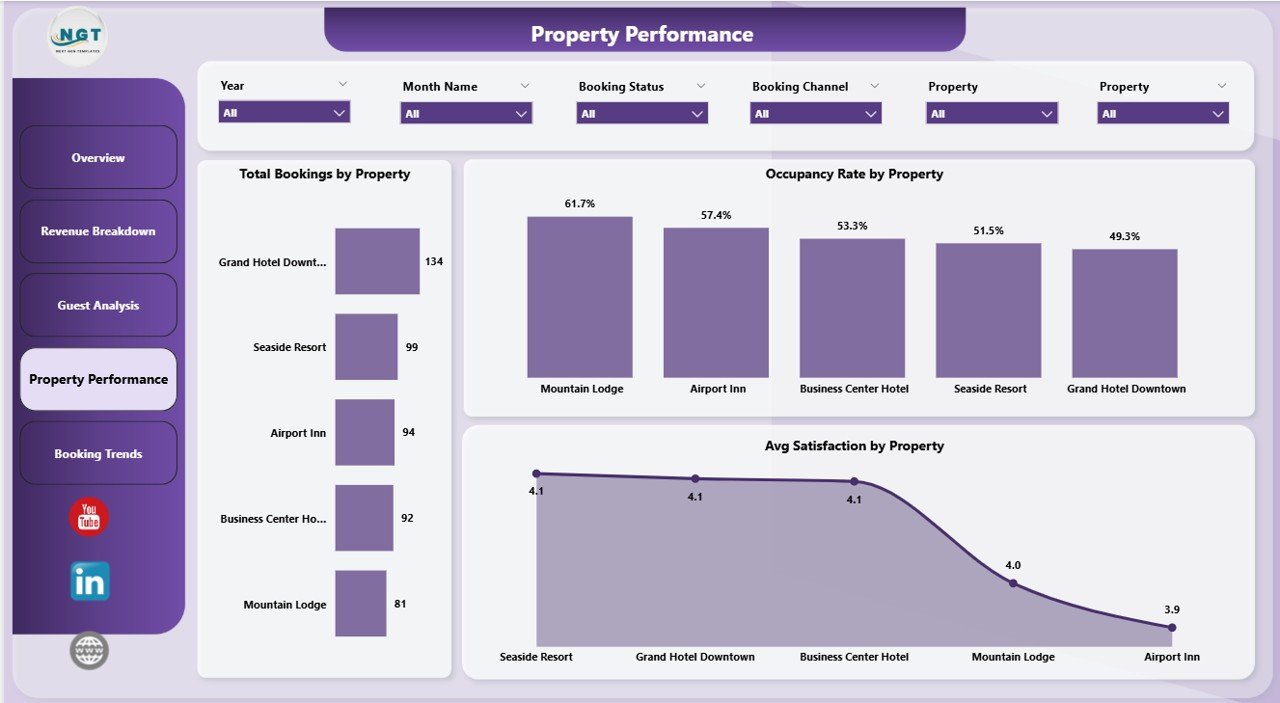 Property Performance
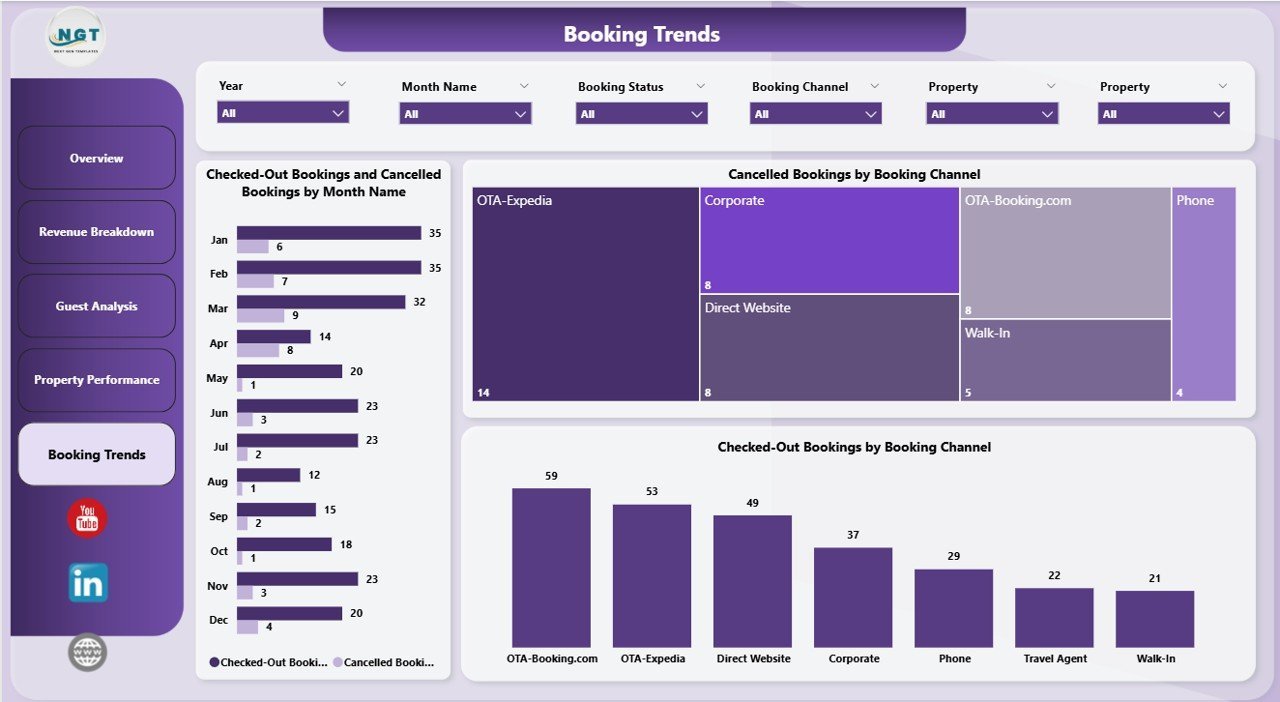
📊 Booking Trends – Track booking patterns with Checked-Out Bookings and Cancelled Bookings by Month Name, Cancelled Bookings by Booking Channel, and Checked-Out Bookings by Booking Channel to reduce cancellations and optimize revenue.
 Booking Trends
⚙️ How to Use the Hotel and Hospitality Revenue Dashboard in Power BI
1️⃣ Download the .pbix file and open it in Power BI Desktop (free from Microsoft).
2️⃣ Replace the sample data with your own hotel data source — Excel, CSV, SQL, or any supported connector.
3️⃣ Refresh the data model and all 5 dashboard pages will auto-update with your actual numbers.
4️⃣ Use the slicers on each page to filter by property, room type, guest type, booking channel, and date range.
5️⃣ Publish to Power BI Service to share with your team and stakeholders for real-time monitoring.
👥 Who Can Benefit from This Hotel and Hospitality Revenue Dashboard in Power BI
🏨 Hotel General Managers tracking overall property revenue and performance
💰 Revenue Managers analyzing room revenue, F&B revenue, and spa revenue trends
📈 Hospitality Analysts monitoring occupancy rates, booking trends, and cancellation patterns
🏢 Multi-Property Owners comparing performance across multiple hotel locations
🎯 Marketing Teams evaluating booking channel effectiveness and guest satisfaction scores
📊 Finance Teams consolidating revenue data for reporting and forecasting
❓ Frequently Asked Questions
What KPIs does the Hotel and Hospitality Revenue Dashboard in Power BI track?
The Hotel and Hospitality Revenue Dashboard in Power BI tracks 5 key performance indicators on the Overview page: Total Spa Revenue, Total Room Revenue, Total Revenue, Total F&B Revenue, and Total Bookings. Additional metrics include Occupancy Rate, Avg Satisfaction, and revenue breakdowns by room type, property, guest type, and booking channel across 5 dedicated dashboard pages.
Do I need advanced Power BI skills to use this template?
No. Simply download the .pbix file, open it in Power BI Desktop, replace the sample data with your own hotel data, and refresh. All charts, KPI cards, slicers, and DAX measures update automatically. No coding or DAX knowledge required.
Can I use this dashboard for multiple hotel properties?
Yes. The dashboard is designed for multi-property analysis. The Property Performance page lets you compare Total Bookings, Occupancy Rate, and Avg Satisfaction across all your hotel locations. Slicers allow filtering by individual property.
What booking channels and guest types are supported?
The template supports all standard booking channels (Direct, OTA, Corporate, Travel Agent, etc.) and guest types (Business, Leisure, Group, etc.). You can customize these categories in the data source to match your specific hotel’s classification system.
Is this compatible with Power BI Service for online sharing?
Absolutely. After customizing the dashboard in Power BI Desktop, publish it to Power BI Service to share with your team, set up scheduled data refresh, and access the dashboard from any device with a web browser.
🔗 Explore Related Templates
🔹 Boutique Hotels Dashboard in Power BI – A specialized Power BI dashboard focused on boutique hotel operations and performance analytics.
🔹 Hotel Chains KPI Dashboard in Power BI – Track KPIs across hotel chain locations with this dedicated Power BI template.
🔹 Hospitality & Resorts KPI Dashboard in Power BI – A comprehensive KPI tracking dashboard for the broader hospitality and resorts industry.
📖 Click here to read the Detailed Blog Post
🎥 Visit our YouTube channel to learn step-by-step video tutorials
👉 YouTub#BLOG_POST_URLe.com/@NextGenTemplates


Reviews
There are no reviews yet.