


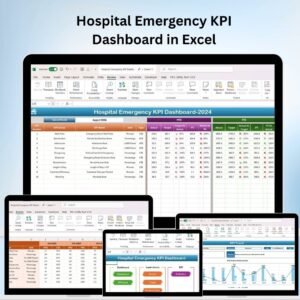
The Hospital Emergency KPI Dashboard in Excel is an essential tool for hospitals, emergency departments (EDs), and healthcare providers to monitor and manage the performance of emergency services. This Excel-based dashboard allows you to track critical key performance indicators (KPIs) such as response times, patient wait times, treatment efficiency, and bed occupancy, helping you improve operational efficiency and enhance patient care in emergency settings.
In high-pressure environments like emergency rooms, timely and effective management is crucial. This dashboard provides real-time insights into hospital emergency operations, helping staff identify bottlenecks, streamline processes, and ensure timely treatment for patients. With customizable features and data visualization tools, the dashboard enables you to make informed decisions and optimize patient care.
Key Features of the Hospital Emergency KPI Dashboard in Excel
📊 Response Time & Patient Wait Time Tracking
Monitor the average response time for emergency services and the time patients spend waiting for care. Track these key metrics to optimize resource allocation and reduce wait times.
⏱ Treatment Time Monitoring
Track how long it takes to treat patients in the emergency department, from arrival to discharge or transfer. This feature helps identify inefficiencies and improve patient flow.
📉 Patient Triage & Severity Levels
Classify patients based on the severity of their condition and track treatment times accordingly. Prioritize care for critical cases to ensure optimal patient outcomes.
🔑 Bed Occupancy & Patient Flow Tracking
Track bed availability and occupancy rates in the emergency department. Ensure that beds are used efficiently and that patients are transferred or discharged in a timely manner.
📈 Emergency Room Capacity & Utilization
Monitor the capacity and utilization of the emergency department, including the number of patients treated, the percentage of full capacity, and the number of patients waiting for treatment.
⚙️ Customizable KPIs & Metrics
Tailor the dashboard to track the specific KPIs most relevant to your hospital’s emergency department operations, whether it’s patient demographics, treatment success rates, or staffing levels.
Why You’ll Love the Hospital Emergency KPI Dashboard in Excel

✅ Track Emergency Room Performance
Monitor key metrics like patient wait times, response times, and treatment durations. Gain insights into the efficiency of your emergency services.
✅ Optimize Patient Flow
Reduce delays by identifying bottlenecks in the emergency room. Improve the patient experience and ensure timely care with real-time data.
✅ Enhance Resource Allocation
Track bed occupancy, patient severity, and treatment times to optimize resource usage and ensure that critical cases are prioritized.
✅ Increase Operational Efficiency
Use data insights to improve emergency room processes, enhance capacity management, and optimize patient care for better outcomes.
✅ Customizable & Scalable
The dashboard is customizable to meet the unique needs of your emergency department. Adjust KPIs, modify tracking fields, and scale the dashboard as your hospital grows.
What’s Inside the Hospital Emergency KPI Dashboard in Excel?
-
Response Time & Patient Wait Time: Track patient wait times and response times from arrival to treatment.
-
Treatment Time Monitoring: Measure the time from patient arrival to discharge or transfer.
-
Triage & Severity Levels: Classify patients by severity and track treatment progress.
-
Bed Occupancy & Patient Flow: Monitor bed usage and patient flow in the emergency department.
-
Emergency Room Capacity: Track capacity utilization and ensure optimal use of resources.
-
Customizable KPIs: Adjust the dashboard to track specific operational metrics.
How to Use the Hospital Emergency KPI Dashboard in Excel
1️⃣ Download the Template: Get instant access to the Hospital Emergency KPI Dashboard in Excel.
2️⃣ Input Data & Set KPIs: Enter patient data, treatment times, and emergency room capacity details into the dashboard.
3️⃣ Monitor Key Metrics: Track KPIs such as response time, wait times, and treatment efficiency.
4️⃣ Analyze Data Trends: Use the data to monitor trends and make informed decisions on resource allocation and operational improvements.
5️⃣ Optimize Emergency Department Operations: Use insights to optimize staffing, treatment processes, and patient flow to enhance care and efficiency.
Who Can Benefit from the Hospital Emergency KPI Dashboard in Excel?
🔹 Emergency Department Managers & Staff
🔹 Healthcare Providers & Medical Institutions
🔹 Hospital Administrators & Operations Managers
🔹 Healthcare Data Analysts & Consultants
🔹 EHR (Electronic Health Record) Teams
🔹 Government & Health Regulatory Bodies
🔹 Medical Professionals and Clinical Teams
Ensure optimal patient care and efficient emergency room operations with the Hospital Emergency KPI Dashboard in Excel. Track key performance metrics, improve resource allocation, and make data-driven decisions to enhance emergency services.
Click here to read the Detailed blog post
Visit our YouTube channel to learn step-by-step video tutorials
Youtube.com/@PKAnExcelExpert


Reviews
There are no reviews yet.