


The healthcare industry is evolving rapidly, and home-based medical services are becoming the new standard of care. As patient expectations rise, providers must manage satisfaction, efficiency, and profitability — all at once. That’s where the Home Healthcare Dashboard in Excel comes in.
This ready-to-use Excel template helps healthcare organizations track key metrics across patients, services, staff roles, and finances — without any coding or additional software. Built with dynamic charts, slicers, and KPI cards, this dashboard consolidates all your critical data into one smart, interactive system. 📊💉
Whether you’re running a home nursing agency, diagnostic lab, or therapy center, this dashboard helps you make faster, data-driven decisions while improving care quality and operational performance.
🌟 Key Features of the Home Healthcare Dashboard in Excel
🧭 1️⃣ Page Navigator – One-Click Navigation
Navigate between multiple analytical pages effortlessly using the left-side page navigator. It adds a professional touch and saves time when exploring insights.
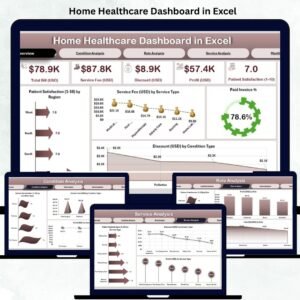
🏠 2️⃣ Overview Page – Your Central Dashboard Hub

Get an instant snapshot of business performance.
Includes:
-
5 KPI Cards summarizing satisfaction, billing, and profits.
-
4 auto-updating charts:
-
Patient Satisfaction (1–10) by Region
-
Service Fee (USD) by Service Type
-
Paid Invoice (%)
-
Discount (USD) by Condition Type
-
-
Slicers for quick filtering by month, region, or service type.
💡 Purpose: View top-level performance metrics instantly and identify where improvement is needed.
🩺 3️⃣ Condition Analysis Page – Track by Patient Condition
Analyze satisfaction, service cost, and profitability by medical condition.
Charts Include:
-
Patient Satisfaction (1–10) by Condition Type
-
Service Fee (USD) by Condition Type
-
Profit (USD) by Condition Type
🏥 Benefit: Identify which treatments deliver the best outcomes and margins, helping optimize both care quality and pricing.
👩⚕️ 4️⃣ Role Analysis Page – Measure Staff Impact
Understand the performance of your medical team.
Charts Include:
-
Patient Satisfaction (1–10) by Role
-
Profit (USD) by Role
-
Total Bill (USD) by Role
📈 Use Case: Evaluate contribution by doctors, nurses, and therapists to design better staffing and incentive strategies.
💼 5️⃣ Service Analysis Page – Understand Revenue Streams
Track which services drive profit and satisfaction.
Charts Include:
-
Patient Satisfaction (1–10) by Service Type
-
Profit (USD) by Service Type
-
Discount (USD) by Service Type
💰 Purpose: Compare services like teleconsultations, home visits, and diagnostics to find the most profitable and valued ones.
📆 6️⃣ Month Analysis Page – Spot Seasonal Trends
Monitor month-wise performance trends.
Charts Displayed:
-
Total Bill (USD) by Month
-
Discount (USD) by Month
-
Service Fee (USD) by Month
📅 Benefit: Detect seasonal demand shifts and adjust staffing or resource allocation proactively.
📋 7️⃣ Supporting Data Sheets
All visuals are powered by an easy-to-edit Data Sheet, where you can update patient details, invoices, satisfaction ratings, and revenue figures. Once data is refreshed, every chart updates automatically — no manual work needed.
📦 What’s Inside the Dashboard
✅ 5 Analytical Pages + 1 Data Sheet
✅ Dynamic Slicers and Interactive Filters
✅ Real-Time Auto-Updating Charts
✅ KPI Cards with Conditional Formatting
✅ Pivot-Based Architecture for Accuracy
✅ 100% Editable Excel Template — No Add-Ins Needed
🧭 How to Use the Home Healthcare Dashboard
1️⃣ Enter or paste your organization’s data into the Data Sheet.
2️⃣ Choose filters (month, region, service type) from slicers.
3️⃣ View updated metrics on Overview or Analysis pages.
4️⃣ Track trends and take action on underperforming areas.
5️⃣ Update regularly to maintain real-time insights.
No advanced Excel skills required — just plug in your data and let the dashboard do the work! ⚡
👥 Who Can Benefit from This Dashboard
🏥 Home Nursing Agencies – Monitor satisfaction and profitability.
🧑⚕️ Therapy Providers – Track service and client outcomes.
🏢 Healthcare Administrators – Review staff and financial KPIs.
🔬 Diagnostics Centers – Manage revenue, discounts, and billing.
📊 Consultants & Analysts – Present data visually to clients or management.
🌍 Why Choose This Excel Dashboard
✔️ Real-time healthcare insights at a glance.
✔️ Balanced view of financial, operational, and satisfaction data.
✔️ Fully customizable for any organization size.
✔️ Built entirely in Excel — no extra software required.
✔️ Affordable alternative to BI tools like Power BI or Tableau.
✔️ Designed for professionals with zero coding skills.
The Home Healthcare Dashboard in Excel transforms complex data into clear visuals that inspire action — helping you enhance care quality and profitability.


Reviews
There are no reviews yet.