In the competitive home appliances market, data drives success. Managing product performance, sales, service, and operational costs manually can lead to inefficiencies and missed opportunities. That’s where the Home Appliances KPI Dashboard in Power BI comes in — your complete performance-tracking solution.
This ready-to-use dashboard converts Excel data into interactive visuals and actionable KPIs, empowering decision-makers to monitor business health, track targets, and analyze performance trends in real time. Whether you’re a manufacturer, retailer, or service provider, this tool helps you make data-driven decisions with confidence.
🔑 Key Features of Home Appliances KPI Dashboard in Power BI
-
📊 3 Interactive Pages – Summary, KPI Trend, and KPI Definition.
-
🎯 Target Tracking – Instantly view how many KPIs met or missed MTD and YTD goals.
-
🖥 Real-Time Data Connection – Links directly to Excel for instant refresh.
-
📈 Trend Analysis – Compare Actual vs. Target vs. Previous Year to identify growth or gaps.
-
🔍 Drill-Through Insights – Explore KPI definitions, formulas, and performance breakdowns.
-
⚡ Dynamic Visuals – Color-coded arrows and charts highlight progress visually.
-
📂 Comprehensive KPI Table – Includes KPI name, group, unit, formula, and type (UTB/LTB).
-
✅ Customizable – Easily add, edit, or remove KPIs to match your business model.
-
🚀 User-Friendly Interface – Intuitive slicers and navigation for non-technical users.
📂 What’s Inside the Home Appliances KPI Dashboard
This Power BI dashboard is structured into three key analytical pages, each with a specific purpose:
-
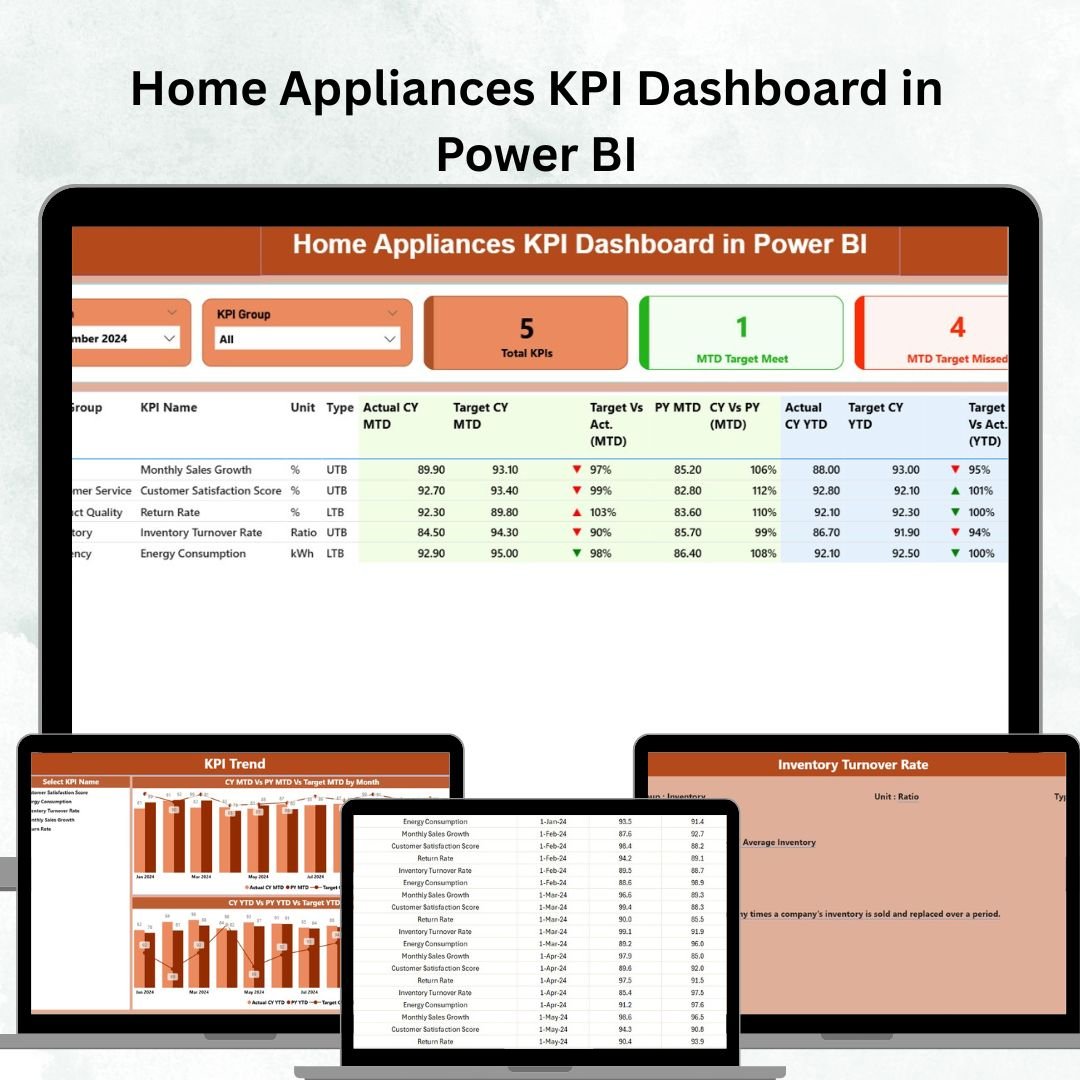
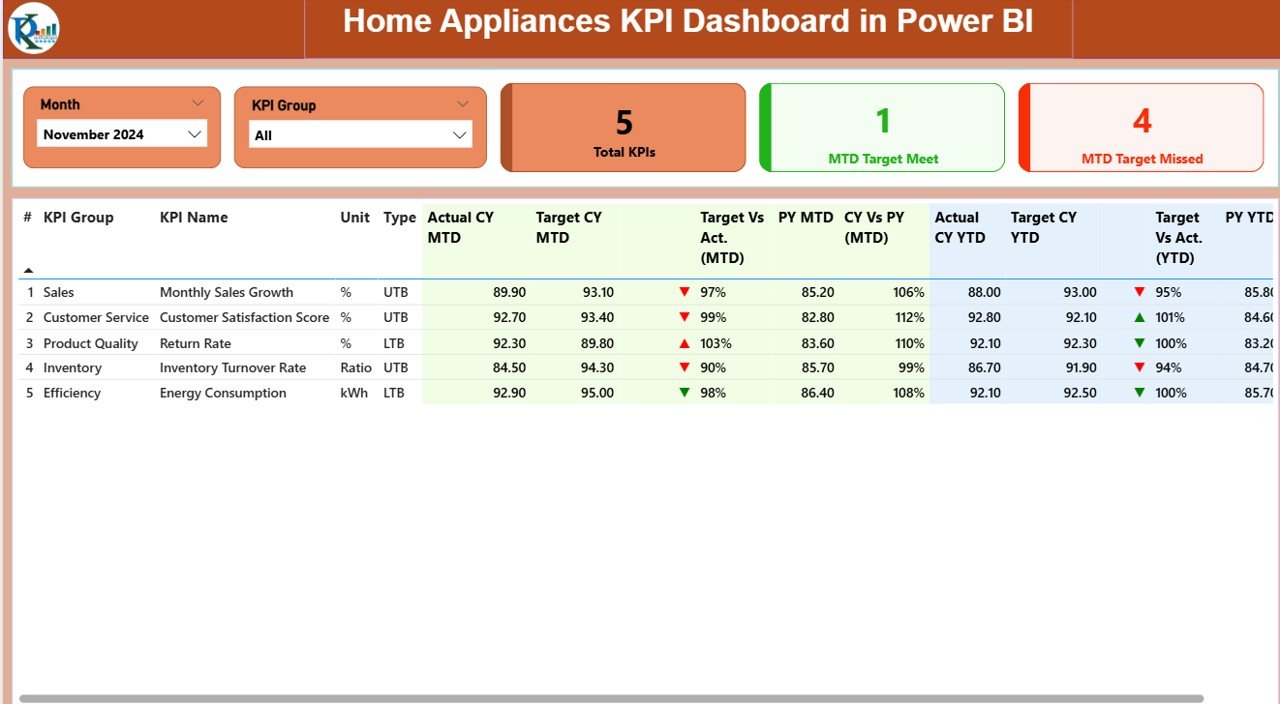
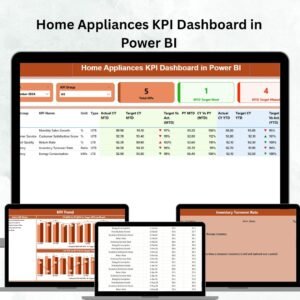
Summary Page – The Central Performance Hub
-
Month and KPI Group slicers for flexible filtering.
-
KPI Cards showing Total KPIs, MTD Target Met, and MTD Target Missed.
-
Detailed KPI Table with performance comparisons:
-
Actual CY MTD vs. Target CY MTD
-
CY vs. PY (Month-to-Date & Year-to-Date)
-
Target Achievement % and indicator icons (▲ or ▼).
-
-
Perfect for managers needing quick visibility of performance metrics.
-
-
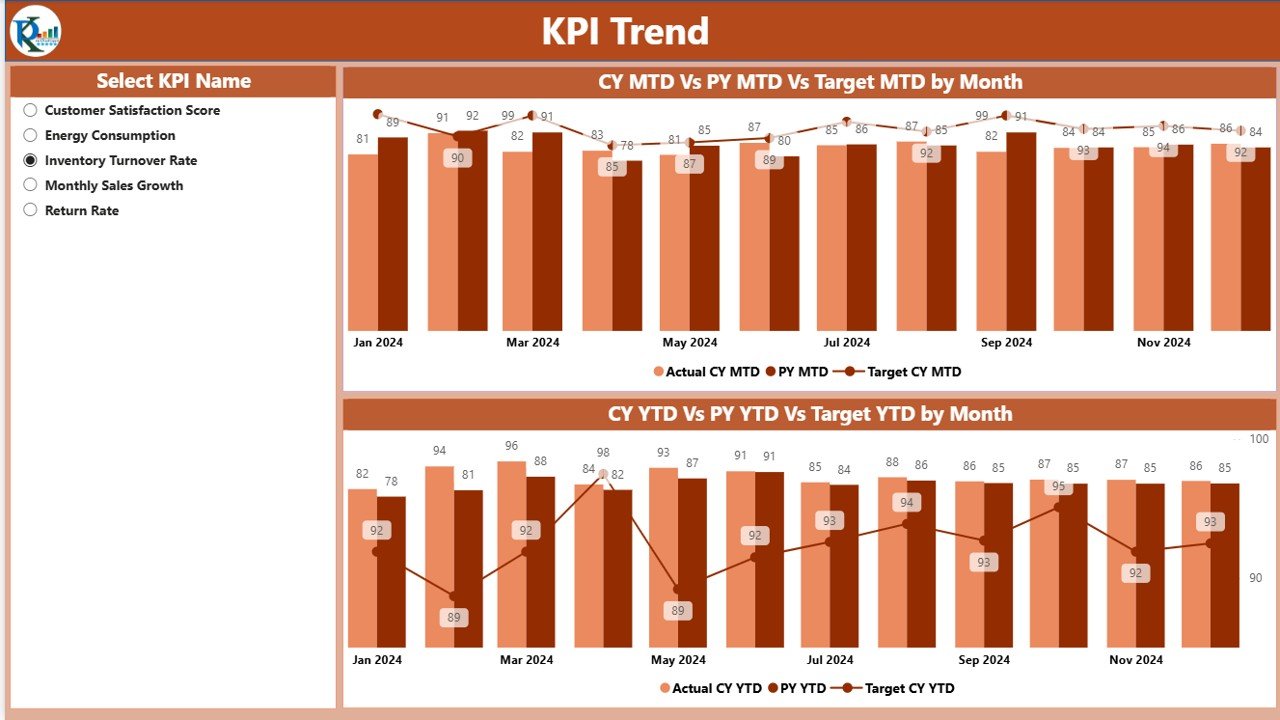
KPI Trend Page – Track Monthly and Yearly Performance
-
Select a specific KPI using dropdown slicers.
-
Dual combo charts show MTD and YTD progress against targets and previous year data.
-
Spot seasonal patterns, campaign impact, and performance shifts over time.
-
-
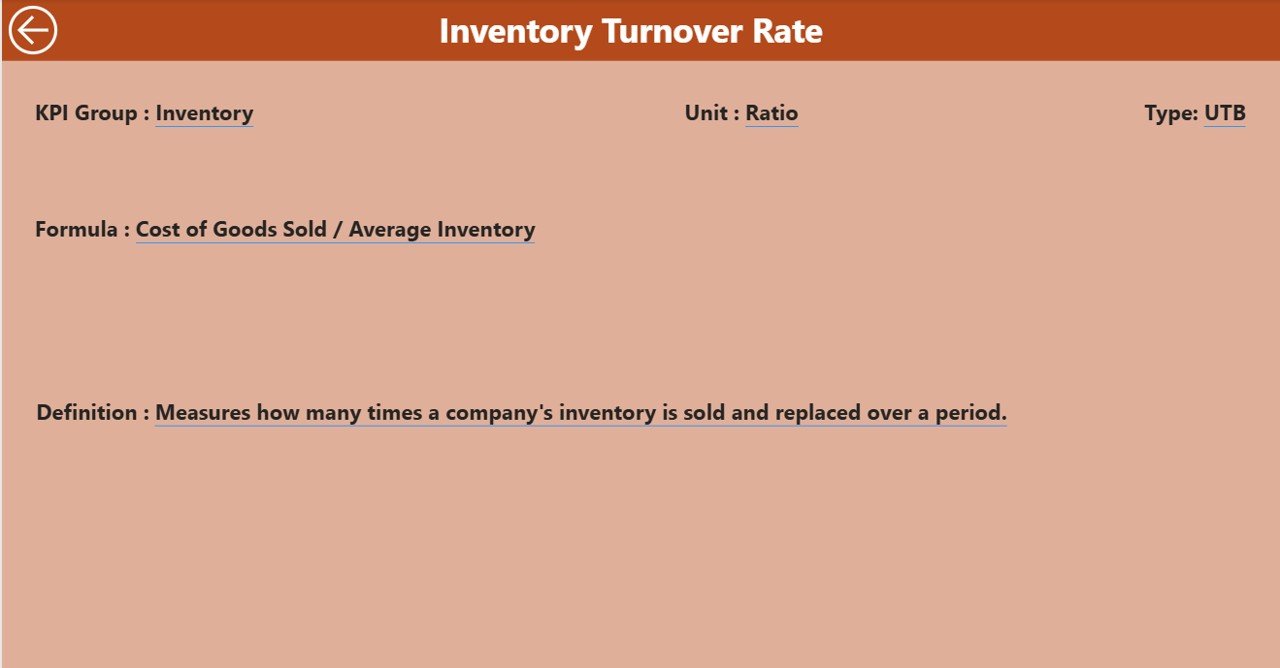
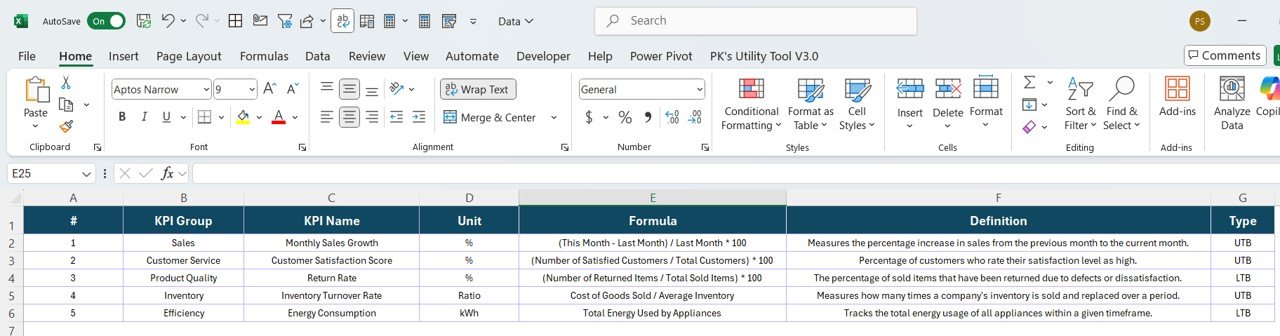
KPI Definition Page – The Knowledge Center
-
Drill-through functionality provides full details for each KPI.
-
Includes KPI Number, Group, Formula, Unit, and Type (UTB or LTB).
-
Back button for smooth navigation to the Summary Page.
-
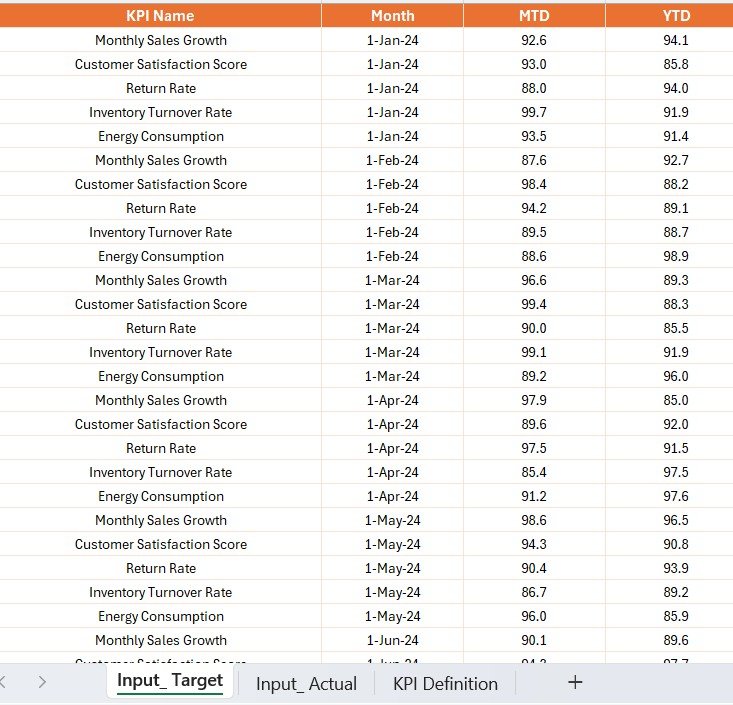
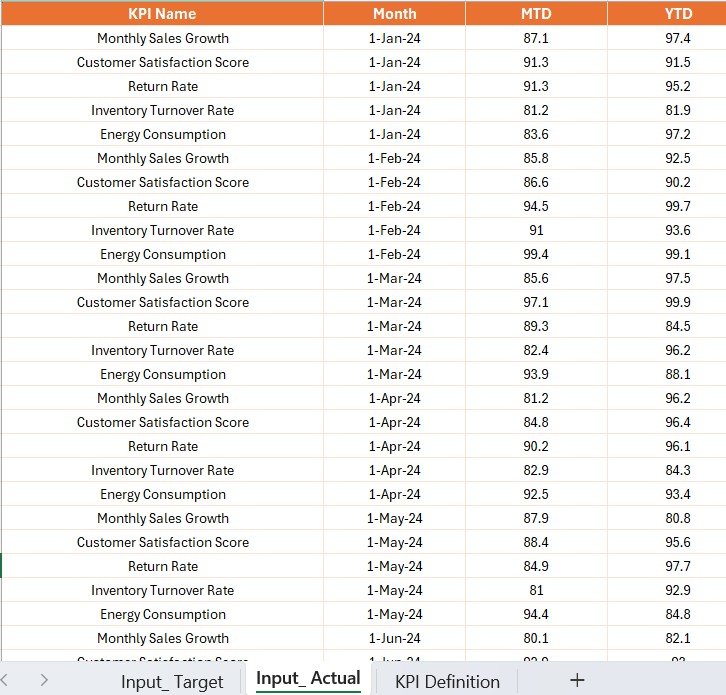
💡 Excel Data Source Structure
-
Input_Actual Sheet: Enter actual monthly performance.
-
Input_Target Sheet: Set monthly and yearly targets.
-
KPI Definition Sheet: Define KPI structure, logic, and measurement type.
🛠 How to Use the Home Appliances KPI Dashboard
-
Enter Data – Update the Excel sheets for Actuals, Targets, and KPI Definitions.
-
Refresh Dashboard – Power BI automatically processes and updates visuals.
-
Filter Data – Use slicers to view performance by month or KPI group.
-
Drill Through – Explore individual KPI details for deeper insights.
-
Review Trends – Analyze progress with interactive combo charts.
-
Share Reports – Publish to Power BI Service for organization-wide access.
👥 Who Can Benefit from This Dashboard?
-
🏭 Manufacturing Managers – Track production quality, costs, and efficiency.
-
🛍 Sales & Marketing Teams – Monitor revenue, conversion rates, and customer satisfaction.
-
🧰 Service Departments – Evaluate complaint handling, repairs, and response times.
-
💰 Finance Teams – Measure profitability and cost variance.
-
👩💼 Executives – Gain a bird’s-eye view of all KPIs in one place.
✅ Why Choose This Dashboard?
The Home Appliances KPI Dashboard in Power BI is a complete performance intelligence system, not just a report. It saves hours of manual reporting and ensures real-time visibility for smarter, faster decisions. From target tracking to trend forecasting, it provides everything a modern appliance business needs to thrive.
Click here to read the Detailed blog post
👉 Visit our YouTube channel to learn step-by-step video tutorials


Reviews
There are no reviews yet.