Managing heavy machinery assets is critical for industries like construction, mining, logistics, and manufacturing — where downtime or inefficiency can lead to significant financial losses. The Heavy Machinery KPI Dashboard in Google Sheets is a ready-to-use analytical solution that simplifies the process of monitoring machine utilization, maintenance, fuel usage, and cost performance.
This dashboard helps operations managers, maintenance teams, and project supervisors visualize real-time metrics, identify inefficiencies, and make data-backed decisions — all in one automated Google Sheet.
With prebuilt calculations, conditional color indicators, and trend charts, it provides comprehensive insights into your heavy equipment performance — no coding or additional software required.
🔑 Key Features of the Heavy Machinery KPI Dashboard in Google Sheets
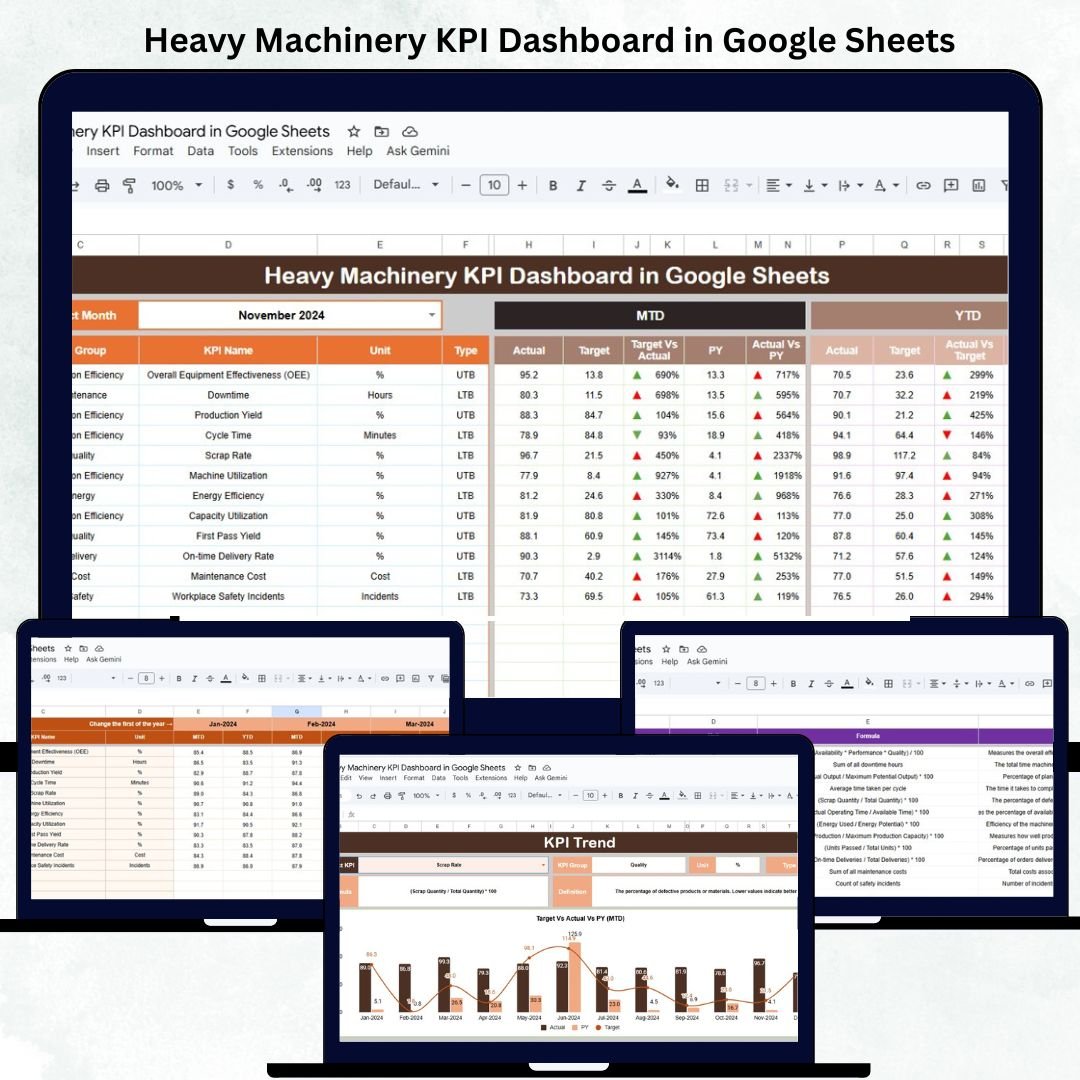
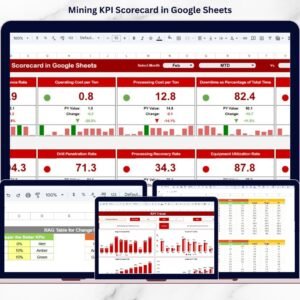
📊 Dashboard Sheet Tab (Main Visualization Page)
The central hub where all KPIs are presented in a clean, visual format.
Features include:
-
📅 Dynamic Month Selector (Cell D3): Select any month and view updated MTD and YTD results.
-
📈 Automated Comparison: Compare Actual vs Target vs Previous Year values.
-
🟢 Conditional Arrows: Instantly identify improved (↑) or declined (↓) KPI performance.
-
⚙️ Full Automation: No formulas to adjust — data syncs automatically from the input sheets.
KPI Cards Displayed:
-
Total Machines in Operation
-
Average Equipment Utilization (%)
-
Average Downtime (hrs)
-
Maintenance Cost ($)
-
Fuel Consumption (liters)
-
Cost per Operating Hour ($)
-
Breakdown Frequency (%)
-
Preventive Maintenance Compliance (%)
-
Availability Rate (%)
-
Operator Efficiency (%)
These cards give managers a clear overview of fleet performance, operational efficiency, and maintenance health at a glance.
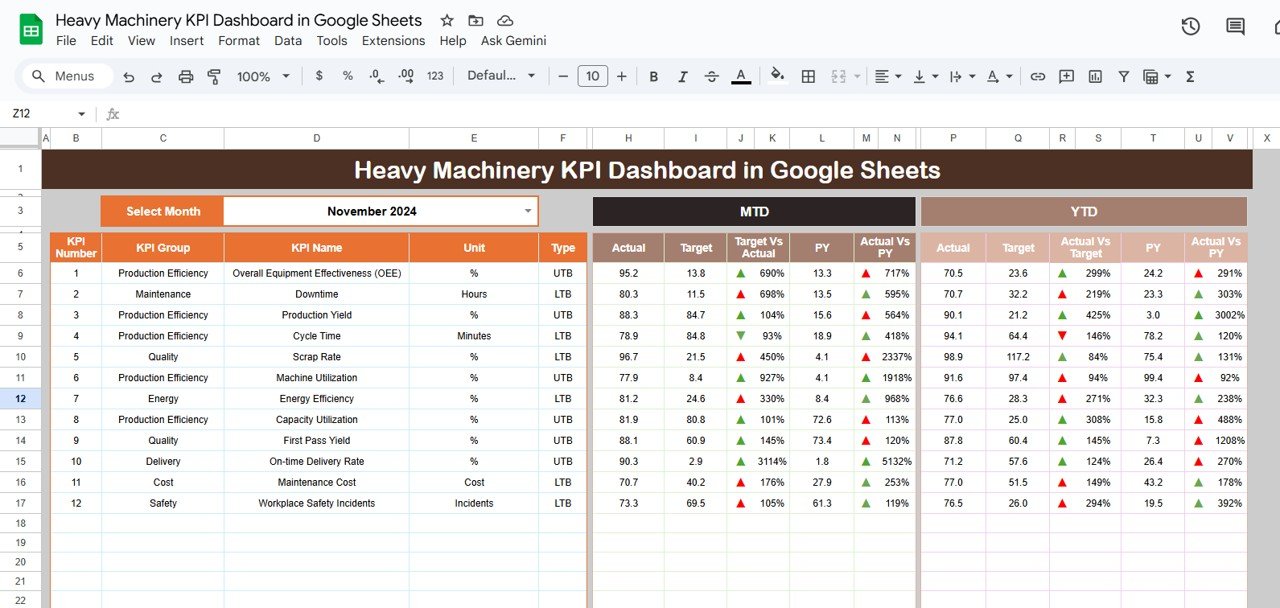
📉 KPI Trend Sheet Tab
Provides in-depth trend analysis for any KPI.
Features:
-
Dropdown in Range C3 to select any KPI.
-
Displays KPI Group, Unit, Formula, Definition, and Type (UTB/LTB).
-
Trend charts show MTD and YTD progress for each month.
This view helps identify seasonal patterns, maintenance cycles, and overall performance trends.
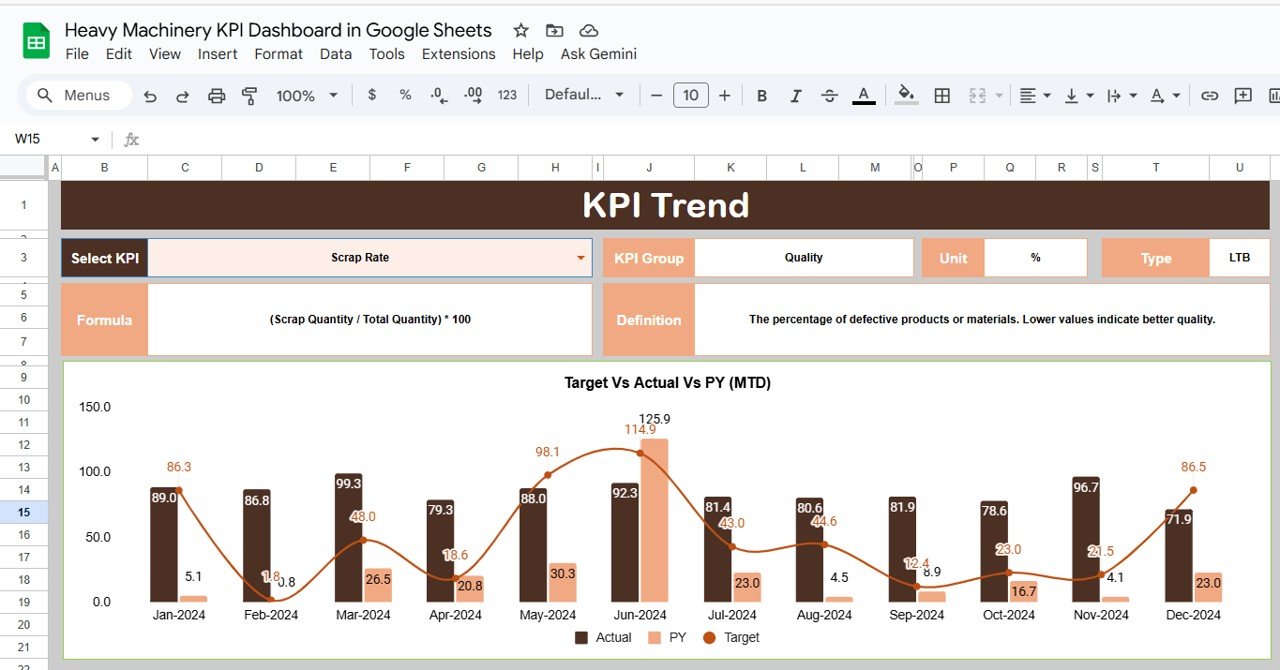
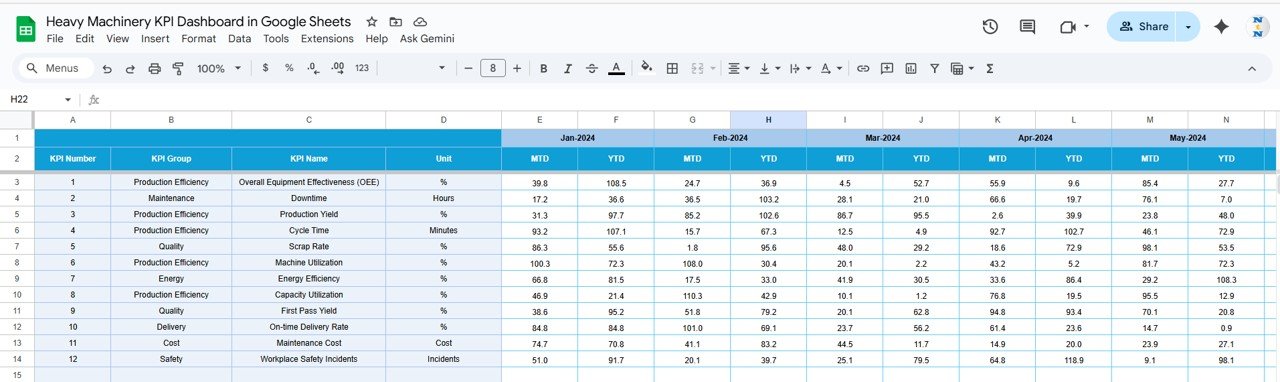
🧾 Actual Number Sheet Tab
The main data entry sheet for logging performance metrics.
-
Input monthly MTD and YTD actuals for each KPI.
-
The current reporting month (cell E1) dynamically updates the dashboard.
-
Ensures consistency in monthly performance tracking.
🎯 Target Sheet Tab
Used to define operational goals for each KPI.
-
Enter monthly and yearly targets.
-
The dashboard calculates achievement percentages automatically.
-
Conditional colors (green/red) indicate if targets are met or missed.
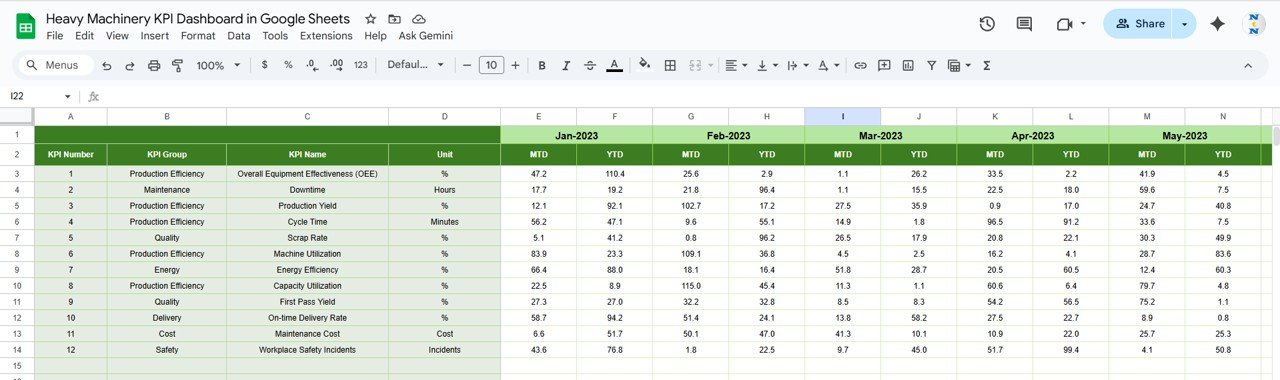
📆 Previous Year Number Sheet Tab
Stores historical KPI data for Year-over-Year (YoY) comparison.
This helps management benchmark progress and identify recurring trends.
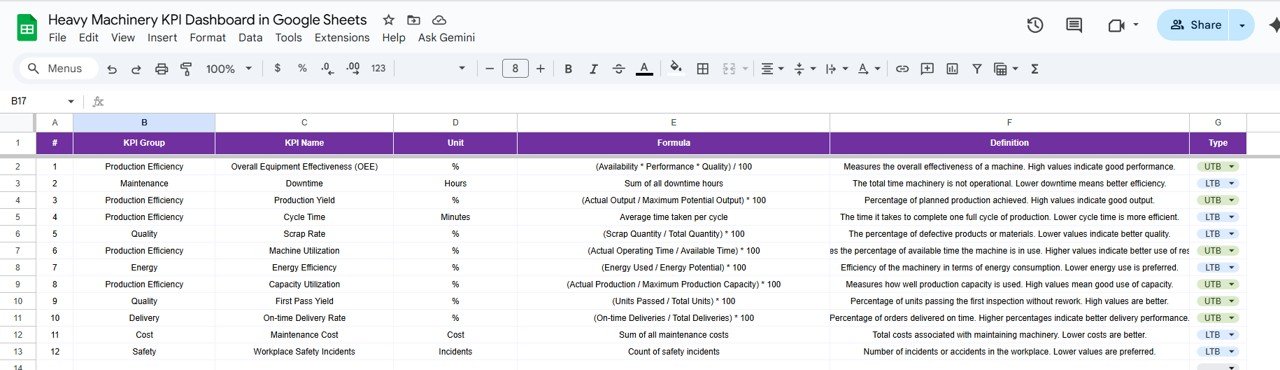
📘 KPI Definition Sheet Tab
A reference sheet listing all KPIs along with:
-
KPI Group
-
Unit of Measurement
-
Formula
-
Definition
-
Type (Upper/Lower the Better)
This ensures consistent interpretation of performance metrics across departments.
📦 What’s Inside the Dashboard
✅ Automated dashboard with charts and KPI cards
✅ MTD, YTD, and YoY comparison views
✅ 6 structured worksheets (Dashboard, Trend, Actual, Target, PY, Definition)
✅ Color-coded up/down indicators for performance visualization
✅ 100% editable and formula-driven
✅ Cloud-based collaboration through Google Sheets
🧑🏭 Who Can Use This Dashboard
🚧 Construction Firms — Track machinery utilization, cost per hour, and downtime trends.
🏗 Mining Companies — Monitor equipment availability and fuel consumption rates.
🚚 Logistics & Warehousing Teams — Analyze operator efficiency and maintenance cost performance.
🏭 Manufacturing Units — Evaluate preventive maintenance compliance and breakdown frequency.
It’s a must-have tool for operations leaders aiming to enhance efficiency and reduce operational costs across heavy machinery assets.
⚙️ Opportunities for Improvement
You can enhance this dashboard by:
-
🔄 Integrating GPS/telematics data for live equipment tracking.
-
⛽ Adding fuel efficiency KPIs per vehicle type.
-
🧮 Including CO₂ emission estimations for sustainability metrics.
-
📉 Automating maintenance forecasting via Google Apps Script.
-
🚨 Setting email alerts for KPI thresholds or downtime limits.
🧠 Best Practices
✅ Update actuals weekly for better visibility.
✅ Track operator efficiency monthly for performance reviews.
✅ Record breakdown causes to support root-cause analysis.
✅ Separate fixed and variable maintenance costs.
✅ Benchmark metrics against manufacturer or supplier standards.
🌟 Why Choose the Heavy Machinery KPI Dashboard in Google Sheets
-
🚜 End-to-end monitoring of machine performance and costs.
-
📈 Real-time MTD/YTD analytics with visual indicators.
-
🧮 Formula-based automation for error-free reporting.
-
☁️ Cloud collaboration for multi-user access.
-
🧩 Fully customizable to your fleet or department structure.
The Heavy Machinery KPI Dashboard in Google Sheets is a data-powered management tool that helps you optimize machine utilization, minimize downtime, and control costs — driving higher productivity and profitability across your operations.
🔗 Read the detailed blog post
Watch the step-by-step video Demo:


Reviews
There are no reviews yet.