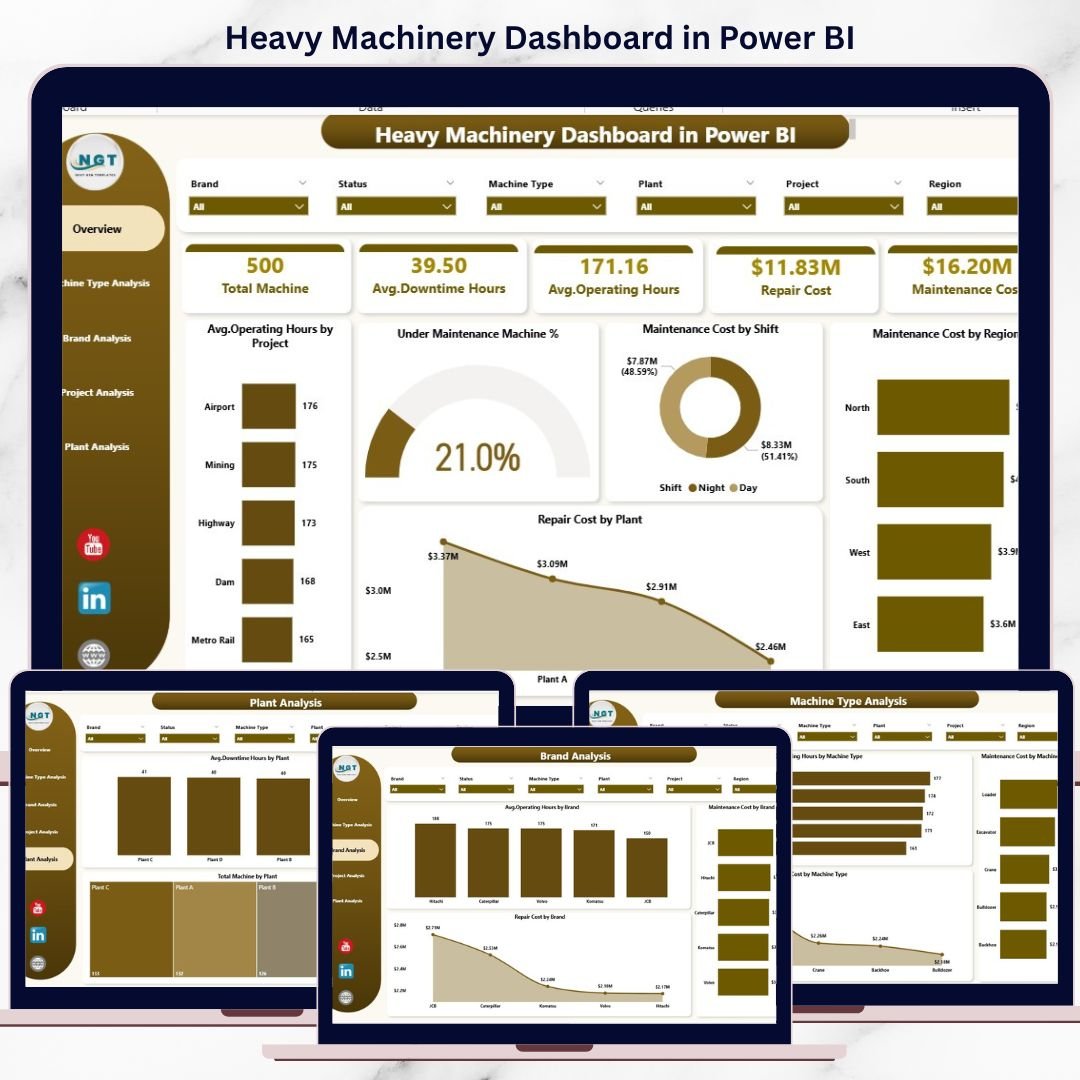
Heavy Machinery Dashboard is the backbone of industries such as construction, mining, manufacturing, infrastructure, and energy. Excavators, cranes, loaders, bulldozers, and similar equipment operate for long hours and require high maintenance investment. However, when machinery data remains scattered across Excel files or manual reports, performance issues stay hidden until costs rise and breakdowns occur.
That is exactly why the Heavy Machinery Dashboard in Power BI becomes a critical operational solution 🚀. This ready-to-use dashboard converts raw machinery data into interactive visuals, KPI cards, and analytical insights. Instead of reacting to failures, operations teams proactively monitor operating hours, downtime, maintenance cost, and repair expenses from one centralized Power BI report.
Designed for organizations that rely heavily on equipment performance, this dashboard helps teams reduce downtime, control maintenance budgets, and improve asset utilization with confidence.
🔑 Key Features of Heavy Machinery Dashboard in Power BI
🚜 5 Dedicated Analytical Pages for complete machinery insights
📊 Interactive KPI Cards & Visuals for instant performance tracking
🎯 Advanced Slicers & Filters by plant, project, brand, region, and machine type
⏱️ Operating Hours & Downtime Analysis for utilization improvement
💰 Maintenance & Repair Cost Tracking for better cost control
🔍 Drill-Down Capabilities for deeper analysis
🔄 Excel / ERP Data Connectivity with scheduled refresh
🧩 Scalable Power BI Model ready for future expansion
This dashboard delivers speed, clarity, and control for heavy equipment operations.
📂 What’s Inside the Heavy Machinery Dashboard
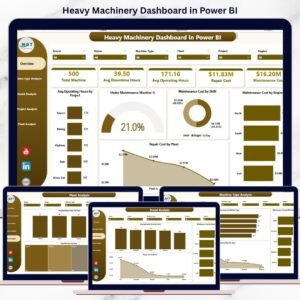
📊 Overview Page
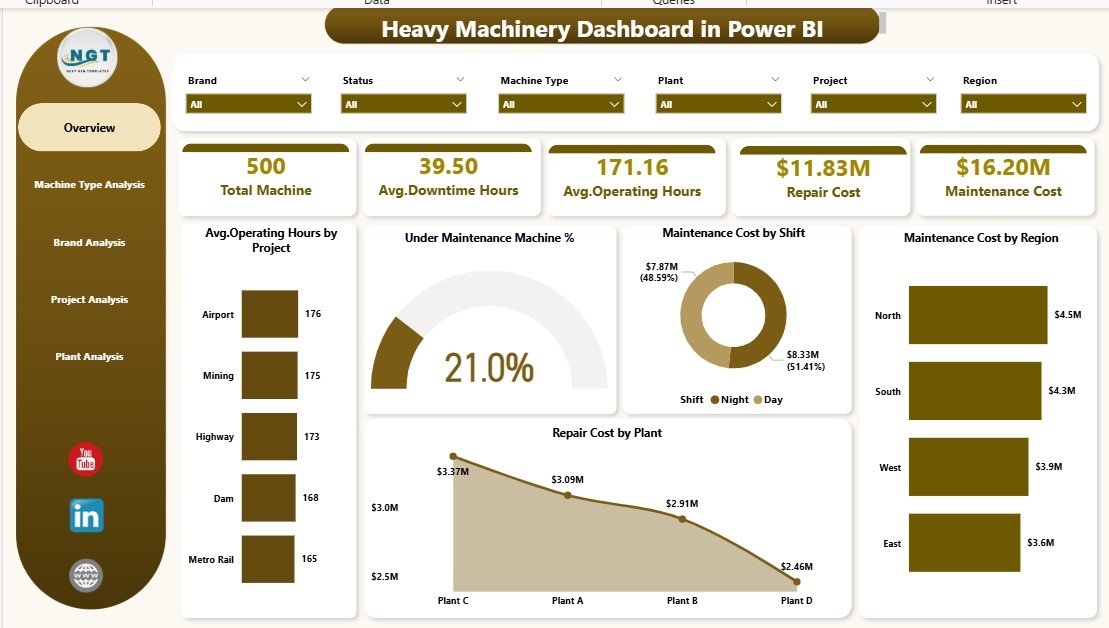
The executive control panel of the dashboard. It provides a quick snapshot of overall machinery performance using:
-
Average Operating Hours by Project
-
Under Maintenance Machine %
-
Maintenance Cost by Shift
-
Maintenance Cost by Region
-
Repair Cost by Plant
This page helps leadership identify risks and cost spikes instantly.
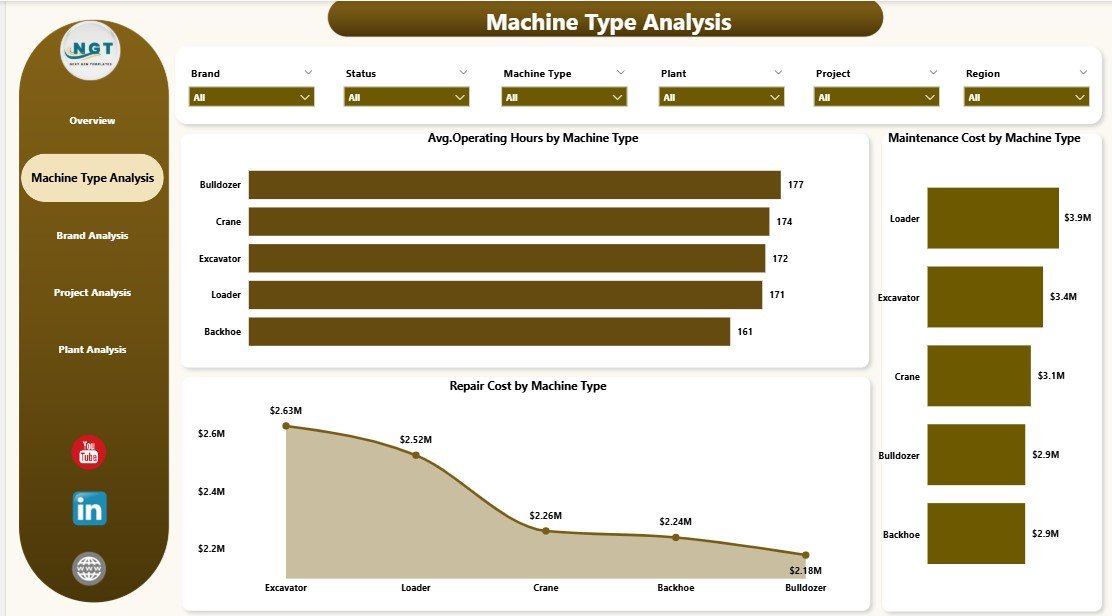
⚙️ Machine Type Analysis Page
Compares performance across machinery categories to analyze:
-
Average operating hours by machine type
-
Maintenance cost by machine type
-
Repair cost by machine type
This insight helps optimize equipment usage and maintenance planning.
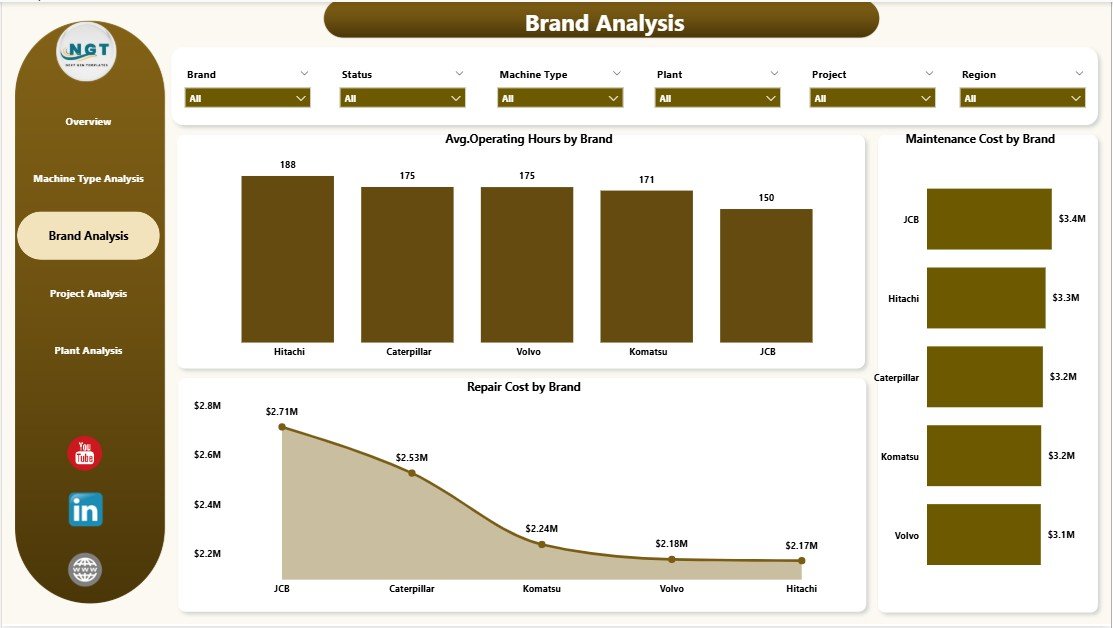
🏷️ Brand Analysis Page
Evaluates machinery performance by brand to support smarter procurement decisions:
-
Average operating hours by brand
-
Maintenance cost by brand
-
Repair cost by brand
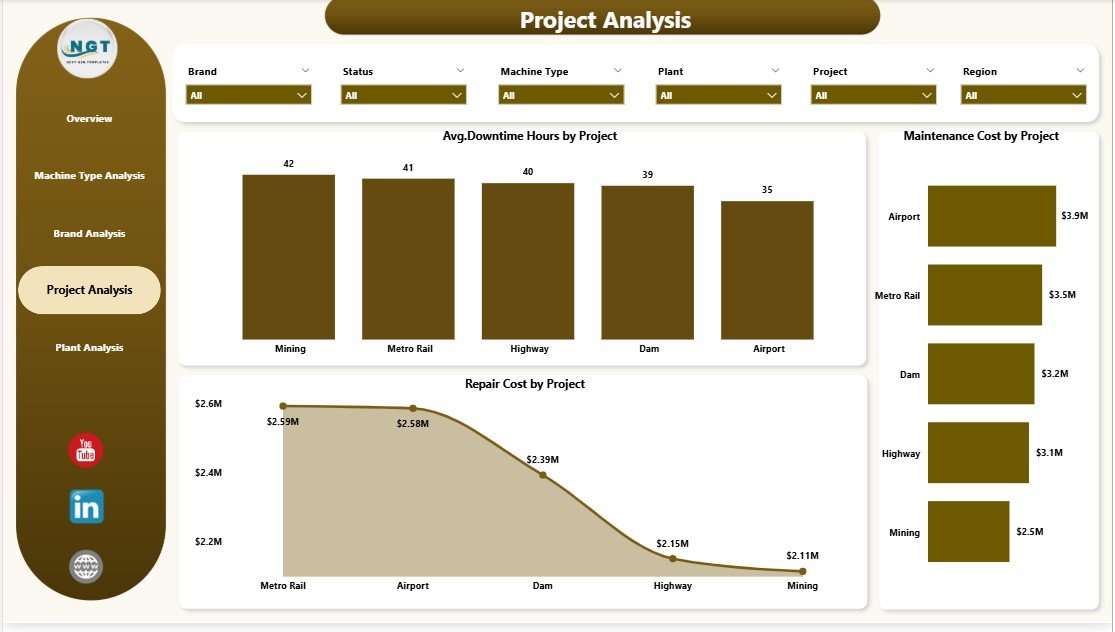
📁 Project Analysis Page
Tracks machinery performance across projects, showing:
-
Average downtime hours by project
-
Maintenance cost by project
-
Repair cost by project
Project managers quickly identify high-risk and high-cost projects.
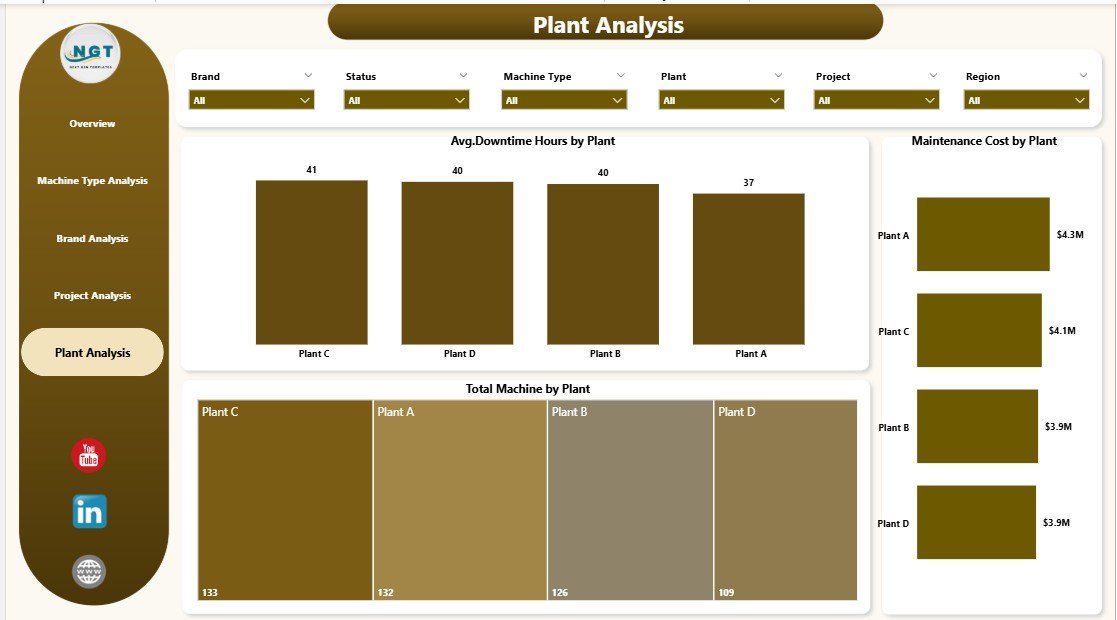
🏭 Plant Analysis Page
Compares plant-level machinery efficiency using:
-
Average downtime hours by plant
-
Maintenance cost by plant
-
Total machines by plant
This page helps operations teams replicate best practices across locations.
🛠️ How to Use the Heavy Machinery Dashboard in Power BI
✅ Connect Excel, ERP, or maintenance system data
✅ Refresh the dataset in Power BI
✅ Use slicers to filter by plant, project, brand, or machine type
✅ Review KPIs and cost trends
✅ Drill into visuals for deeper insights
No advanced Power BI expertise is required. The dashboard is intuitive, structured, and business-ready.
👥 Who Can Benefit from This Heavy Machinery Dashboard?
🏗️ Construction Companies
⛏️ Mining Operations
🏭 Manufacturing Plants
🚧 Infrastructure & Energy Projects
📊 Operations & Maintenance Teams
🧑💼 Project & Plant Managers
If your business depends on heavy equipment performance, this dashboard becomes a powerful decision-support tool.
👉 Click here to read the Detailed blog post
▶️ Visit our YouTube channel to learn step-by-step video tutorials
https://youtube.com/@PKAnExcelExpert


Reviews
There are no reviews yet.