


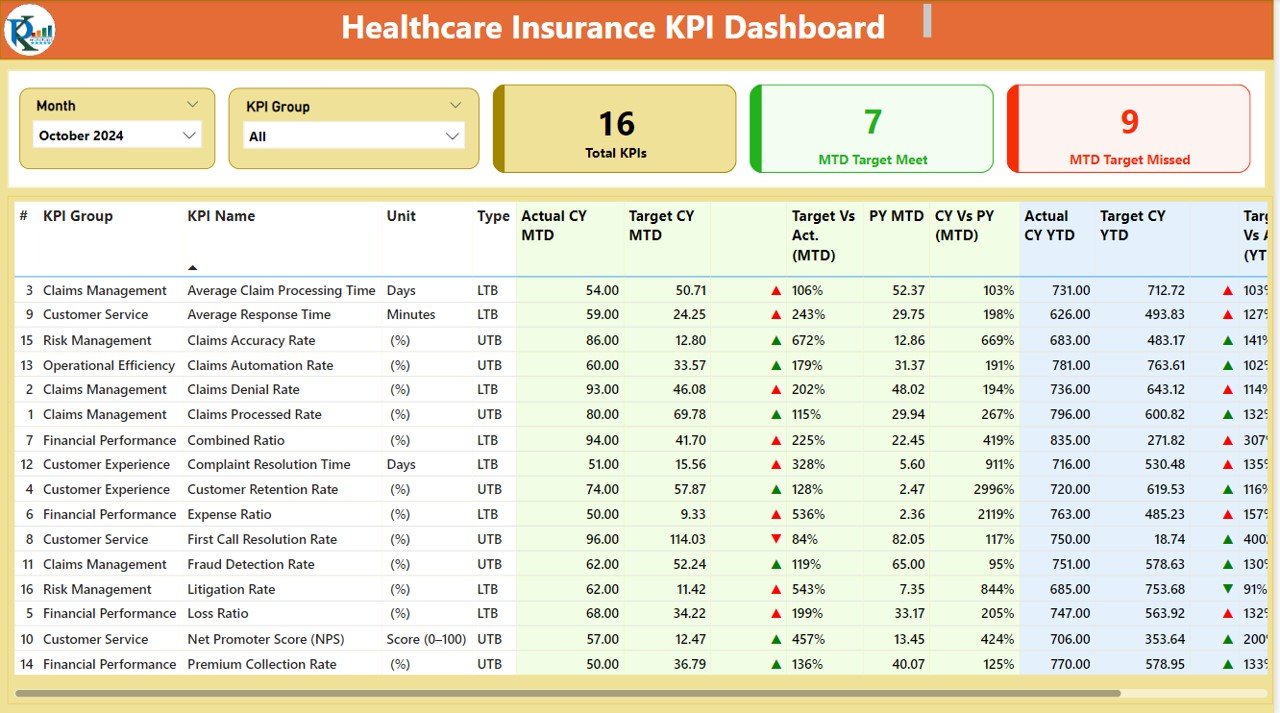
The Healthcare Insurance KPI Dashboard in Power BI is a powerful and dynamic tool designed to help healthcare insurance providers, analysts, and business managers track and analyze key performance indicators (KPIs) related to the insurance sector. This dashboard offers insightful visuals and real-time data to monitor essential metrics such as claim frequency, premium revenue, claims payout ratio, and customer satisfaction, enabling you to make data-driven decisions that optimize operations and enhance business performance.
This Power BI-based dashboard integrates data from multiple sources to provide a comprehensive overview of your insurance business. With its visually rich interface, you can assess your portfolio’s performance, identify trends, and uncover areas of improvement to drive growth and improve customer retention.
Key Features of the Healthcare Insurance KPI Dashboard in Power BI
📊 Comprehensive KPI Tracking
Track key metrics such as claim frequency, claims settlement, premium revenue, and customer satisfaction. Monitor each metric in real time to gain an accurate understanding of your business performance.
📈 Claims Payout Ratio Analysis
Analyze the claims payout ratio to assess your company’s ability to manage claim expenses relative to premiums earned. This KPI helps in managing profitability and operational efficiency.
💡 Customer Satisfaction Insights
Measure customer satisfaction through metrics such as Net Promoter Score (NPS), customer feedback, and retention rates. Use this data to enhance customer service and improve the overall customer experience.
📅 Time-Based Performance Analysis
Monitor your KPIs over different time periods—daily, weekly, monthly, and yearly. Use historical data to identify trends and make strategic decisions that drive long-term growth.
⚙️ Customizable & Scalable Dashboard
Tailor the dashboard to meet your specific business needs. Add custom KPIs, adjust data sources, and modify visuals to reflect your insurance business’s goals and objectives.
🔑 Real-Time Data Integration
Integrate data from various sources, including claims systems, customer databases, and premium records, to get real-time insights. Make decisions based on the most up-to-date and accurate data available.
Why You’ll Love the Healthcare Insurance KPI Dashboard in Power BI
✅ Comprehensive Insights at Your Fingertips
Access all critical insurance performance metrics in one place. From claim ratios to customer satisfaction, track everything in real time to stay ahead of market trends.
✅ Boost Operational Efficiency
Monitor claims, premiums, and customer satisfaction to identify operational inefficiencies and optimize workflows. Reduce operational costs by addressing bottlenecks and improving processing time.
✅ Improve Profitability & Risk Management
Analyze claim ratios and premium revenue to manage profitability effectively. Make data-driven decisions that optimize risk management and ensure financial sustainability.
✅ Enhance Customer Retention & Service
Track customer satisfaction metrics to assess and improve service quality. Use customer feedback to refine your offerings and boost retention rates.
✅ Data-Driven Decision Making
Leverage real-time insights from the dashboard to make informed decisions that drive business growth, improve operational efficiency, and enhance customer loyalty.
What’s Inside the Healthcare Insurance KPI Dashboard in Power BI?
- Comprehensive KPI Tracking: Monitor critical insurance performance metrics like claims and premiums.
- Claims Payout Ratio Analysis: Track the ratio of claims paid to premiums collected.
- Customer Satisfaction Metrics: Measure NPS, feedback, and retention rates.
- Time-Based KPI Performance: Monitor KPIs over different time periods for trend analysis.
- Real-Time Data Integration: Get updated data from various systems for accurate performance analysis.
- Customizable Features: Tailor the dashboard to fit your specific insurance business needs.
How to Use the Healthcare Insurance KPI Dashboard in Power BI
1️⃣ Download the Template: Access the Healthcare Insurance KPI Dashboard in Power BI instantly.
2️⃣ Integrate Your Data Sources: Link your data sources, including claims, premiums, and customer data, to the dashboard.
3️⃣ Track KPIs & Performance: Monitor key metrics such as claims frequency, premiums, and customer satisfaction.
4️⃣ Analyze Trends & Patterns: Use time-based analysis to track the progress of your KPIs and identify areas for improvement.
5️⃣ Optimize Your Insurance Business: Use the insights from the dashboard to drive operational efficiency, increase profitability, and improve customer satisfaction.
Who Can Benefit from the Healthcare Insurance KPI Dashboard in Power BI?
🔹 Healthcare Insurance Providers & Companies
🔹 Insurance Analysts & Data Analysts
🔹 Claims Managers & Adjusters
🔹 Customer Service & Retention Teams
🔹 Risk & Compliance Managers
🔹 Healthcare Business Owners & Executives
🔹 Large Enterprises with Healthcare Insurance Portfolios
Optimize your healthcare insurance business with the Healthcare Insurance KPI Dashboard in Power BI. Track essential KPIs, improve claim management, increase profitability, and enhance customer retention—all in one place.
Click here to read the Detailed blog post
Visit our YouTube channel to learn step-by-step video tutorials
Youtube.com/@PKAnExcelExpert


Reviews
There are no reviews yet.