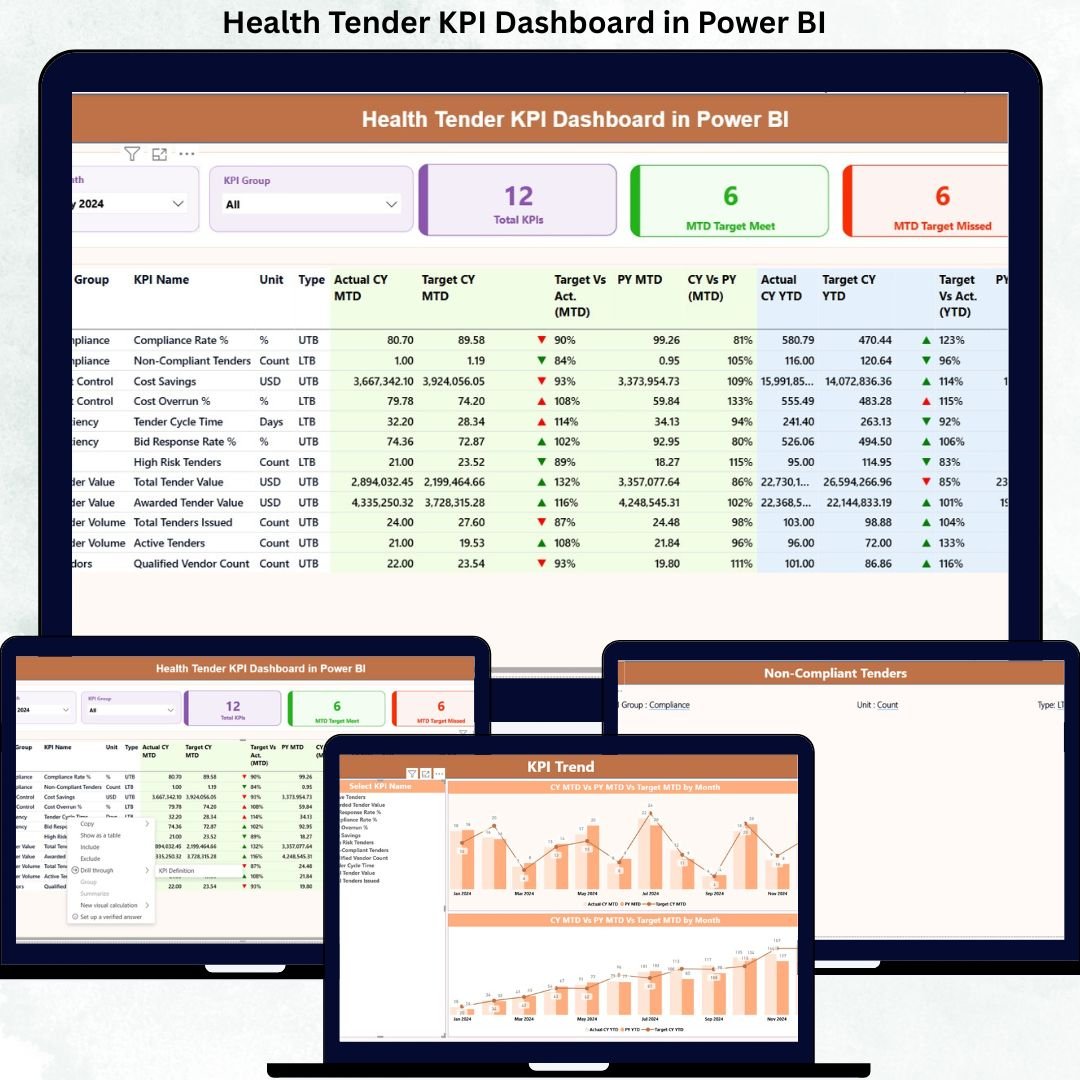
Managing health tenders involves strict compliance, performance evaluation, and continuous monitoring. However, handling tender data manually through spreadsheets and reports often leads to errors, delays, and lack of clarity. That is exactly where the Health Tender KPI Dashboard in Power BI becomes an essential tool for healthcare organizations.
This powerful and ready-to-use dashboard helps healthcare professionals track tender performance, monitor KPIs, analyze trends, and make informed decisions with ease. Built using Power BI and Excel, this dashboard converts complex tender data into clear, interactive, and visually appealing reports.
Whether you manage hospital tenders, healthcare procurement, or compliance reporting, this dashboard provides a structured and reliable way to monitor performance efficiently.
🔹 Key Features of Health Tender KPI Dashboard
✅ Interactive Power BI Dashboard – Designed with user-friendly visuals for quick insights
✅ Excel-Based Data Input – Easily update data without technical complexity
✅ MTD & YTD Performance Tracking – Monitor monthly and yearly performance
✅ Target vs Actual Comparison – Instantly identify gaps and improvements
✅ Automated Status Indicators – Green and red arrows show performance health
✅ Dynamic Slicers – Filter data by month and KPI group
✅ Trend Analysis Charts – Identify performance patterns over time
✅ Professional Layout – Management-ready reporting structure
This dashboard ensures clarity, accuracy, and consistency across all tender-related KPIs.
🔹 What’s Inside the Health Tender KPI Dashboard
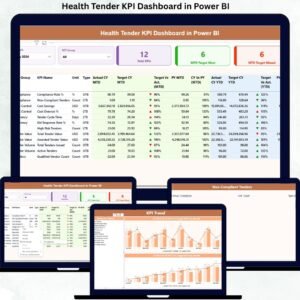
The dashboard consists of three powerful analytical pages, each designed for a specific purpose.
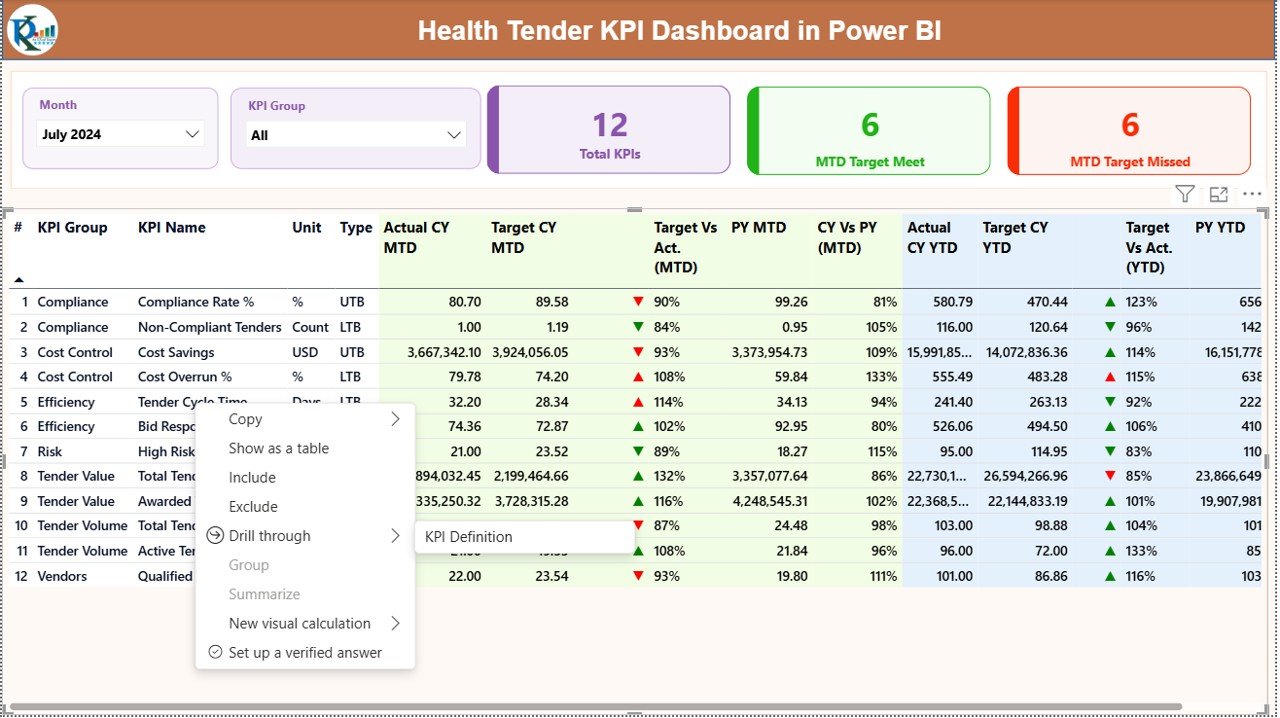
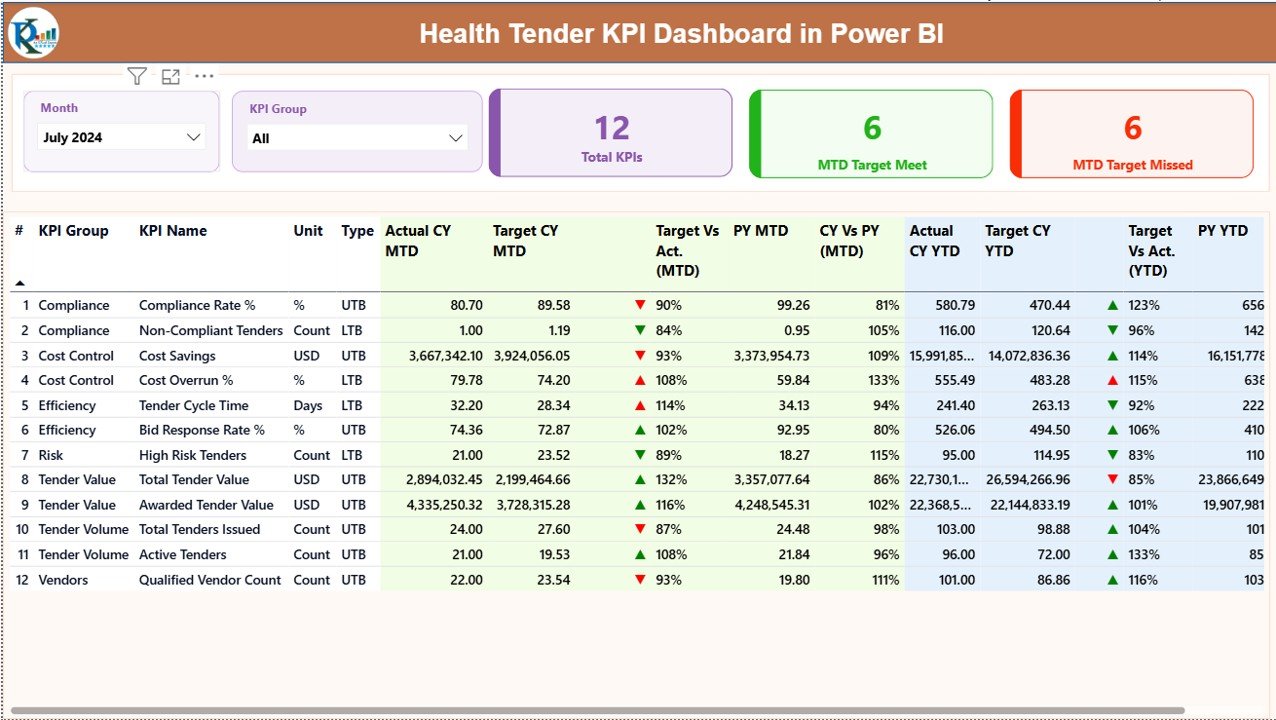
📊 1. Summary Page
This is the main dashboard view that provides a complete performance overview.
It includes:
-
Month and KPI Group slicers
-
Total KPI count
-
MTD Target Met count
-
MTD Target Missed count
A detailed KPI table displays:
-
KPI Number
-
KPI Group
-
KPI Name
-
Unit
-
KPI Type (LTB / UTB)
-
Actual CY MTD
-
Target CY MTD
-
MTD Status Indicator
-
CY vs PY (MTD)
-
Actual & Target YTD
-
YTD Status Indicator
This page gives instant visibility into tender performance.
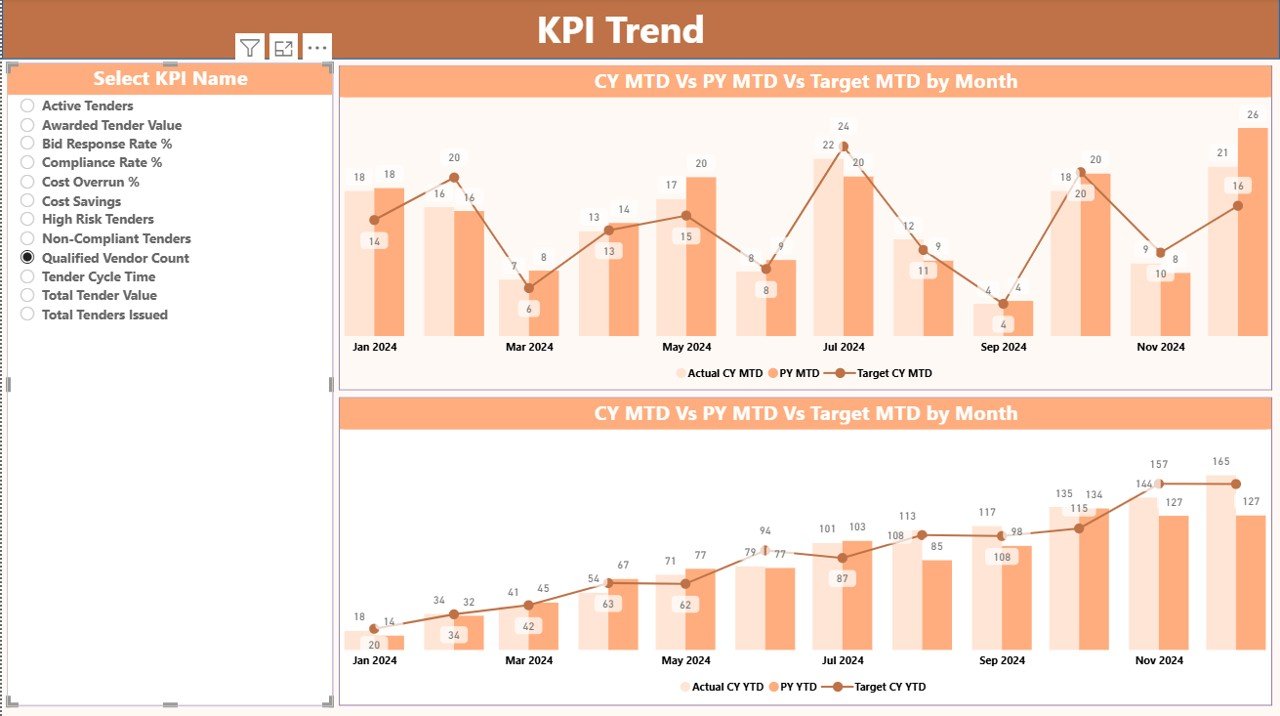
📈 2. KPI Trend Page
This page focuses on performance trends.
It includes:
-
Combo charts for trend analysis
-
Current Year vs Previous Year comparison
-
Target vs Actual visualization
-
KPI selection slicer
This helps users identify growth patterns, risks, and improvement areas.
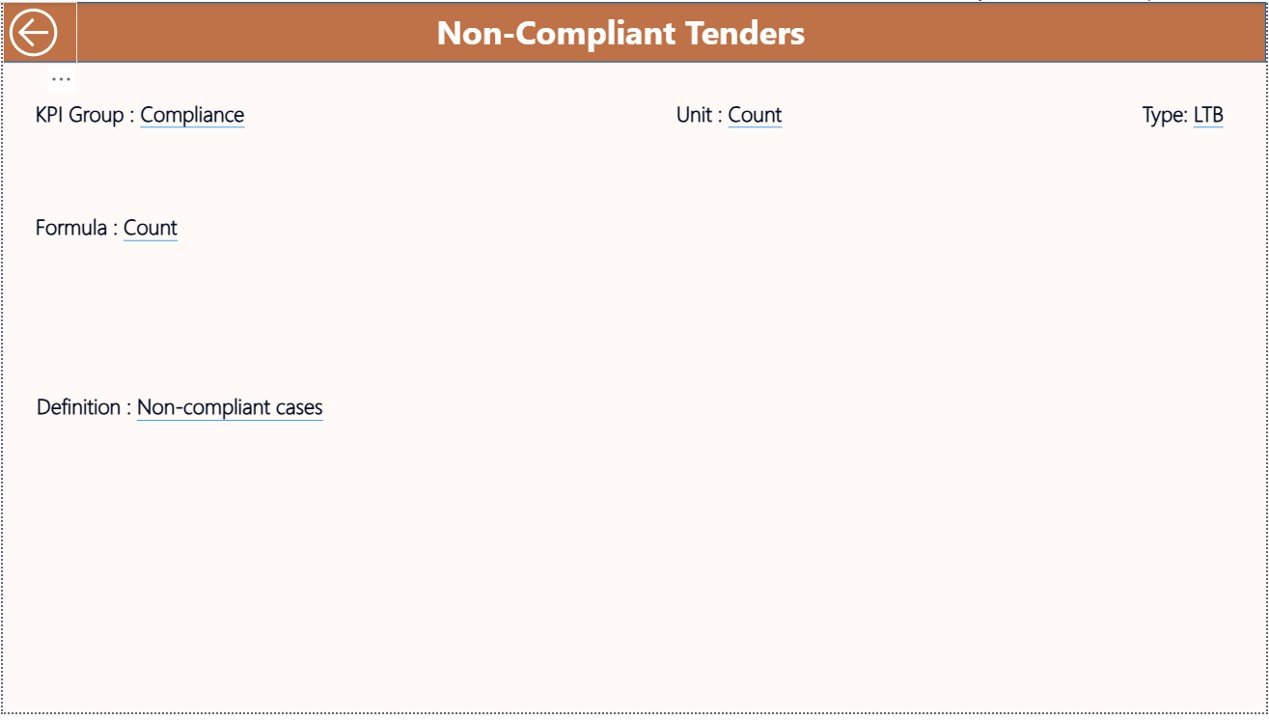
📘 3. KPI Definition Page
This page explains each KPI in detail.
It includes:
-
KPI Name
-
KPI Formula
-
KPI Definition
-
KPI Type (LTB or UTB)
Users can easily understand what each KPI represents and how it is calculated.
🔹 How to Use the Health Tender KPI Dashboard
1️⃣ Enter actual data in the Input_Actual Excel sheet
2️⃣ Update targets in the Input_Target sheet
3️⃣ Define KPIs in the KPI Definition sheet
4️⃣ Refresh Power BI
5️⃣ Analyze KPIs using interactive visuals
No coding or advanced Power BI knowledge is required.
🔹 Who Can Benefit from This Product
✔ Healthcare Administrators
✔ Tender & Procurement Teams
✔ Hospital Management
✔ Finance Departments
✔ Compliance Officers
✔ Healthcare Consultants
✔ Decision Makers
This dashboard is ideal for organizations managing multiple health tenders and compliance requirements.
🔹 Why Choose This Health Tender KPI Dashboard?
✔ Saves time and manual effort
✔ Improves decision-making accuracy
✔ Enhances transparency
✔ Easy to use and maintain
✔ Fully customizable
✔ Scalable for future needs
This dashboard transforms raw tender data into meaningful insights that drive better performance.
Click here to read the Detailed Blog Post
Watch the step-by-step video tutorial:


Reviews
There are no reviews yet.