


The Health Tech Dashboard in Power BI is a powerful, ready-to-use analytical solution designed to revolutionize healthcare data management. In an era where hospitals, clinics, and health startups generate massive amounts of data daily — from patient appointments to doctor performance — this dashboard transforms raw numbers into clear, actionable insights.
By combining Power BI’s advanced visualization capabilities with structured Excel data sources, this dashboard empowers healthcare professionals to make smarter, data-driven decisions — improving efficiency, patient care, and profitability.
Whether you’re tracking patient satisfaction, appointment flow, or departmental performance, the Health Tech Dashboard delivers everything you need to manage your healthcare operations effectively.
✨ Key Features of the Health Tech Dashboard in Power BI
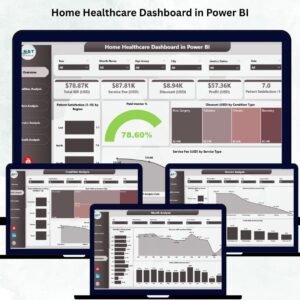
✅ 📊 Overview Page – Complete Performance Snapshot

Gain instant access to critical healthcare KPIs at a glance.
Includes:
-
Total Appointments
-
Cancelled Appointment %
-
Pending Appointment %
-
App Login Count by Doctor
-
Satisfaction Score by Department
Visual Charts:
-
Cancelled Appointment %
-
Pending Appointment % by Appointment Type
-
App Login Count by Doctor
-
Satisfaction Score by Department
💡 Ideal for administrators who want a real-time snapshot of overall hospital or clinic performance.
✅ 🏥 Department Analysis Page – Evaluate Departmental Efficiency
This page dives into department-wise analytics, helping identify high and low performers.
Visuals include:
-
Total Appointments by Department
-
Average Wait Time (mins) by Department
-
Cancelled Appointment % by Department
📈 Uncover inefficiencies, optimize staff allocation, and improve patient experience.
✅ 🌍 Location Analysis Page – Regional Insights at a Glance
Perfect for healthcare networks operating across multiple locations.
Charts include:
-
Satisfaction Score by Location
-
Average Wait Time (mins) by Location
-
Pending Appointment % by Location
🏙 Easily compare performance across hospitals, branches, or cities.
✅ 👨⚕️ Doctor Analysis Page – Monitor Doctor Productivity
Track how each doctor contributes to patient satisfaction and overall outcomes.
Visuals include:
-
Amount (USD) by Transaction Channel
-
Failed Transactions by Channel
-
Transaction Duration (Sec) by Channel
-
Satisfaction Score by Doctor
-
Total & Completed Appointments by Doctor
🩺 Ensure balanced workloads and identify top-performing doctors.
✅ 📅 Monthly Trends Page – Track Progress Over Time
Observe how patient and operational metrics evolve each month.
Charts include:
-
Satisfaction Score by Month
-
Total Appointments by Month
-
Completed Appointments by Month
📆 Spot patterns, seasonal peaks, or declines to forecast future demand.
📦 What’s Inside the Dashboard
💻 Power BI (.PBIX) File – Fully interactive with slicers, drill-throughs, and cards.
📊 Excel Data Source – Structured datasets for appointments, transactions, and feedback.
⚙️ Automated Data Refresh – Update your Excel file and Power BI syncs visuals automatically.
💡 No coding required — just plug in your data and start analyzing immediately!
👥 Who Can Benefit from This Dashboard
🏥 Hospitals & Clinics – Manage patient flow and operational performance.
💊 Pharmaceutical Companies – Track engagement and transaction analytics.
🩺 Telemedicine Platforms – Monitor virtual consultations and patient feedback.
🧪 Diagnostic Centers – Analyze wait times and satisfaction scores.
💼 Healthcare Startups – Gain insights into user behavior and growth metrics.
This dashboard is designed for healthcare administrators, data analysts, doctors, and executives who value data-driven decision-making.
💡 Advantages of the Health Tech Dashboard in Power BI
✅ Centralized Healthcare Insights – Connects appointments, satisfaction, and performance data in one unified view.
✅ Real-Time Monitoring – Always access up-to-date data with automated refreshes.
✅ Enhanced Decision-Making – Visual storytelling enables faster strategic choices.
✅ Improved Patient Care – Track wait times and satisfaction to improve outcomes.
✅ Scalable and Secure – Built with Microsoft’s trusted Power BI environment.
✅ Customizable and Flexible – Add KPIs or adjust visuals to fit your unique healthcare needs.
⚡ Empower your healthcare organization with real-time visibility and smarter analytics.
🧠 Best Practices for Using the Dashboard
✔️ Define clear KPIs before implementation.
✔️ Maintain accurate and clean Excel data sources.
✔️ Automate refresh schedules for live insights.
✔️ Keep visuals clean — focus on actionable metrics.
✔️ Apply role-based permissions for secure access.
✔️ Review and optimize KPIs regularly.
Following these practices ensures that your Health Tech Dashboard remains reliable, insightful, and easy to manage.
🔗 Click here to read the Detailed Blog Post
🎥 Visit our YouTube channel to learn step-by-step video


Reviews
There are no reviews yet.