🔑 Key Features of Gym Fitness Business Dashboard in Power BI
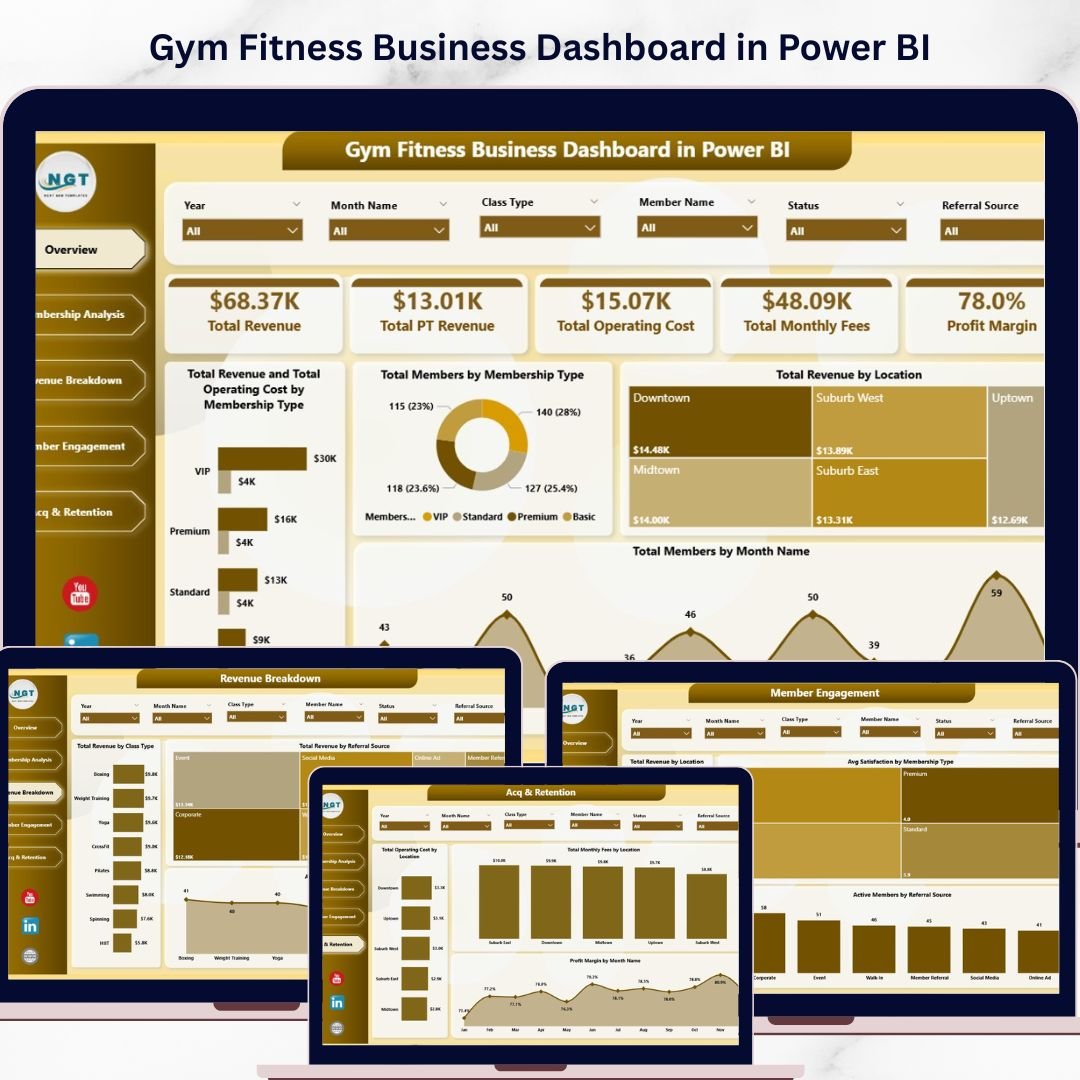
Gym Fitness Business Dashboard in Power BI is a professionally designed, interactive analytics template built for gym owners, fitness studio managers, health club operators, and personal training business owners who want to monitor every critical aspect of their fitness business from a single, powerful dashboard. This template includes 5 interactive analysis pages covering Overview, Membership Analysis, Revenue Breakdown, Member Engagement, and Acquisition & Retention — making it one of the most comprehensive Power BI Dashboard Templates available for gym and fitness business management.
Whether you manage a single-location gym or a multi-branch fitness chain, this Power BI dashboard template helps you make data-driven decisions quickly. The dashboard tracks 5 high-level KPIs including Total Revenue, Total PT Revenue, Total Operating Cost, Total Monthly Fees, and Profit Margin — giving you a 360-degree view of your gym’s financial and operational health. Explore related fitness templates like the Gym Fitness Business Dashboard in Excel and the Fitness Studios Dashboard in Power BI for complementary fitness analytics tools.
📦 What’s Inside the Gym Fitness Business Dashboard in Power BI
This template includes 5 dedicated dashboard pages, each designed to deliver deep insights into your gym and fitness business operations:
📊 Overview Page — The main dashboard displays 5 high-level KPI cards: Total Revenue, Total PT Revenue, Total Operating Cost, Total Monthly Fees, and Profit Margin. Below the cards, 4 interactive charts provide instant analysis: Total Revenue and Total Operating Cost by Membership Type helps you compare income against expenses across different membership tiers, Total Members by Membership Type shows the distribution of your member base, Total Revenue by Location breaks down earnings across your gym branches, and Total Members by Month Name reveals membership enrollment trends over time. Multiple slicers let you filter the entire dashboard by various dimensions quickly.
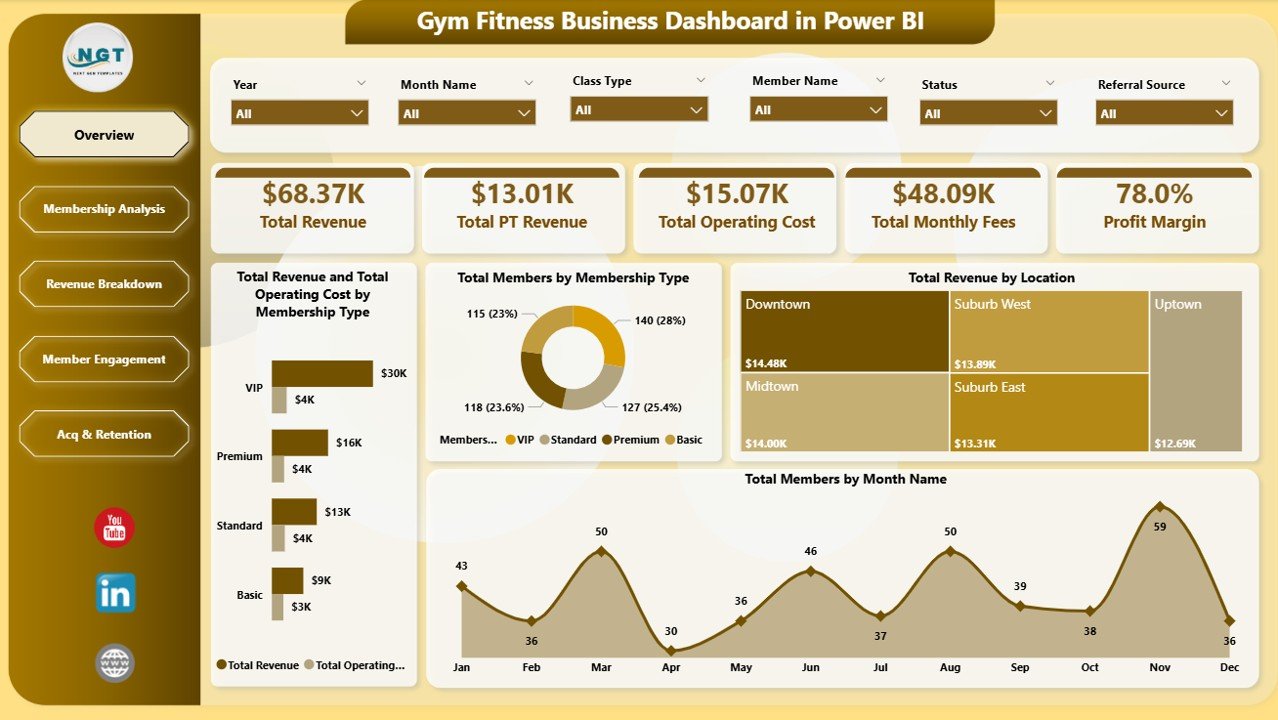 Gym Fitness Business Dashboard in Power BI
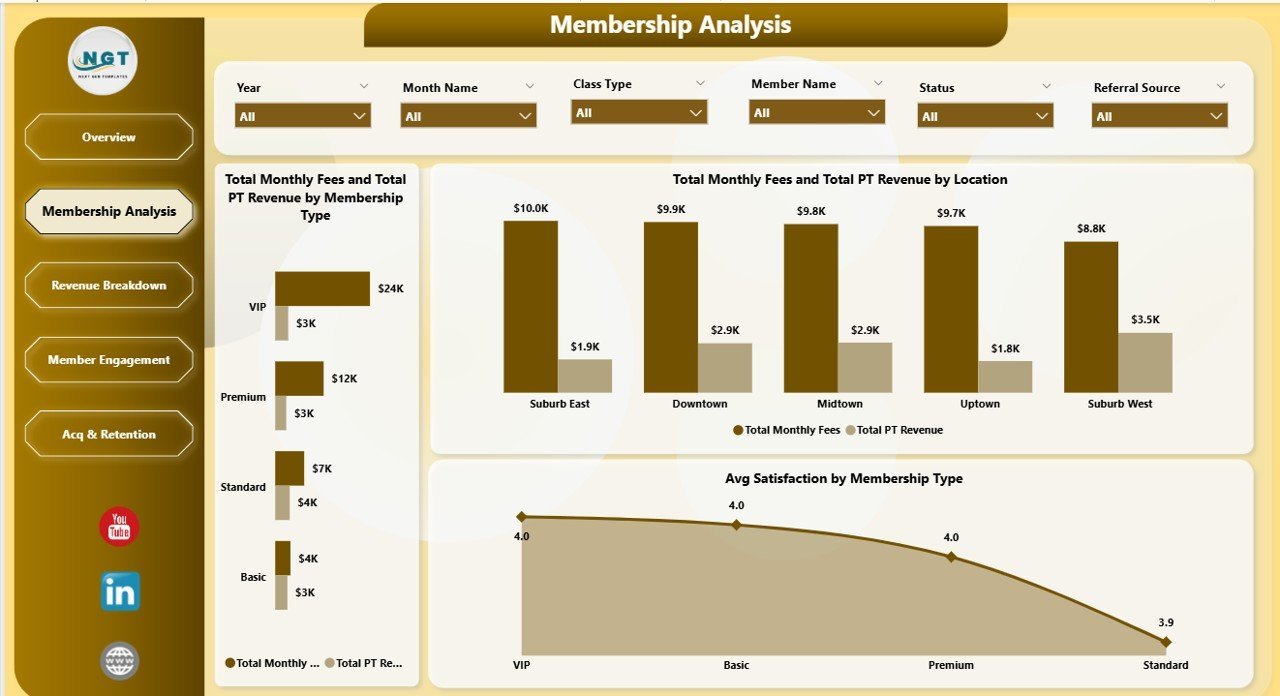
📈 Membership Analysis — This page provides detailed membership insights through 3 powerful charts: Total Monthly Fees and Total PT Revenue by Membership Type compares recurring fees against personal training income across membership categories, Total Monthly Fees and Total PT Revenue by Location breaks down these revenue streams by gym branch, and Avg Satisfaction by Membership Type reveals which membership tiers have the happiest members.
 Membership Analysis
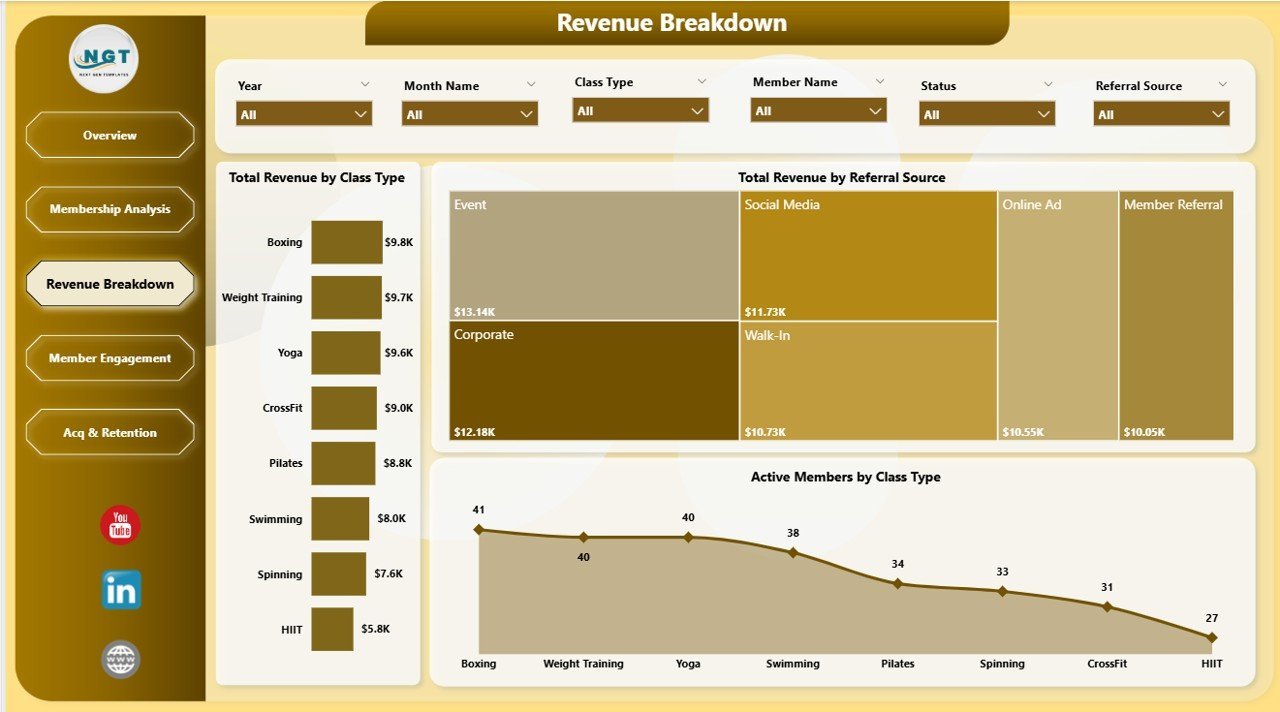
💰 Revenue Breakdown — Analyze your revenue streams in depth with 3 insightful charts: Total Revenue by Class Type shows which fitness classes generate the most income, Total Revenue by Referral Source reveals which marketing channels bring in the highest-paying members, and Active Members by Class Type helps you understand class popularity and capacity utilization.
 Revenue Breakdown
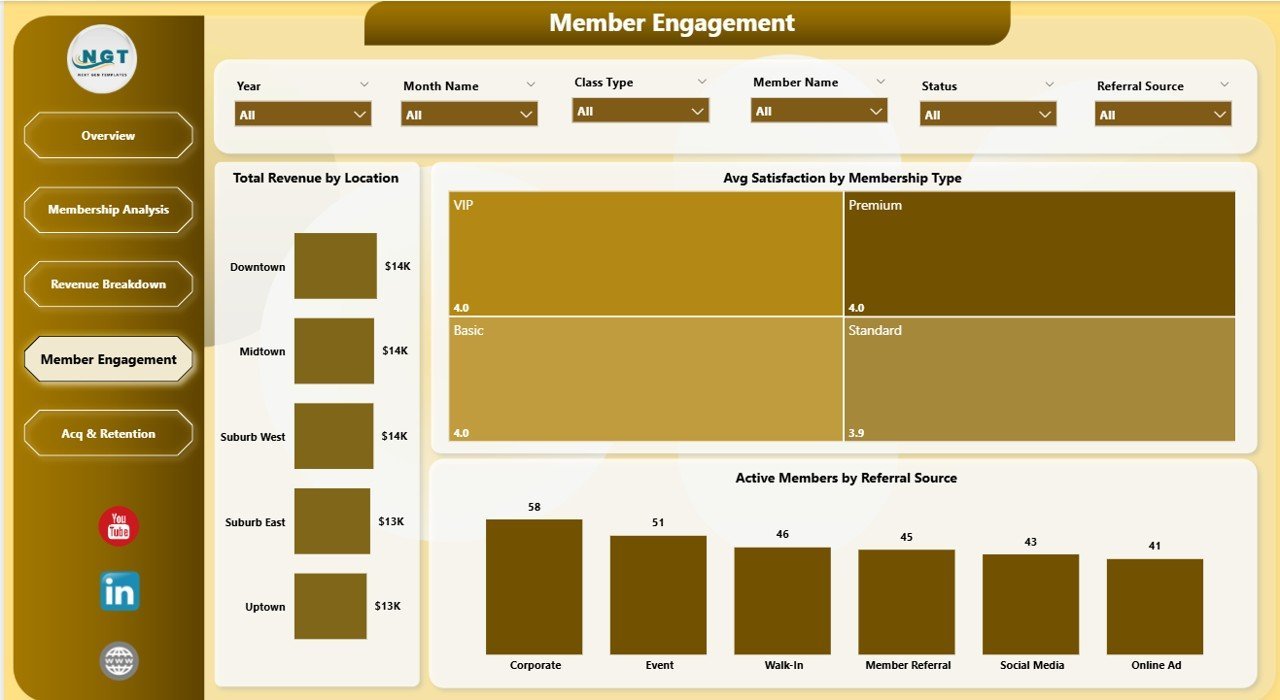
🏋️ Member Engagement — Track member satisfaction and engagement with 3 targeted charts: Total Revenue by Location compares earnings across different gym locations, Avg Satisfaction by Membership Type measures member happiness across different membership levels, and Active Members by Referral Source shows which acquisition channels bring the most engaged members.
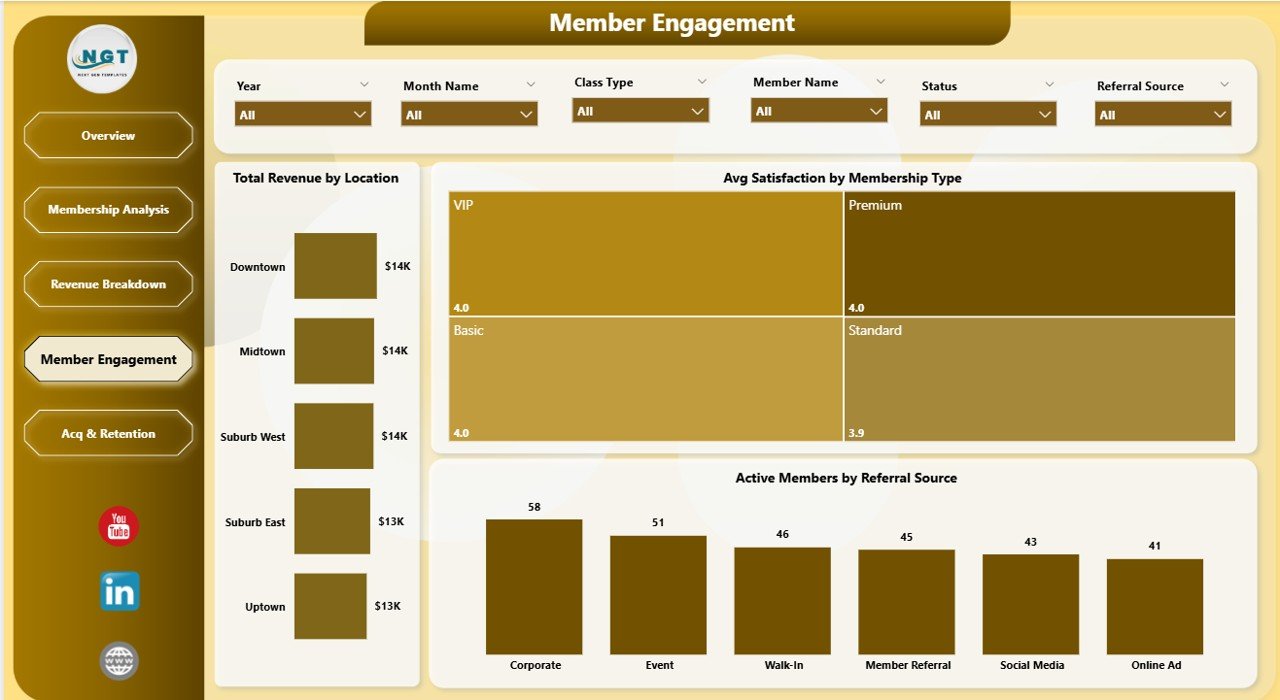 Member Engagement
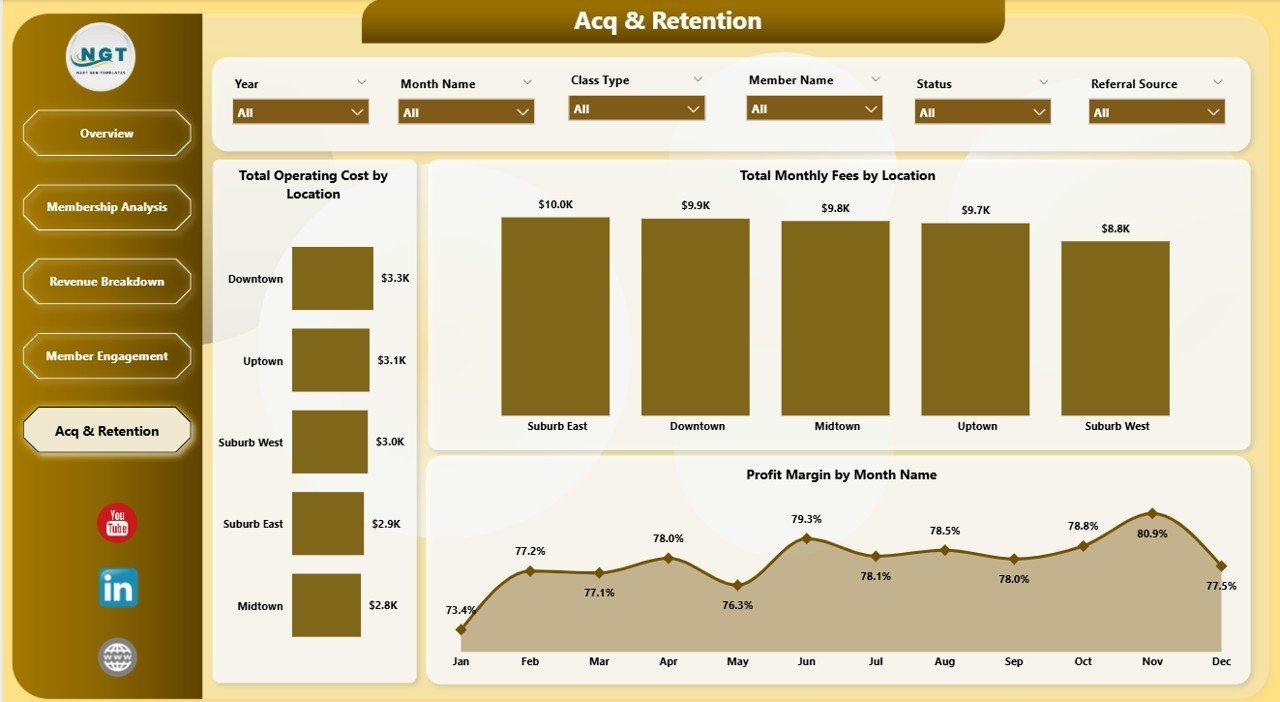
📉 Acquisition & Retention — Evaluate your costs and profitability with 3 key charts: Total Operating Cost by Location helps identify which branches cost the most to operate, Total Monthly Fees by Location shows recurring revenue by branch, and Profit Margin by Month Name tracks your profitability trend over time to spot seasonal patterns.
 Acquisition & Retention
⚙️ How to Use the Gym Fitness Business Dashboard in Power BI
1️⃣ Download and unzip the file on your computer.
2️⃣ Open the .pbix file in Power BI Desktop (free download from Microsoft).
3️⃣ Replace the sample data with your actual gym business data by connecting your own data source.
4️⃣ Refresh the data to see all 5 dashboard pages update automatically with your real numbers.
5️⃣ Navigate through Overview, Membership Analysis, Revenue Breakdown, Member Engagement, and Acquisition & Retention pages to explore your gym’s performance insights.
👥 Who Can Benefit from This Gym Fitness Business Dashboard
🔹 Gym Owners — Monitor total revenue, operating costs, and profit margins across all locations
🔹 Fitness Studio Managers — Track membership trends, class popularity, and member satisfaction
🔹 Health Club Operators — Analyze multi-location performance and acquisition channels
🔹 Personal Training Business Owners — Track PT revenue alongside membership fees
🔹 Fitness Franchise Managers — Compare branch performance and identify top-performing locations
🔹 Business Analysts in Fitness Industry — Comprehensive analytics toolkit for fitness business reporting
❓ Frequently Asked Questions
What KPIs does the Gym Fitness Business Dashboard in Power BI track?
The Gym Fitness Business Dashboard in Power BI tracks 5 key performance indicators: Total Revenue, Total PT Revenue, Total Operating Cost, Total Monthly Fees, and Profit Margin. It also provides in-depth analysis across membership types, locations, class types, referral sources, and monthly trends through 16 interactive charts spread across 5 dashboard pages.
Do I need advanced Power BI skills to use this gym dashboard?
No. Simply open the .pbix file in Power BI Desktop, replace the sample data with your own gym data, and refresh. All charts, KPI cards, and visuals update automatically. No DAX coding or complex setup required.
Can I customize this dashboard for my specific gym business?
Yes. The dashboard is designed to work with any gym or fitness business data. You can modify membership types, locations, class types, and referral sources in your data source, and the dashboard will adapt dynamically to reflect your unique business structure.
What is the best Power BI template for gym and fitness business analytics?
The Gym Fitness Business Dashboard in Power BI is one of the best templates for gym analytics. It covers 5 critical areas — overview, membership analysis, revenue breakdown, member engagement, and acquisition and retention — giving gym owners and managers a complete operational picture in one interactive file.
How does this dashboard help track gym membership trends?
The Membership Analysis page shows Total Monthly Fees and Total PT Revenue broken down by Membership Type and by Location. The Overview page tracks Total Members by Month Name to reveal enrollment patterns. Together, these charts give you complete visibility into how your membership base is growing and generating revenue.
🔗 Explore Related Templates
🔹 Gym Fitness Business Dashboard in Excel — The Excel version of this gym dashboard with pivot tables, slicers, and automated charts for Microsoft Excel users.
🔹 Fitness Studios Dashboard in Power BI — Track fitness studio KPIs including class attendance, instructor performance, and revenue analytics.
🔹 CrossFit Gym KPI Scorecard in Excel — Monitor CrossFit-specific KPIs with MTD, YTD, and target comparisons.
📖 Click here to read the Detailed Blog Post about Gym Fitness Business Dashboard in Power BI
🎥 Visit our YouTube channel to learn step-by-step video tutorials
👉 YouTube.com/@NextGenTemplates


Reviews
There are no reviews yet.