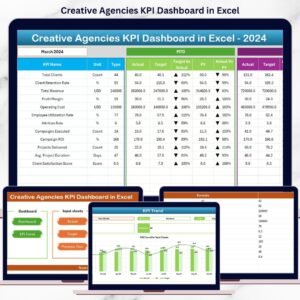
In the creative world, visuals speak louder than words — but data tells the story of performance. The Graphic Design KPI Dashboard in Excel is your all-in-one performance management tool that transforms design operations into measurable success. 🎨📊 Whether you’re running a creative agency, managing an in-house design team, or freelancing, this Excel-based dashboard helps you monitor, analyze, and improve every aspect of your design workflow.
Built with clarity and automation in mind, this ready-to-use Excel template tracks crucial KPIs such as project completion rate, client satisfaction, revision ratio, turnaround time, and budget utilization — giving you instant insights into your team’s creative efficiency.
✨ Key Features of Graphic Design KPI Dashboard in Excel
🎯 All-in-One Performance View – Get a complete overview of your design team’s performance with dynamic charts, slicers, and KPI cards.
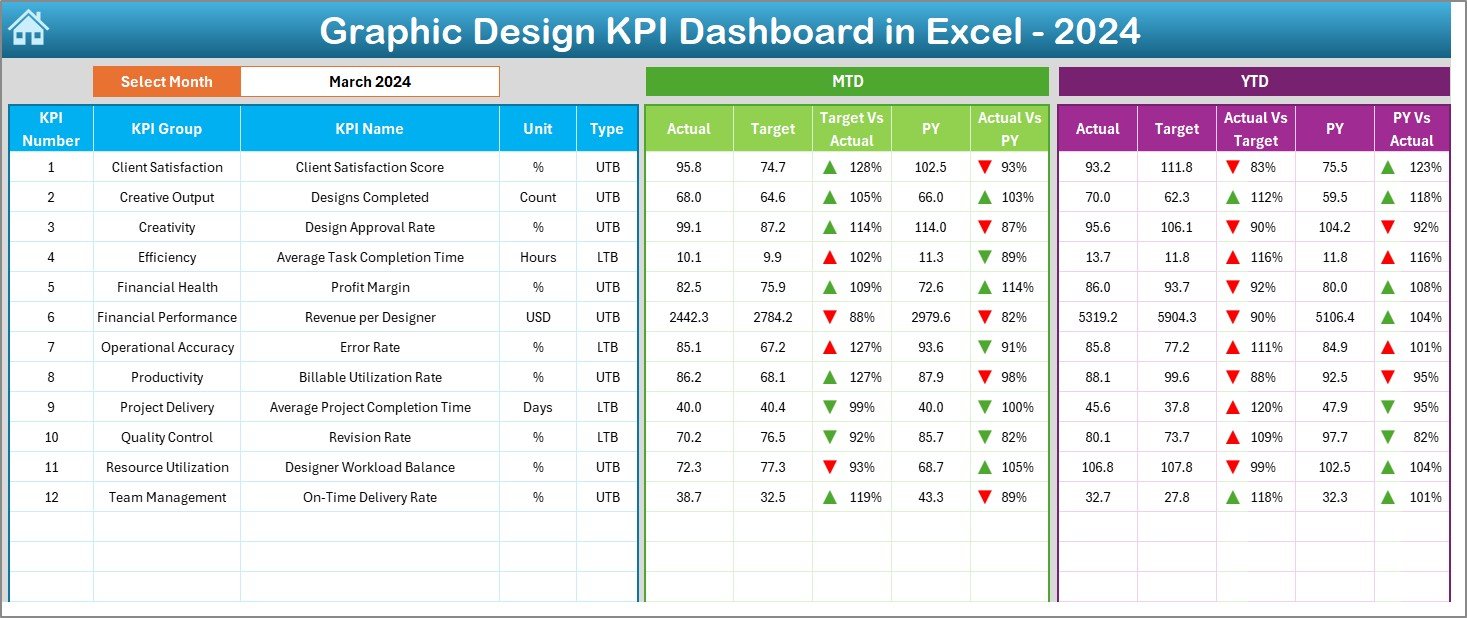
📅 Month & Year Selectors – Analyze results Month-to-Date (MTD) or Year-to-Date (YTD) with simple dropdowns.
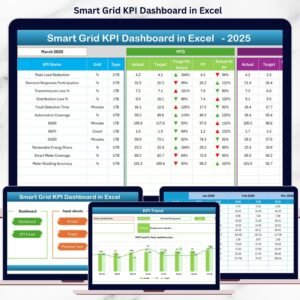
📊 Real-Time Data Visualization – Instantly compare Actual vs Target vs Previous Year performance with color-coded indicators.
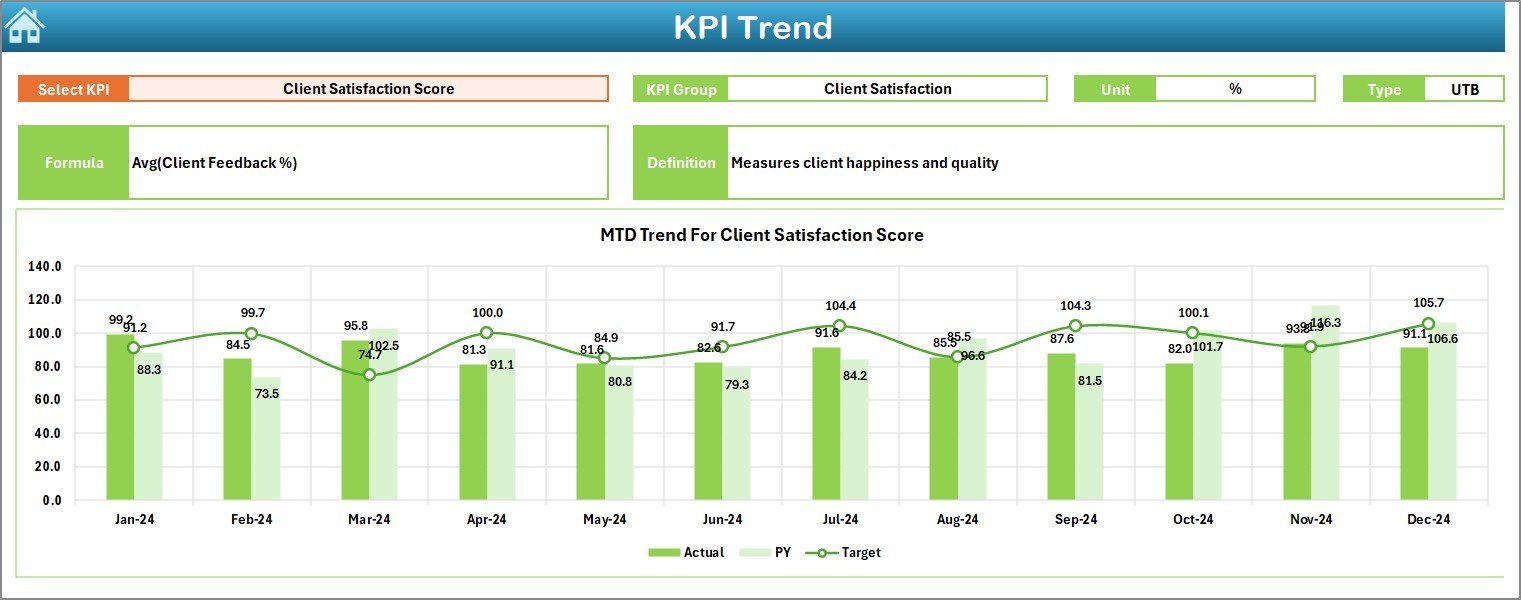
📈 Trend Analysis Sheet – Track performance movement across months and identify patterns in key metrics.
⚙️ Fully Editable Excel File – Modify KPI formulas, data, and visuals to suit your studio’s needs.
📋 Automated Conditional Formatting – Visual arrows and color signals make it easy to spot growth or decline.
👩🎨 Creative Team Focus – Designed specifically for design agencies, freelancers, and creative departments.
💾 Compatible with Windows & Mac – Works seamlessly on both platforms with Excel’s built-in features.
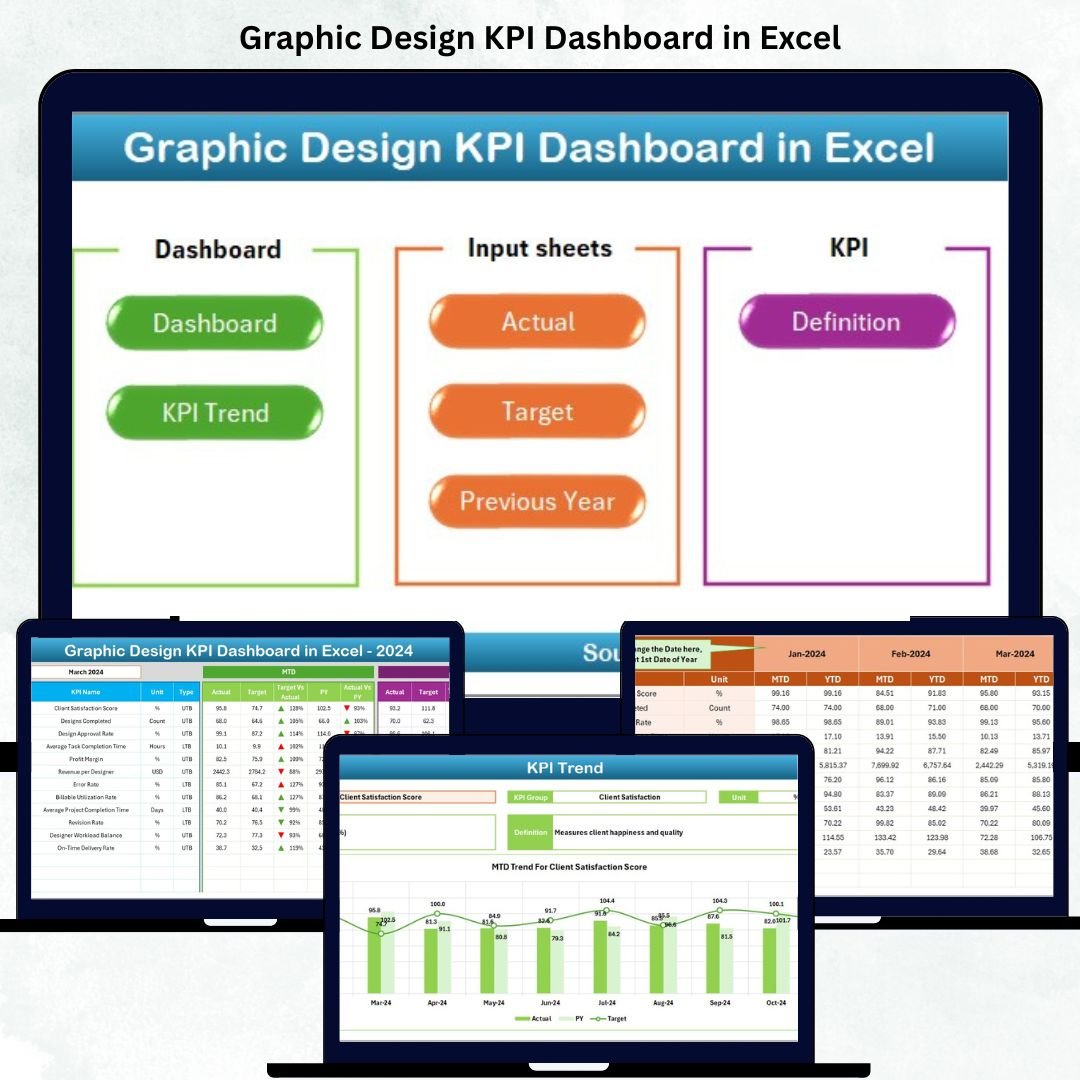
📦 What’s Inside the Graphic Design KPI Dashboard
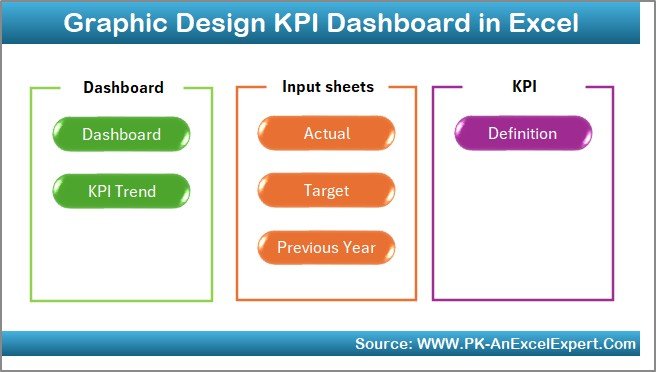
This dashboard template includes seven professionally designed worksheets, each serving a specific analytical function:
1️⃣ Summary Page – Acts as your navigation hub with quick-access buttons to each sheet.
2️⃣ Dashboard Sheet – The main visual interface where KPIs are displayed in charts, tables, and cards.
3️⃣ Trend Sheet – Analyze how performance metrics evolve over time for continuous improvement.
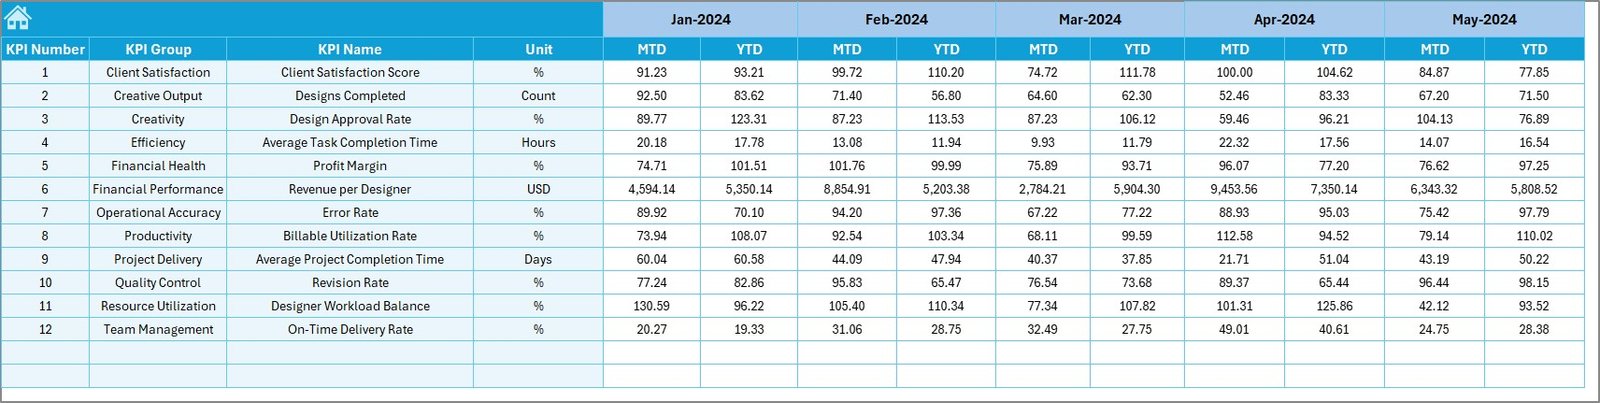
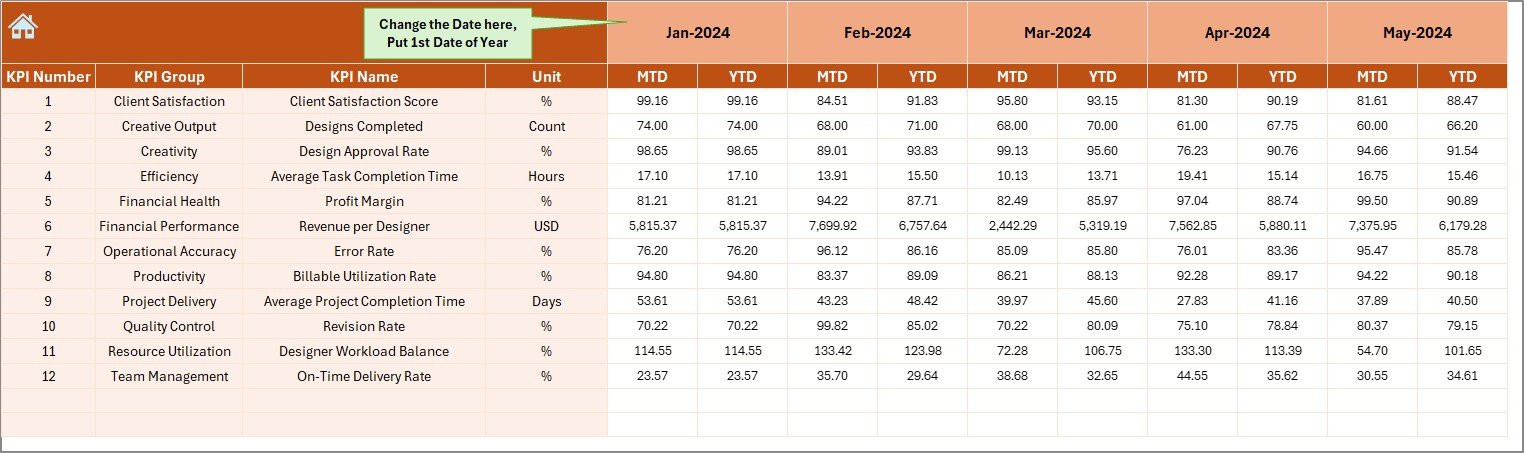
4️⃣ Actual Numbers Input Sheet – Enter real-time monthly performance values for accurate analysis.
5️⃣ Target Sheet – Define MTD and YTD goals for every KPI to evaluate performance gaps.
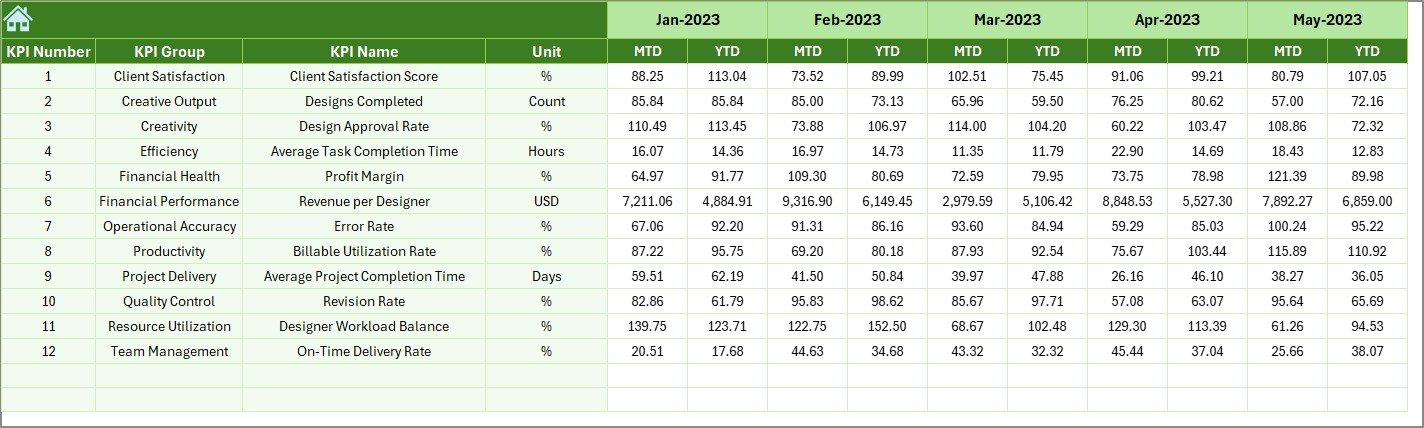
6️⃣ Previous Year Numbers Sheet – Store last year’s data for comparison and trend tracking.
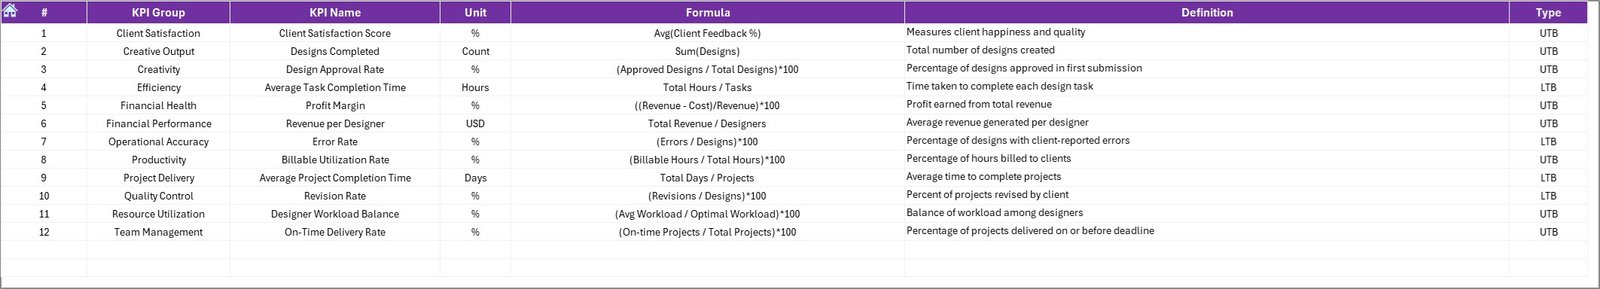
7️⃣ KPI Definition Sheet – Maintain clarity on each KPI’s formula, unit, and definition.
Everything is automated — update your monthly data, and the entire dashboard refreshes with new insights! 🚀
🧭 How to Use the Graphic Design KPI Dashboard
1️⃣ Download the template from NextGenTemplates.com.
2️⃣ Open the Summary Page and navigate easily through the dashboard.
3️⃣ Input Actual Data in the “Actual Numbers” sheet for the current month.
4️⃣ Set Targets in the “Target Sheet” tab for each KPI.
5️⃣ Add Previous Year Data for comparative insights.
6️⃣ Use Slicers to select a Month or Year and view instant KPI updates.
7️⃣ Review Visuals on the Dashboard and Trend Sheets for actionable decisions.
8️⃣ Repeat monthly to build a long-term creative performance tracker.
In just minutes, you’ll turn design metrics into meaningful insights that help you plan smarter, work faster, and deliver better results. 💡
👥 Who Can Benefit from This Dashboard
👨💼 Creative Agency Owners – Monitor team productivity, project timelines, and client satisfaction.
👩🎨 Graphic Designers – Track your own efficiency, turnaround times, and improvement trends.
🏢 In-House Design Teams – Evaluate departmental output and budget usage in one place.
📈 Project Managers – Align creative KPIs with strategic goals and performance benchmarks.
🧑💻 Freelancers – Manage multiple clients and projects with a structured, easy-to-use system.
💼 Marketing & Branding Teams – Measure design impact on campaign outcomes and ROI.
This dashboard bridges the gap between creativity and analytics — helping you make informed decisions and showcase measurable success.
Click here to read the Detailed blog post
Watch the step-by-step video tutorial:
Visit our YouTube channel to learn step-by-step video tutorials
👉 YouTube.com/@PKAnExcelExpert


Reviews
There are no reviews yet.