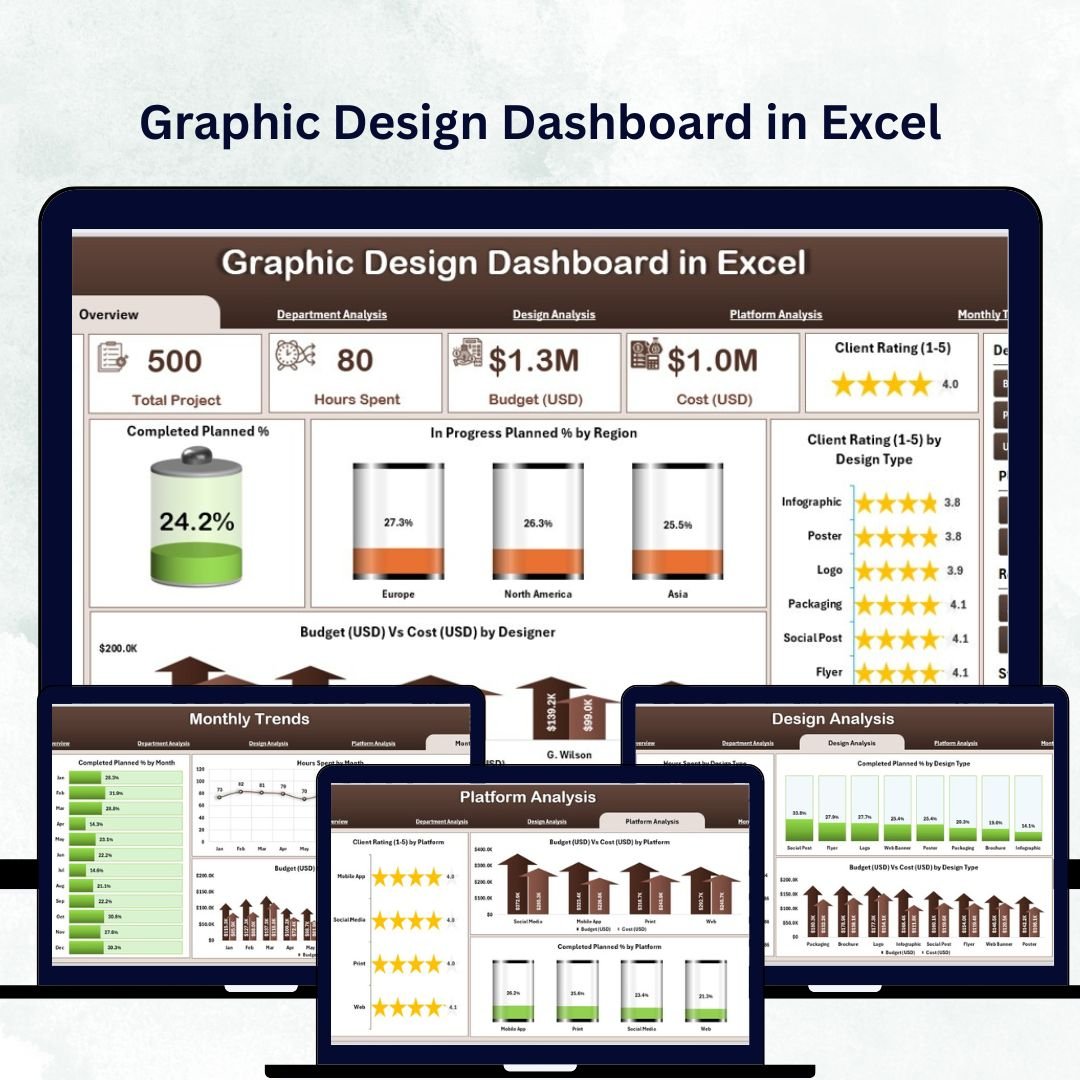

Managing creative projects effectively requires more than just talent — it requires insight. The Graphic Design Dashboard in Excel is a professional, ready-to-use analytical tool designed for creative teams, agencies, and freelancers who want to track performance, productivity, and profitability — all in one place.
This dashboard template helps you visualize every aspect of your design operations, from project progress and workload distribution to client ratings and cost efficiency. Built entirely in Microsoft Excel, it leverages the power of pivot tables, slicers, and charts to provide clear, data-driven insights — without the need for expensive software or coding skills.
Whether you’re running a design studio, managing an in-house creative team, or working as a freelancer, this dashboard helps you stay organized, measure success, and make smart business decisions with ease.
⚙️ Key Features of the Graphic Design Dashboard in Excel
📊 Five Interactive Pages + Data & Support Sheets:
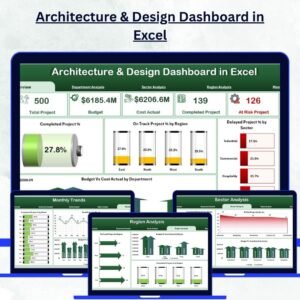
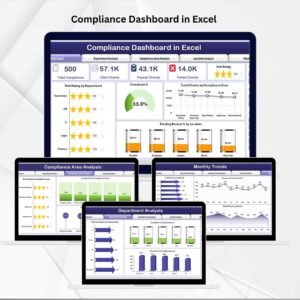
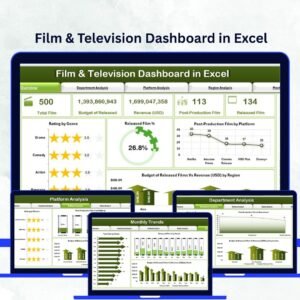
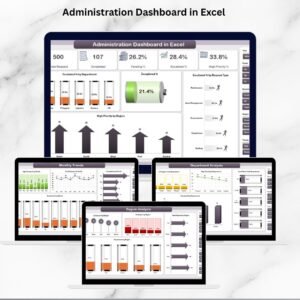
Includes five dynamic analysis pages — Overview, Department Analysis, Design Analysis, Platform Analysis, and Monthly Trends — powered by structured data and automation through Excel’s pivot tables and formulas.
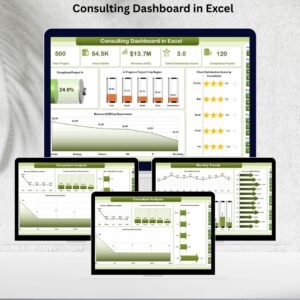
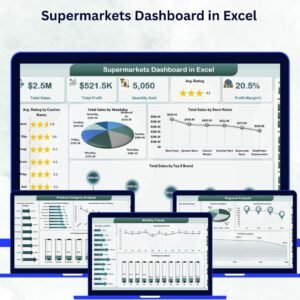
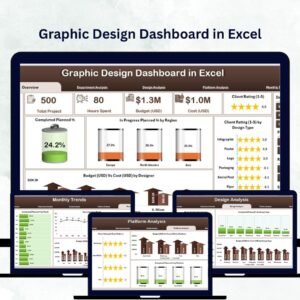
🎯 Overview Page – Your Command Center:
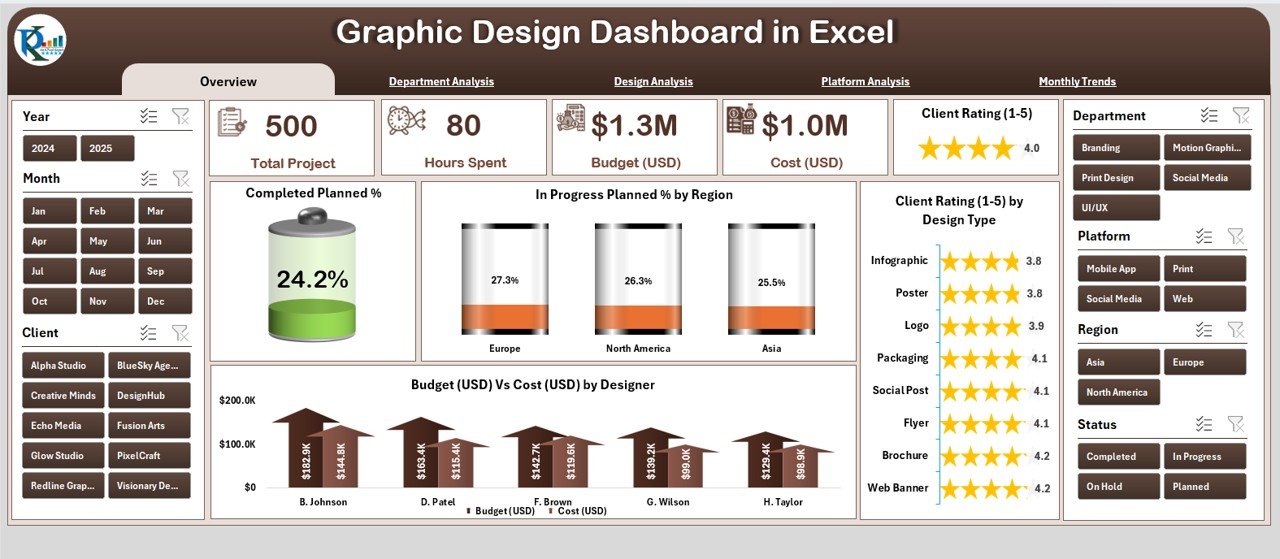
Get a quick, high-level snapshot of your team’s performance with:
-
Summary Cards: Display Total Projects, Completed Projects, In-Progress Tasks, and Cost Efficiency.
-
Interactive Slicers: Filter insights by Month, Client, or Designer.
-
Charts:
-
Completed Planned %
-
In-Progress Planned % by Region
-
Client Rating (1–5) by Design Type
-
Budget vs Cost by Designer
-
Ideal for reviewing creative efficiency at a glance.
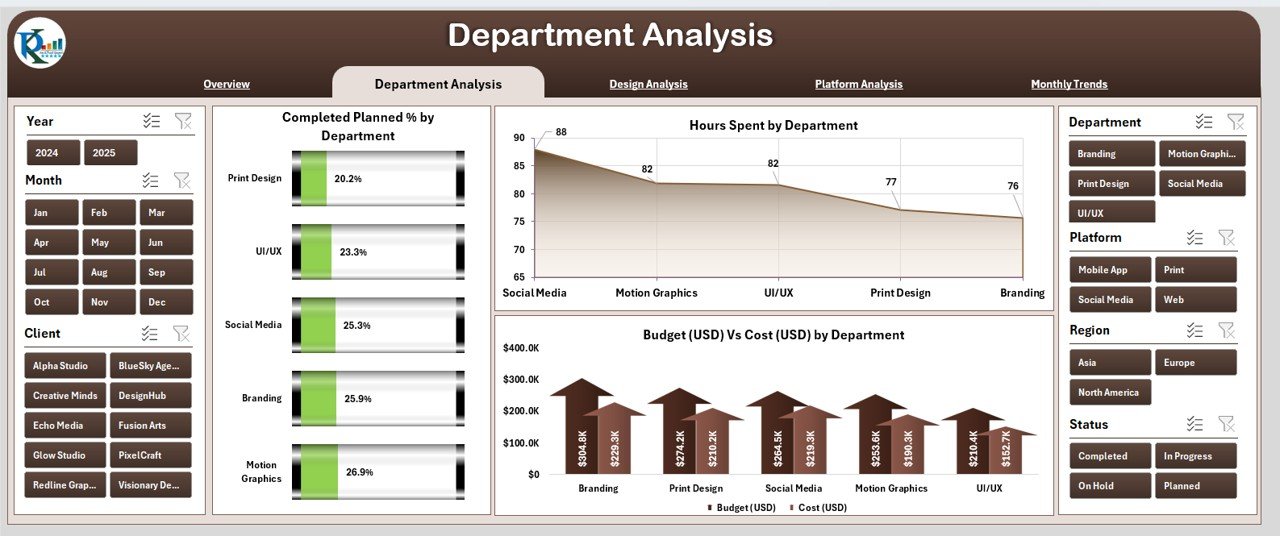
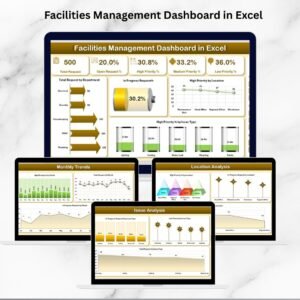
🏢 Department Analysis – Evaluate Team Performance:
Dive into performance by department (Web Design, UI/UX, Branding, Print, etc.).
-
Completed Planned % by Department
-
Hours Spent by Department
-
Budget vs Cost by Department
Identify high-performing teams and areas needing attention.
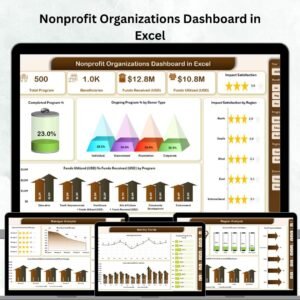
🎨 Design Analysis – Measure Design Impact:
Analyze success by design type — such as logos, websites, videos, or social media creatives.
-
Completed Planned % by Design Type
-
Hours Spent by Design Type
-
Budget vs Cost by Design Type
Perfect for comparing performance across design categories.
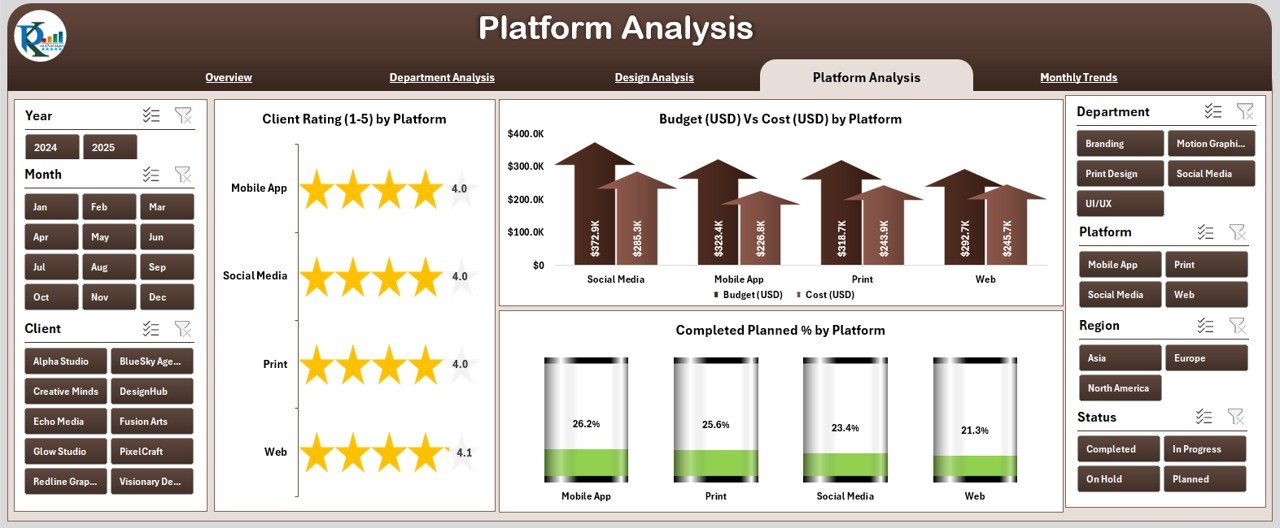
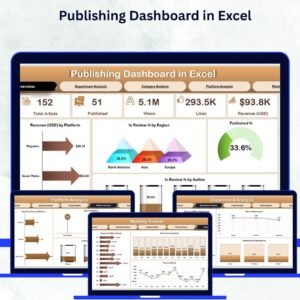
💻 Platform Analysis – Optimize Tool Efficiency:
Review design performance across platforms like Adobe Creative Cloud, Figma, Canva, or Sketch.
-
Completed Planned % by Platform
-
Client Rating (1–5) by Platform
-
Budget vs Cost by Platform
Helps determine which tools and platforms deliver the best ROI.
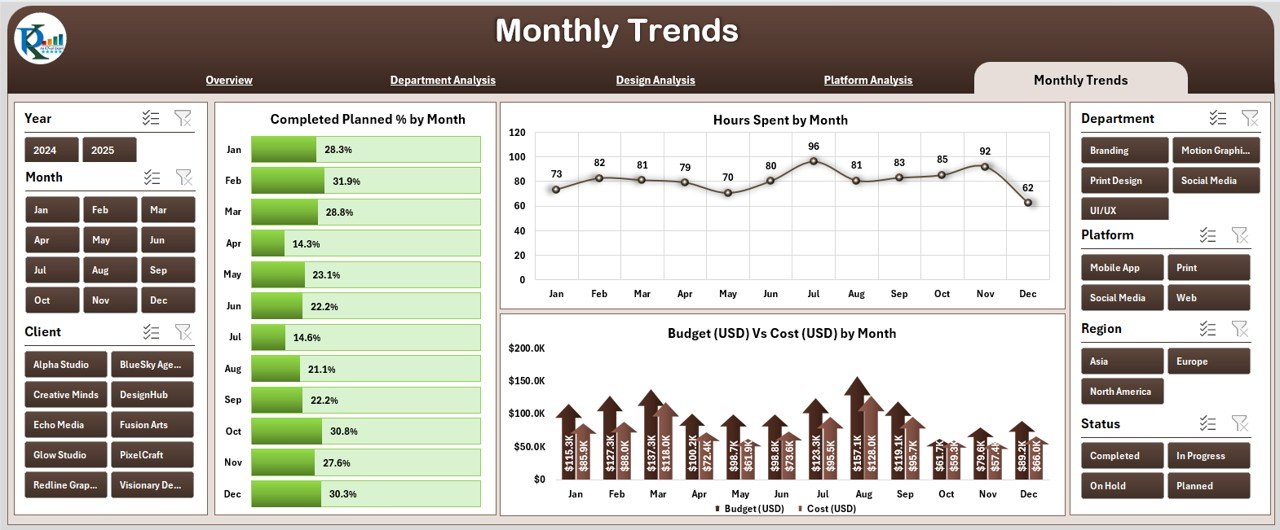
📅 Monthly Trends – Track Growth Over Time:
Visualize productivity and cost trends across months.
-
Completed Planned % by Month
-
Hours Spent by Month
-
Budget vs Cost by Month
Great for review meetings and planning future workloads.
🧾 Data Sheet & Support Sheet:
-
Data Sheet: Stores all raw records (projects, clients, designers, costs, ratings).
-
Support Sheet: Contains dropdown lists, formulas, and references for smooth functionality.
📊 What’s Inside the Graphic Design Dashboard
1️⃣ Overview Page: KPI Summary and top-level performance charts.
2️⃣ Department Analysis: Department-wise efficiency tracking.
3️⃣ Design Analysis: Performance comparison by design type.
4️⃣ Platform Analysis: Evaluation of tool productivity and client feedback.
5️⃣ Monthly Trends: Visualization of performance over time.
6️⃣ Support & Data Sheets: Automation and data backbone for the dashboard.
Each page is interconnected for easy navigation and real-time data refresh.
🧭 How to Use the Dashboard
✅ Step 1: Input your data (projects, clients, budgets, designers, ratings) in the Data Sheet.
✅ Step 2: Click “Refresh All” to update charts and KPIs.
✅ Step 3: Navigate through pages using the left-side panel.
✅ Step 4: Filter results by Month, Platform, or Department via slicers.
✅ Step 5: Analyze performance insights and optimize your creative workflow.
In just minutes, you’ll have a fully functional creative analytics system in Excel.
👥 Who Can Benefit from This Dashboard
🎨 Graphic Design Agencies: Track projects, costs, and client ratings.
👩🎨 Freelance Designers: Manage multiple client projects in one file.
💼 Corporate Marketing Teams: Evaluate internal design efficiency.
🏫 Educational Institutions: Monitor student project outcomes.
👨💻 Creative Managers: Optimize team workloads and deliverables.
🌟 Advantages of the Graphic Design Dashboard in Excel
✅ Centralized Tracking: View all project KPIs in one place.
✅ Data-Driven Decisions: Identify bottlenecks and allocate resources wisely.
✅ Real-Time Analytics: Automatic updates with every data refresh.
✅ Cost-Effective: No additional software or subscriptions required.
✅ User-Friendly: No coding — just Excel knowledge.
✅ Highly Customizable: Add KPIs, visuals, or brand color schemes easily.
✅ Visual Clarity: Simplifies complex data for client presentations and reports.
🔗 Click here to read the Detailed blog post
🎥 Visit our YouTube channel for step-by-step tutorials
🔗 YouTube.com/@PKAnExcelExpert


Reviews
There are no reviews yet.