Freight management is more complex than ever. Fuel prices fluctuate weekly. Delivery schedules shift unexpectedly. Customer expectations continue to rise. Therefore, logistics companies must track performance consistently and accurately.
However, many freight businesses still rely on scattered spreadsheets and manual reports. As a result, they miss delivery delays. They overlook rising freight costs. They struggle to control on-time performance.
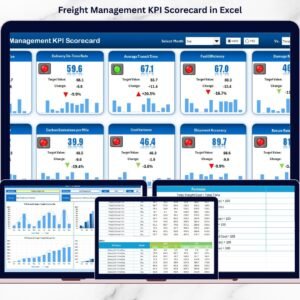
That is exactly why the Freight Management KPI Scorecard in Excel becomes an essential solution.
The Freight Management KPI Scorecard in Excel is a ready-to-use, structured performance tracking template designed specifically for logistics and freight operations. It allows you to monitor operational efficiency, financial performance, and service quality in one centralized system.
Instead of reviewing freight data randomly, you follow a structured KPI approach. Consequently, you gain visibility, improve accountability, and make faster decisions.
Because the scorecard runs entirely in Excel, implementation is simple. No expensive software. No complex setup.
📊 Key Features of Freight Management KPI Scorecard in Excel
This scorecard transforms raw freight data into clear performance insights.
🚛 MTD & YTD Tracking – Monitor Month-to-Date and Year-to-Date performance
🎯 Actual vs Target Comparison – Identify performance gaps instantly
📅 Month Selection Drop-down – Analyze performance month-wise
📈 Previous Year Comparison – Measure growth and decline
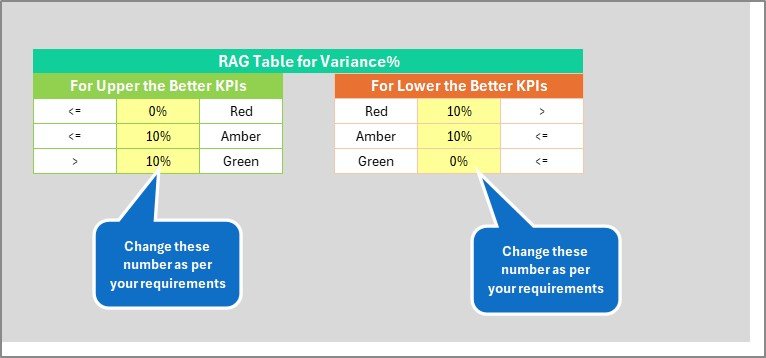
🔺🔻 Conditional Formatting & Arrows – Visual performance indicators
📊 KPI Trend Charts – Analyze patterns over time
📂 Structured KPI Groups – Financial, Operational & Efficiency KPIs
⚡ Automatic Calculations – Dashboard updates instantly
Because of automated calculations, managers focus on strategy instead of manual reporting.
📦 What’s Inside the Freight Management KPI Scorecard?
This ready-to-use template contains 4 structured worksheets, each serving a specific purpose.
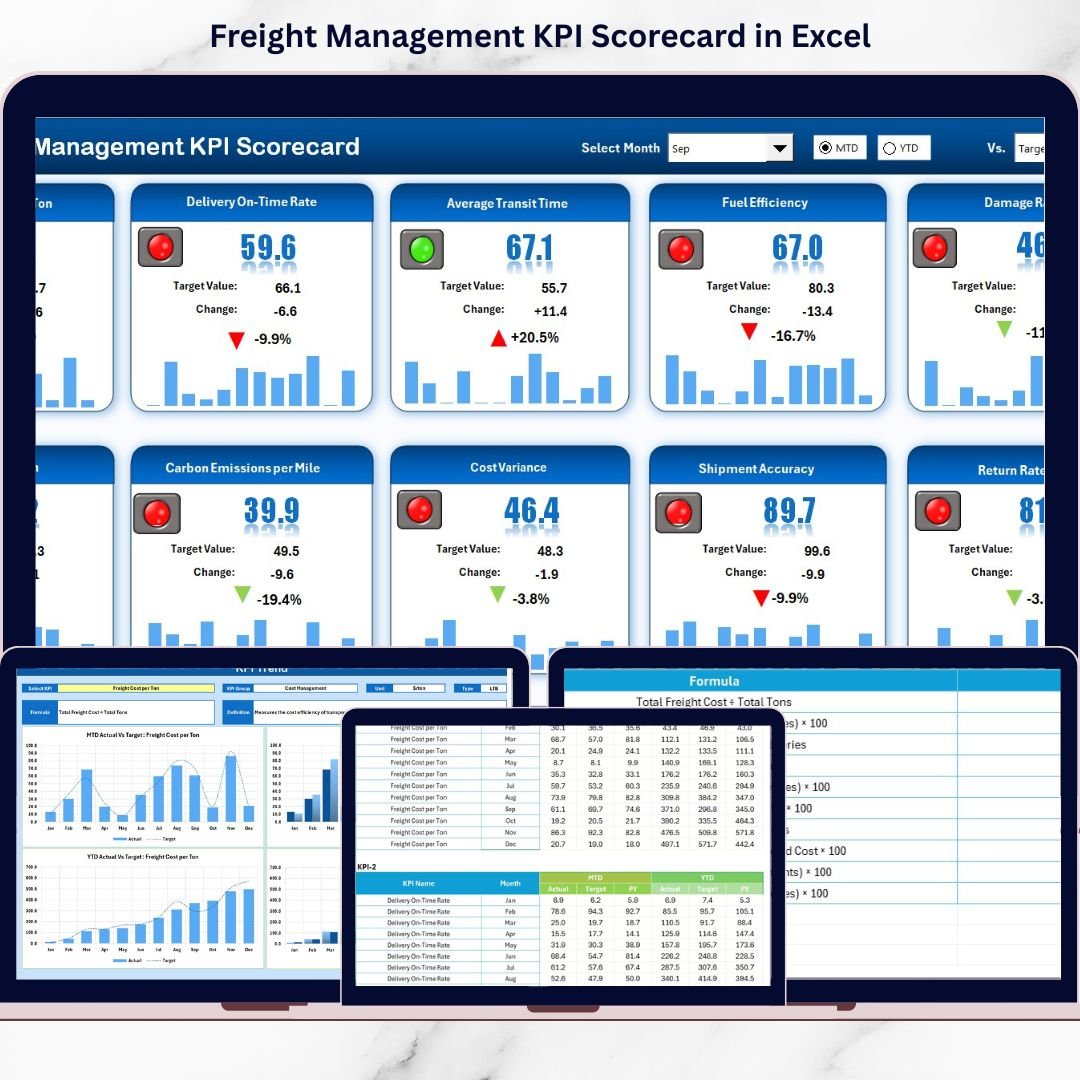
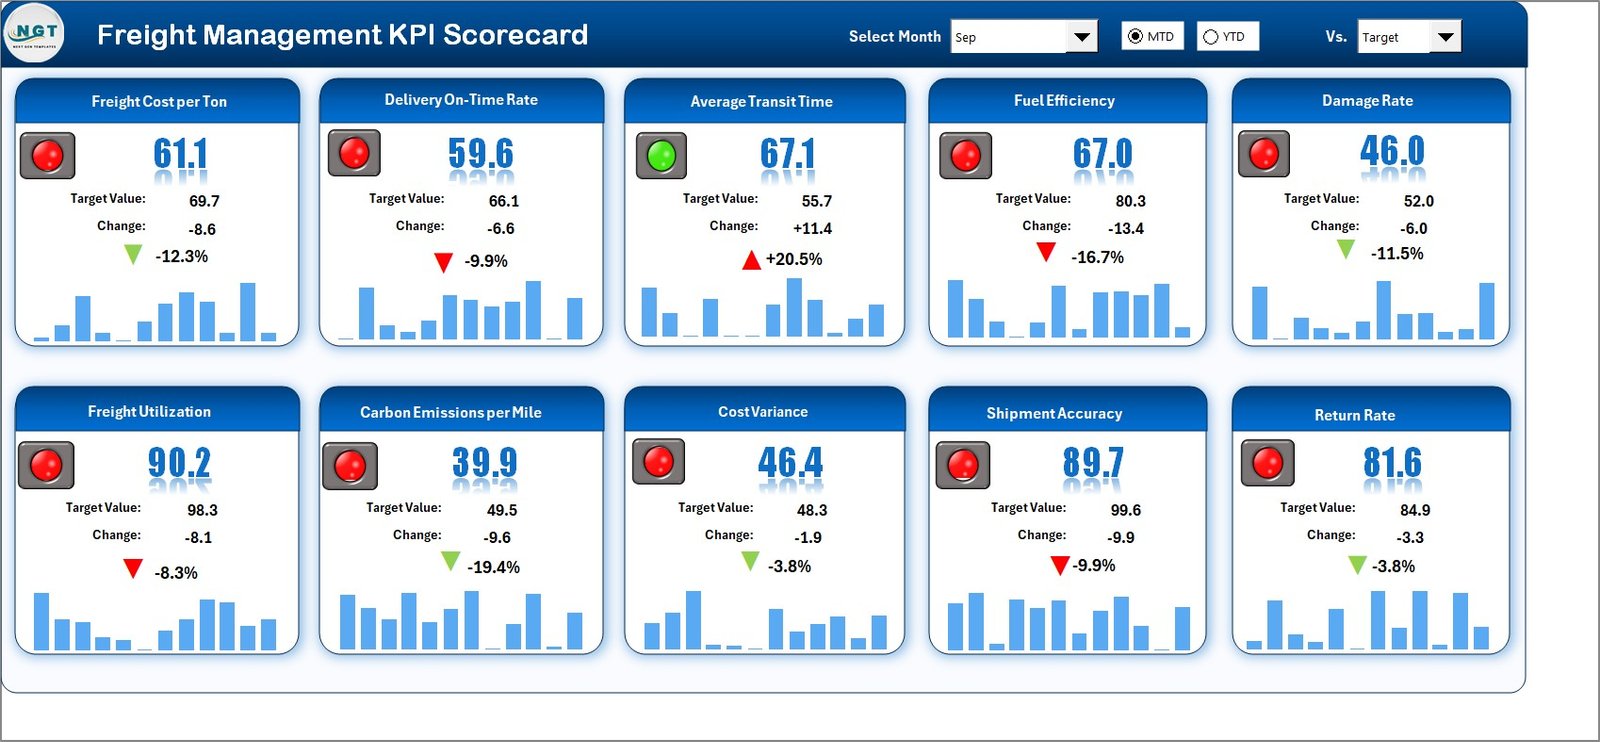
🟢 1️⃣ Scorecard Sheet – Main Performance Dashboard
This is the core performance view.
You can:
-
Select Month
-
Choose MTD or YTD view
-
Compare Actual vs Target vs Previous Year
For each KPI, the scorecard displays:
-
Actual value
-
Target value
-
Previous Year value
-
Target vs Actual difference
-
PY vs Actual difference
With color indicators and arrows, you instantly see performance improvement or decline.
Because everything appears in one sheet, decision-making becomes faster.
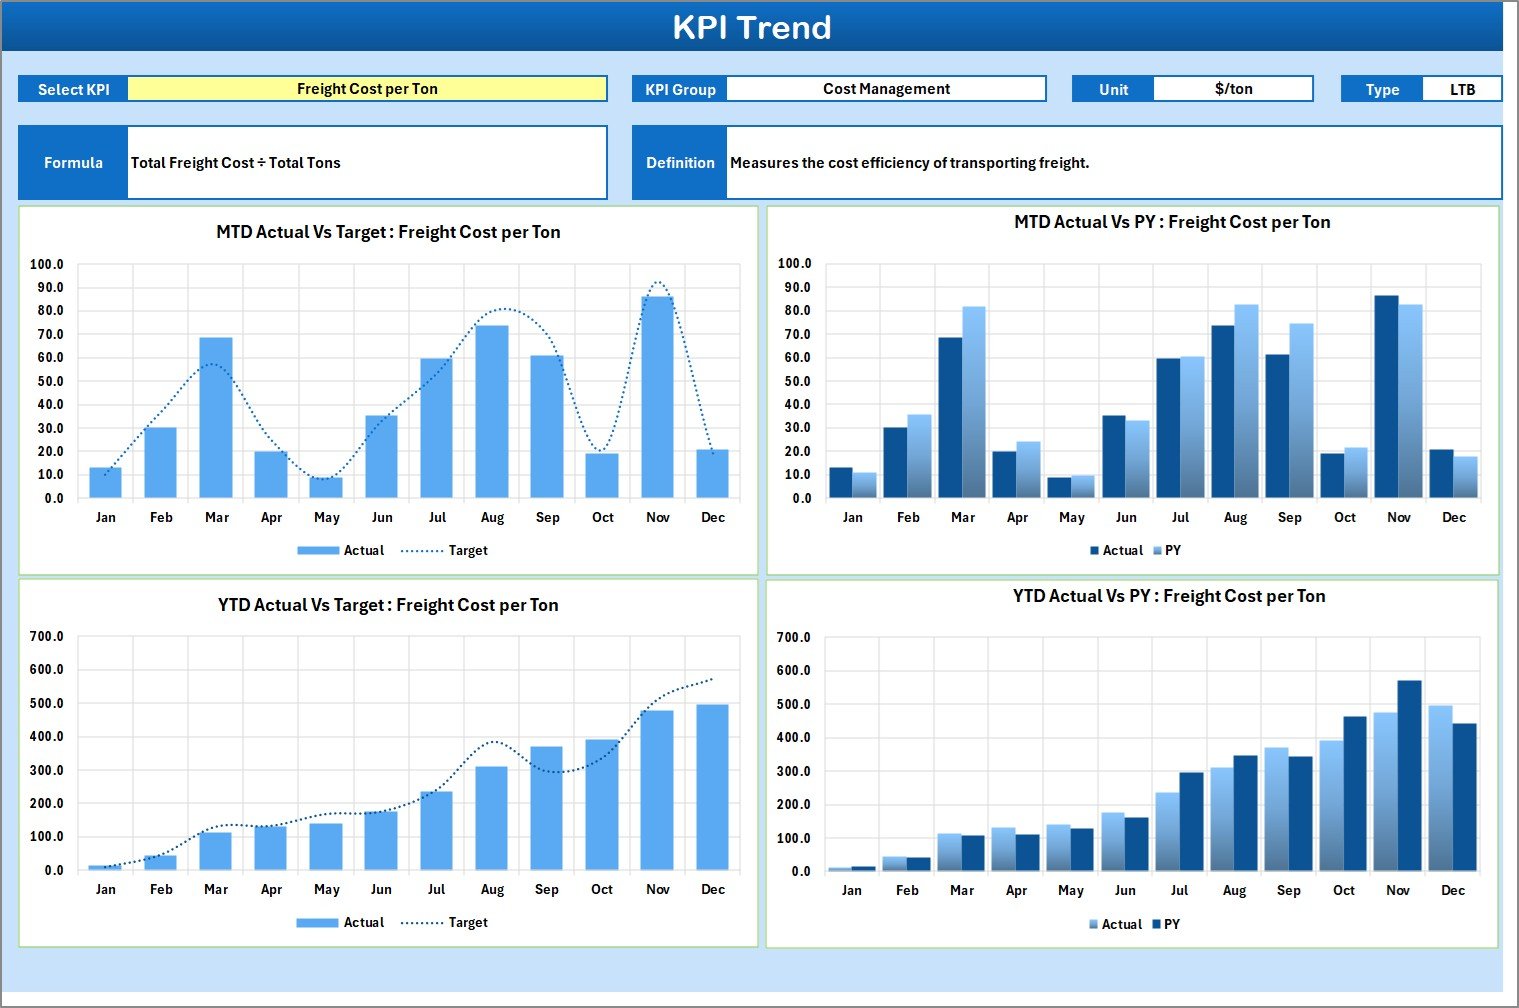
📈 2️⃣ KPI Trend Sheet – Performance Over Time
This sheet provides detailed visual analysis.
At cell C3, you select a KPI from a drop-down list. Immediately, the sheet displays:
-
KPI Group
-
Unit of Measurement
-
KPI Type (LTB / UTB)
-
KPI Formula
-
KPI Definition
It also shows:
-
📊 MTD Trend Chart
-
📊 YTD Trend Chart
-
Comparison of Actual vs Target vs Previous Year
Therefore, you identify patterns, seasonal fluctuations, and operational issues quickly.
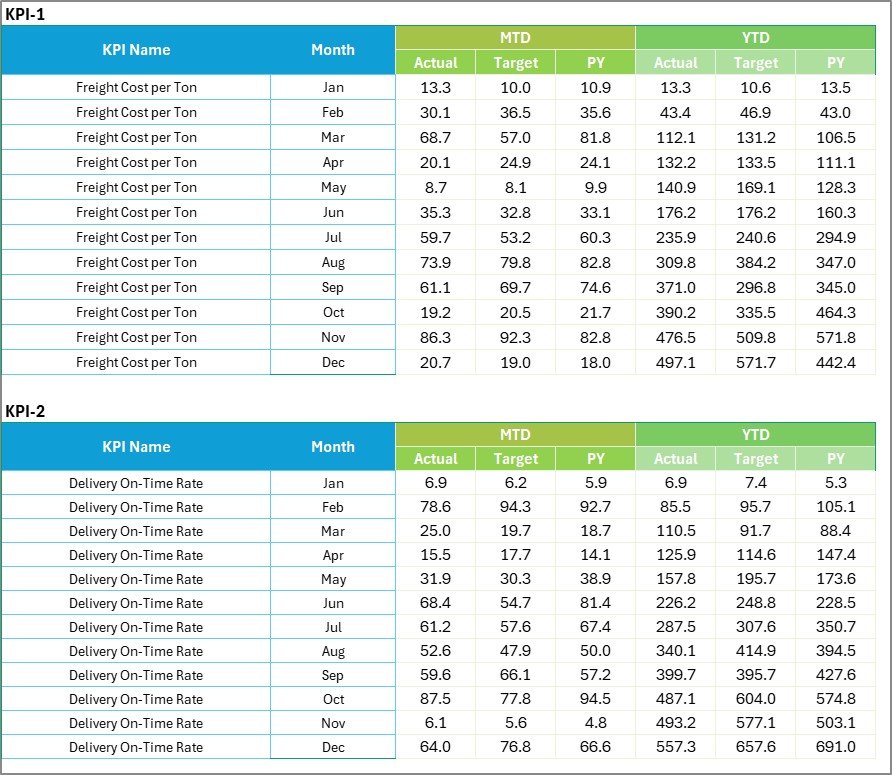
📝 3️⃣ Input Data Sheet – Data Entry Hub
This sheet captures all performance numbers.
You enter:
-
Actual values
-
Target values
-
Previous Year values
-
Monthly performance data
Because all calculations depend on this sheet, structured data entry ensures reliable reporting.
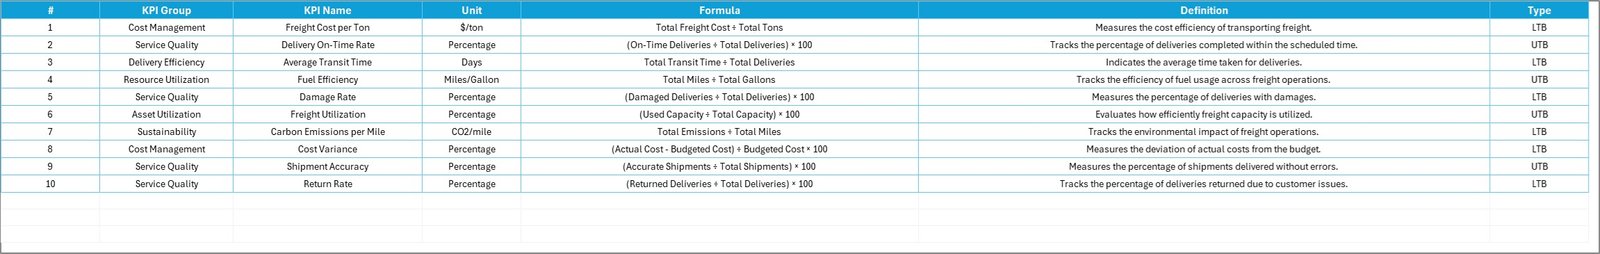
📘 4️⃣ KPI Definition Sheet – KPI Library
This sheet stores:
-
KPI Name
-
KPI Group
-
Unit
-
Formula
-
Definition
For example:
-
Freight Cost per Shipment = Total Freight Cost ÷ Total Shipments
-
On-Time Delivery Rate = On-Time Shipments ÷ Total Shipments × 100
This ensures KPI clarity and consistency across departments.
🚛 Essential KPIs You Can Track
Operational KPIs
-
On-Time Delivery Rate
-
Transit Time
-
Shipment Accuracy
-
Carrier Performance Score
-
Damage Rate
Financial KPIs
-
Freight Cost per Shipment
-
Cost per Mile
-
Fuel Cost Ratio
-
Transportation Cost % of Revenue
-
Claims Cost
Efficiency KPIs
-
Load Utilization Rate
-
Route Efficiency
-
Capacity Utilization
-
Return Load Ratio
Tracking these KPIs improves both cost control and service reliability.
🎯 How This Scorecard Improves Decision-Making
When you implement this scorecard:
✔ You increase freight performance visibility
✔ You detect cost increases early
✔ You monitor delivery accuracy continuously
✔ You compare trends month-wise and year-wise
✔ You improve carrier management
✔ You align operations with financial goals
Because structured tracking reduces blind spots, profitability improves steadily.
🚀 Advantages of Freight Management KPI Scorecard in Excel
1️⃣ Centralized KPI Monitoring
2️⃣ Real-Time Performance Updates
3️⃣ Visual Indicators for Quick Insights
4️⃣ Structured Target Management
5️⃣ Easy Customization
6️⃣ Cost-Effective Solution
7️⃣ Improved Accountability Across Teams
Whether you manage 50 shipments or 50,000 shipments, this scorecard scales with your operations.
👥 Who Can Use This Scorecard?
Ideal for:
🚚 Freight Forwarding Companies
📦 Logistics Service Providers
🏭 Distribution Centers
🚛 Fleet Operators
📊 Supply Chain Managers
📈 Operations Analysts
If you manage freight performance, this tool gives you clarity and control.
🔧 Best Practices for Implementation
✔ Update data weekly or monthly
✔ Set realistic and measurable targets
✔ Review KPIs in monthly performance meetings
✔ Focus on 10–20 critical KPIs
✔ Maintain accurate data entry
✔ Use trend charts for forecasting
✔ Assign KPI ownership to responsible managers
Consistency ensures long-term results.
🔗 Click here to read the Detailed blog post
🎥 Visit our YouTube channel to learn step-by-step video tutorials
👉 https://www.youtube.com/@PKAnExcelExpert