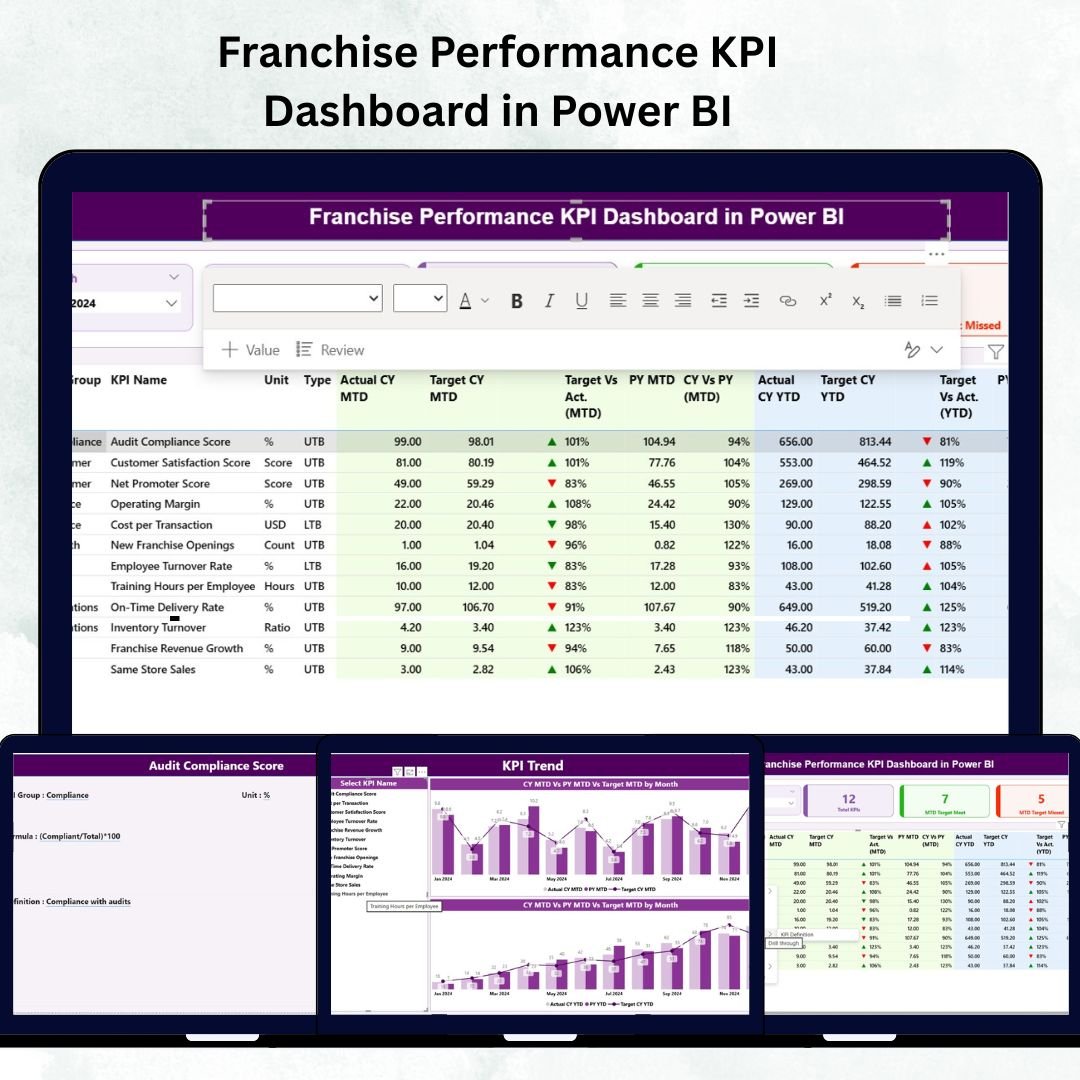
In the fast-moving world of franchising, real-time performance visibility is the difference between growth and guesswork. The Franchise Performance KPI Dashboard in Power BI empowers business owners, regional managers, and analysts to monitor every aspect of franchise operations with accuracy and ease. Whether you oversee a restaurant chain, retail network, or fitness brand, this dashboard helps you track key metrics, compare results, and make informed decisions that drive profitability.
⚙️ Key Features of Franchise Performance KPI Dashboard in Power BI
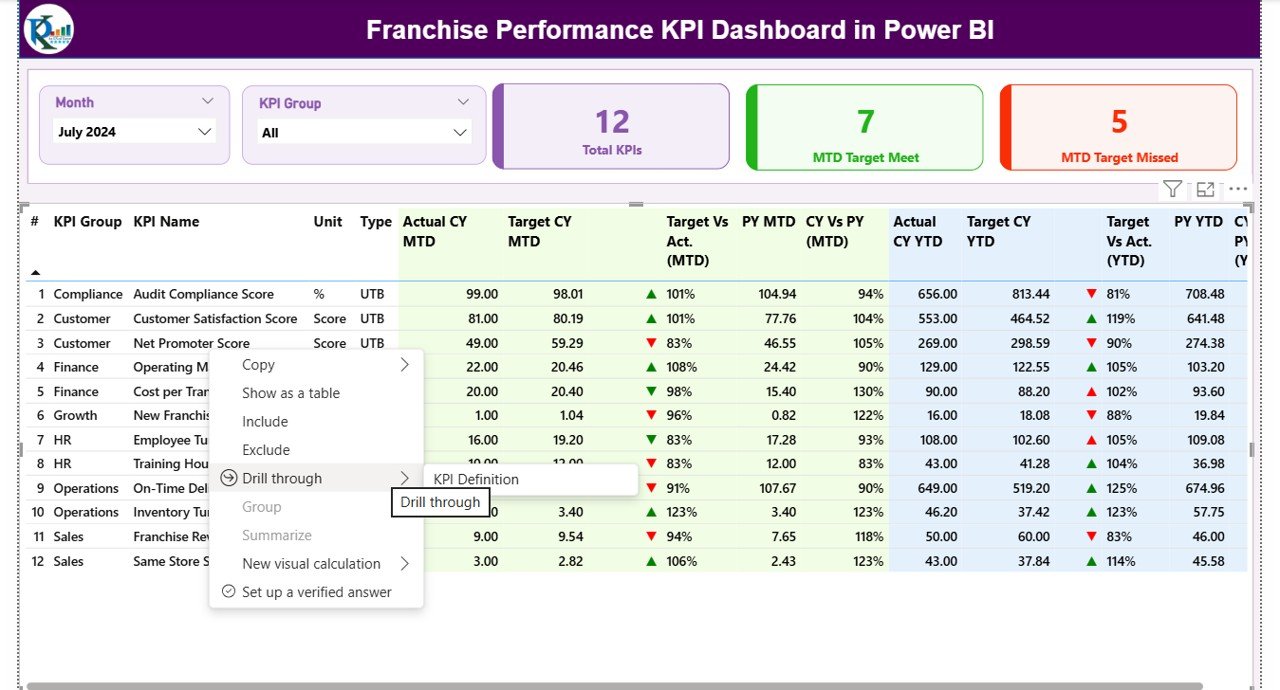
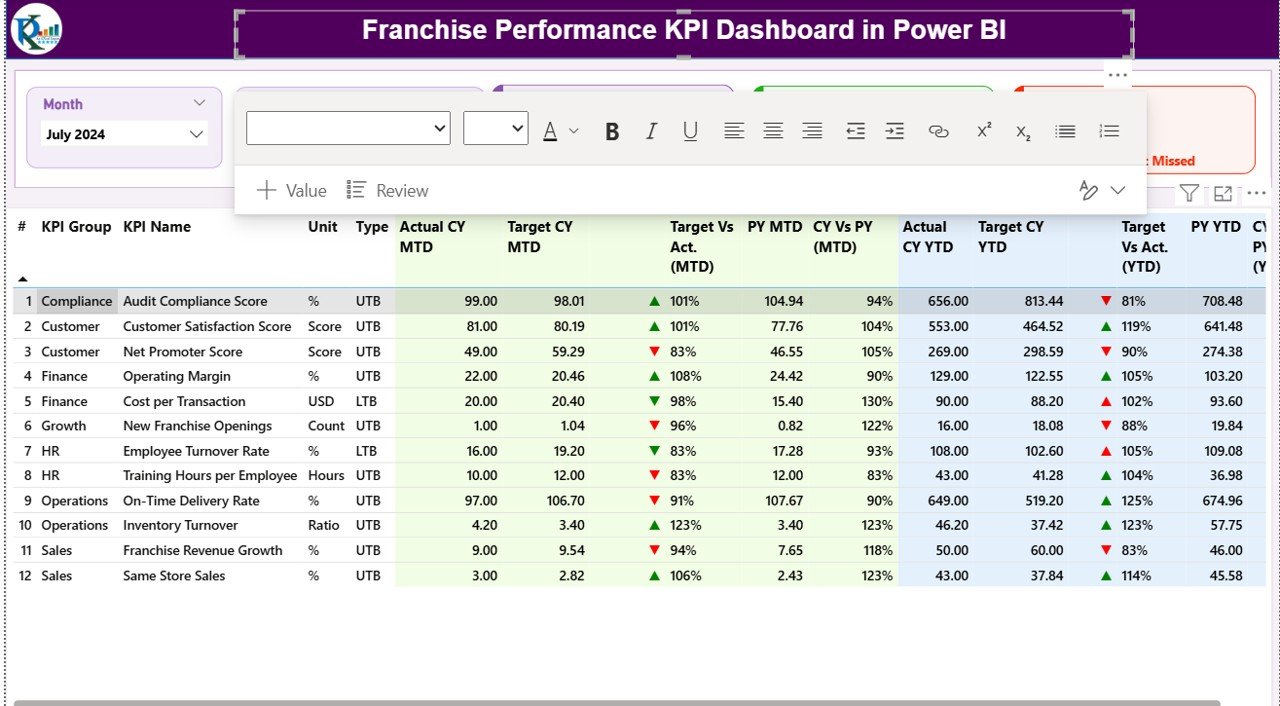
✨ Comprehensive Performance View: Get instant insights into Month-to-Date (MTD) and Year-to-Date (YTD) metrics for all your franchises in one place.
📊 Dynamic Slicers & Filters: Effortlessly filter by month or KPI category (Sales, Customer Experience, Operations) for focused analysis.Franchise Performance KPI Dashboard in Power BI
📈 Performance Cards: Instantly see total KPI count, targets met, and missed metrics—perfect for quick executive reviews.
📉 Interactive Tables: Each KPI row displays actual vs. target, trend icons (🔼🔽), and year-over-year comparisons for powerful visual clarity.
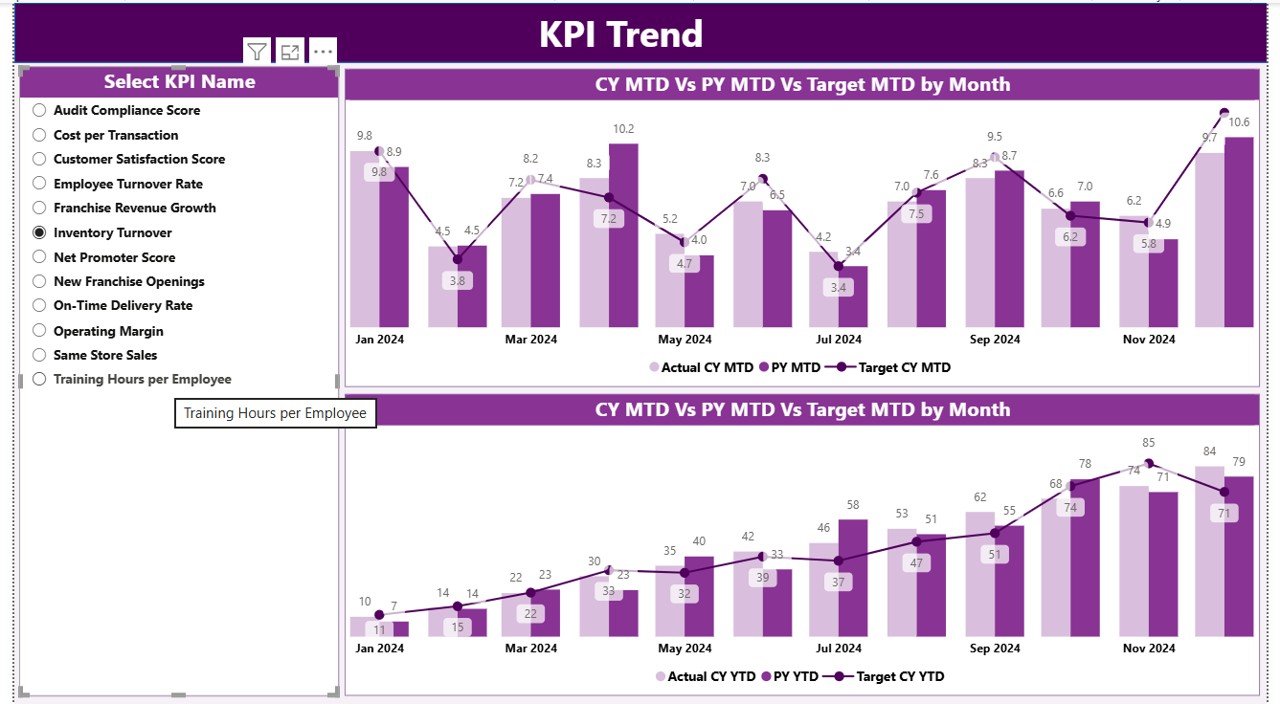
📅 Trend Analysis Page: Visualize monthly performance trends through combo charts that highlight peaks, dips, and seasonal patterns.
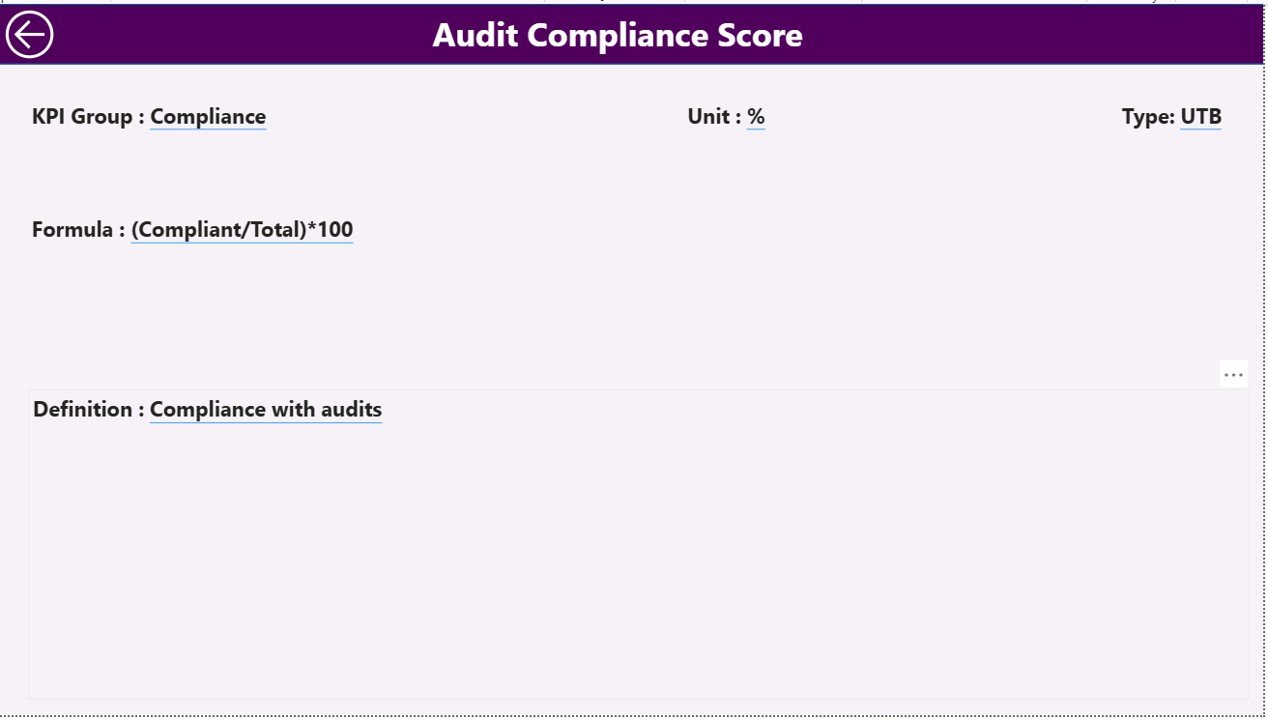
📘 Drill-Through KPI Definition Page: Click any KPI to view its formula, definition, and type (LTB or UTB)—ensuring data transparency and alignment.
🔄 Excel Data Integration: Seamlessly updates from Excel sheets; Power BI auto-refreshes visuals for real-time accuracy.
🎨 User-Friendly Interface: Modern design, color-coded icons, and navigation buttons for effortless exploration.
📂 What’s Inside the Franchise Performance KPI Dashboard in Power BI
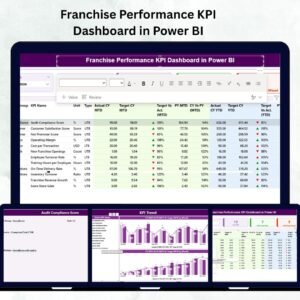
When you download this Power BI file, you’ll find three professionally designed pages ready for instant analysis:
1️⃣ Summary Page:
-
Displays KPI cards, slicers, and a comprehensive performance table.
-
Summarizes how each outlet performs versus monthly and yearly targets.
2️⃣ KPI Trend Page:
-
View combo charts comparing Actual, Target, and Previous Year data.
-
Select any KPI via slicer for deep-dive visual insights.
3️⃣ KPI Definition Page:
-
Hidden drill-through section detailing KPI formulas, definitions, and measurement units.
-
Promotes consistency and clarity across all franchise users.Franchise Performance KPI Dashboard in Power BI
💾 Data Source: The dashboard is powered by three simple Excel sheets:
-
Input_Actual – Actual MTD & YTD values.
-
Input_Target – Target MTD & YTD data.
-
KPI_Definition – KPI name, group, formula, and type.
Once you refresh Power BI, everything updates automatically—no coding required.
🧭 How to Use the Franchise Performance KPI Dashboard in Power BI
💡 Step 1: Connect the dashboard to your Excel data source.
💡 Step 2: Choose the reporting month and KPI group from slicers.
💡 Step 3: Review summary cards and performance tables.
💡 Step 4: Drill through any KPI for detailed formula and definition.
💡 Step 5: Switch to the Trend page to view historical and comparative insights.
💡 Step 6: Use visual cues (🔼/🔽) to identify areas needing improvement.
💡 Step 7: Refresh data monthly for real-time, accurate results.
Within minutes, you’ll have a complete snapshot of your franchise’s performance health—helping you focus on growth, consistency, and profitability.
👥 Who Can Benefit from This Franchise Performance KPI Dashboard in Power BI
🏪 Franchise Owners & CEOs: Get a holistic view of all branches, instantly identifying high-performers and underachievers.
📊 Regional & Area Managers: Analyze performance by location, department, or KPI group to improve accountability.
💼 Business Analysts: Conduct trend analysis and build data-driven reports without starting from scratch.
💰 Finance Teams: Track revenue, profit margins, and cost-to-sales ratios to optimize budgets.
🧑💼 Operations Managers: Maintain consistency and service quality across locations.
📈 Consultants & Auditors: Evaluate franchise health and benchmark performance for strategic guidance.
With automated visuals, standardized KPIs, and real-time updates, this dashboard becomes your go-to performance management system.Franchise Performance KPI Dashboard in Power BI
✅ Why You’ll Love It
-
No complex setup — just plug in your Excel data.
-
Clear visual storytelling for faster decision-making.
-
Scalable for any franchise size or industry.
-
Built entirely in Power BI—trusted, flexible, and modern.


Reviews
There are no reviews yet.