Managing forex services without structured performance tracking is risky. Exchange rates fluctuate constantly, volumes change daily, and margins stay tight. In such a fast-moving environment, relying on scattered reports or manual tracking can quickly lead to missed opportunities and delayed decisions.
That is why the Forex Services KPI Dashboard in Excel is designed as a ready-to-use, decision-driven performance management tool. This dashboard converts complex forex data into clear KPIs, trends, and insights—all inside Excel. As a result, you gain instant visibility, stronger control, and faster decision-making without expensive software or technical complexity.
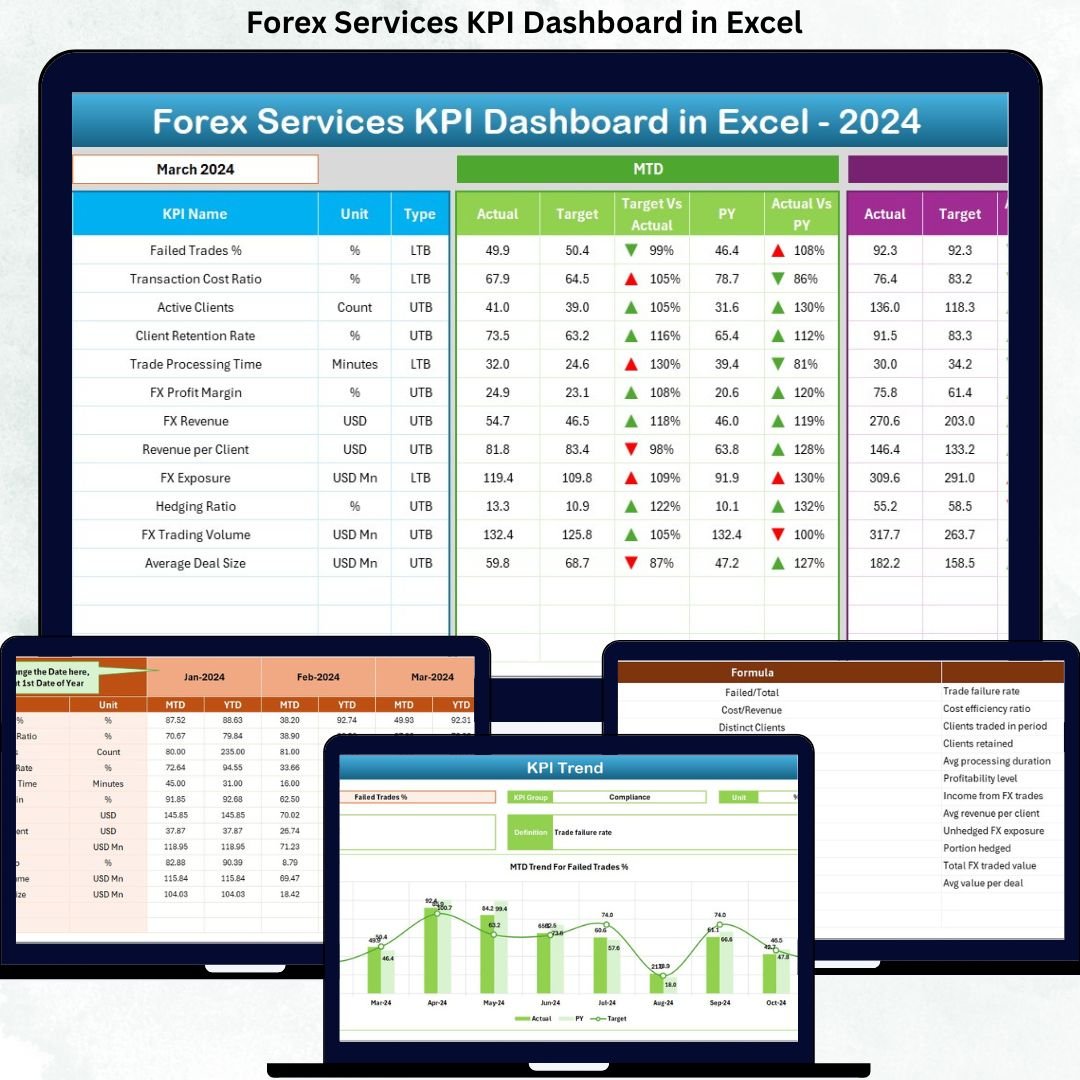
Built for real-world forex operations, this dashboard helps you track MTD and YTD performance, compare Actual vs Target vs Previous Year, and monitor trends that directly impact profitability and compliance.
🔥 Key Features of Forex Services KPI Dashboard in Excel
✅ Centralized KPI Monitoring – Track all critical forex KPIs from one single Excel dashboard instead of multiple spreadsheets.
✅ MTD & YTD Performance Tracking – Monitor short-term execution and long-term performance simultaneously.
✅ Actual vs Target Analysis – Instantly identify performance gaps and corrective action areas.
✅ Previous Year Comparison – Measure growth, seasonality, and historical performance trends.
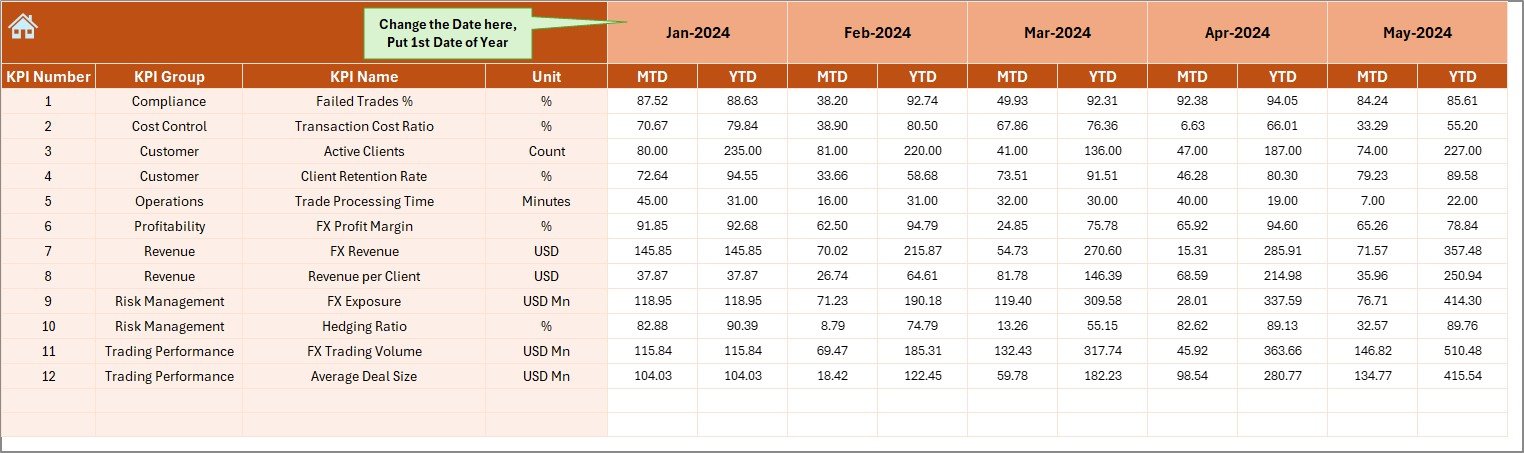
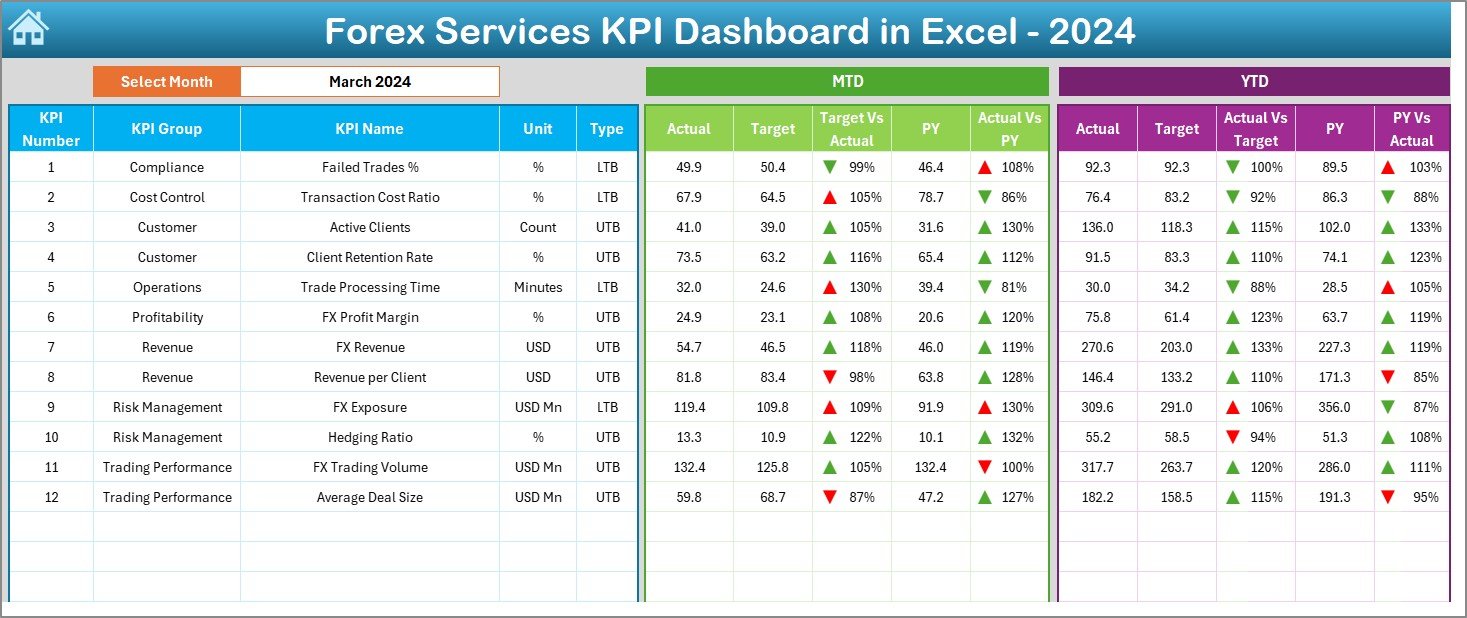
✅ Dynamic Month Selection – Change the month from a dropdown and update the entire dashboard automatically.
✅ Visual Performance Indicators – Conditional formatting arrows and colors highlight over- and under-performance instantly.
✅ Trend-Based Analysis – Analyze KPI behavior over time using structured trend charts.
✅ No Complex Tools Required – 100% Excel-based, easy to maintain, and business-friendly.
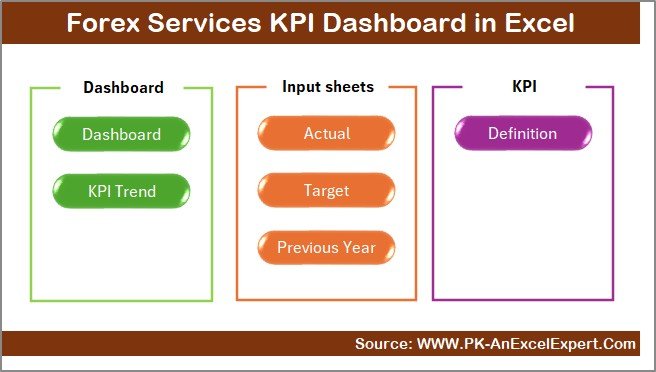
📦 What’s Inside the Forex Services KPI Dashboard in Excel
This Excel dashboard is structured into 7 professionally designed worksheets, each serving a specific business purpose:
📌 Summary Page
Acts as a navigation hub with clickable buttons to access each worksheet quickly.
📌 Dashboard Sheet
The core performance page displaying:
-
MTD Actual, Target & Previous Year
-
YTD Actual, Target & Previous Year
-
Target vs Actual variance
-
Previous Year vs Actual variance
All visuals update automatically based on month selection.
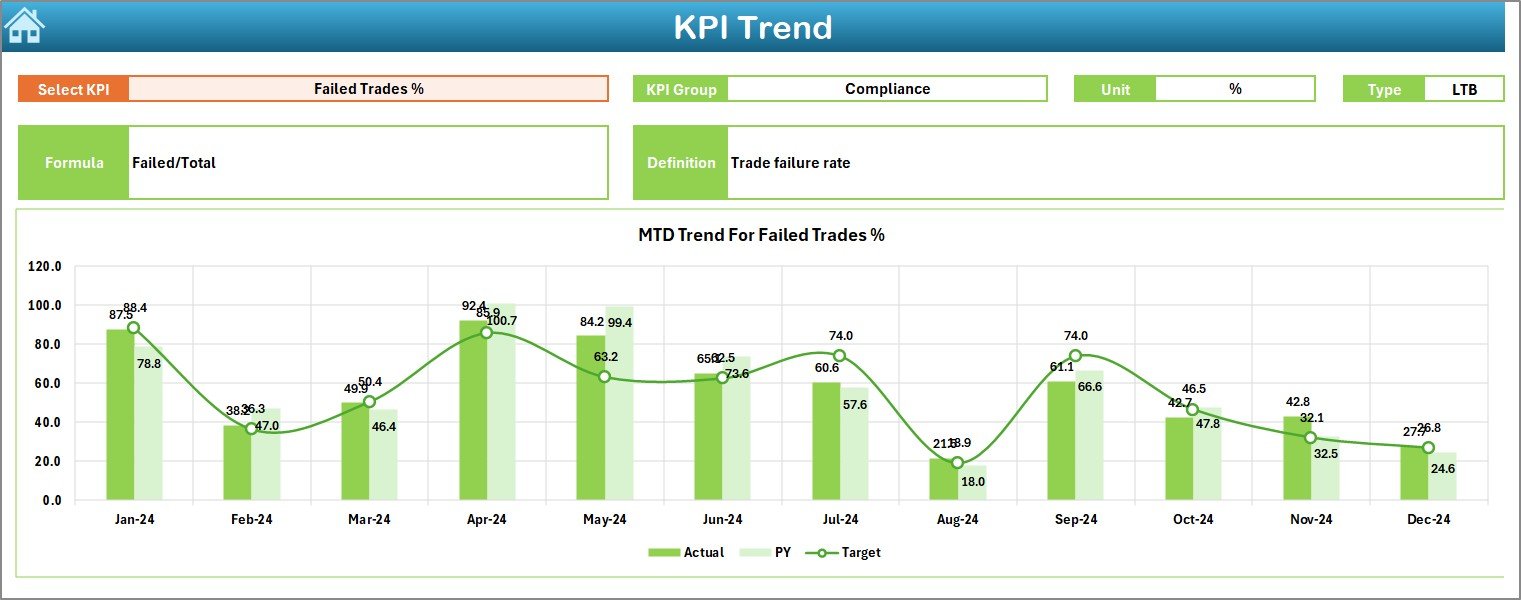
📌 Trend Sheet
Deep-dive KPI analysis with:
-
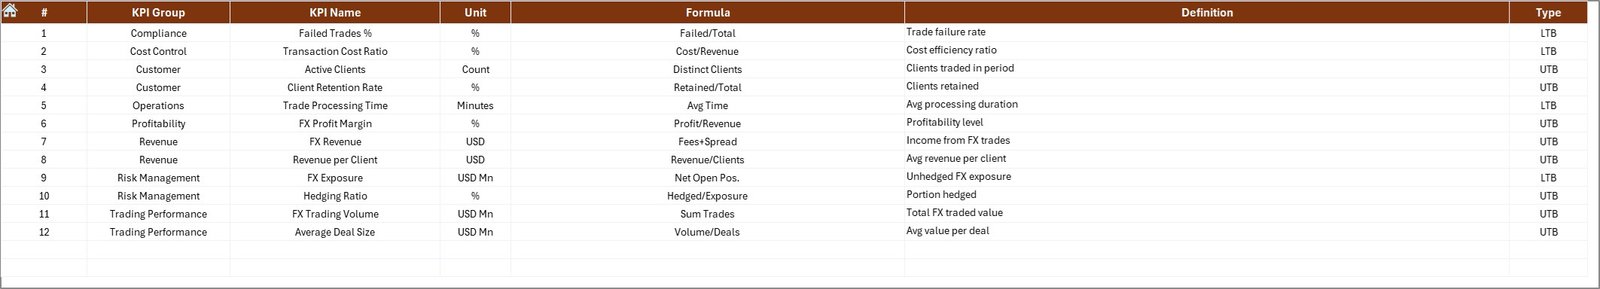
KPI group, unit, type, formula, and definition
-
MTD and YTD trend charts for Actual, Target, and Previous Year
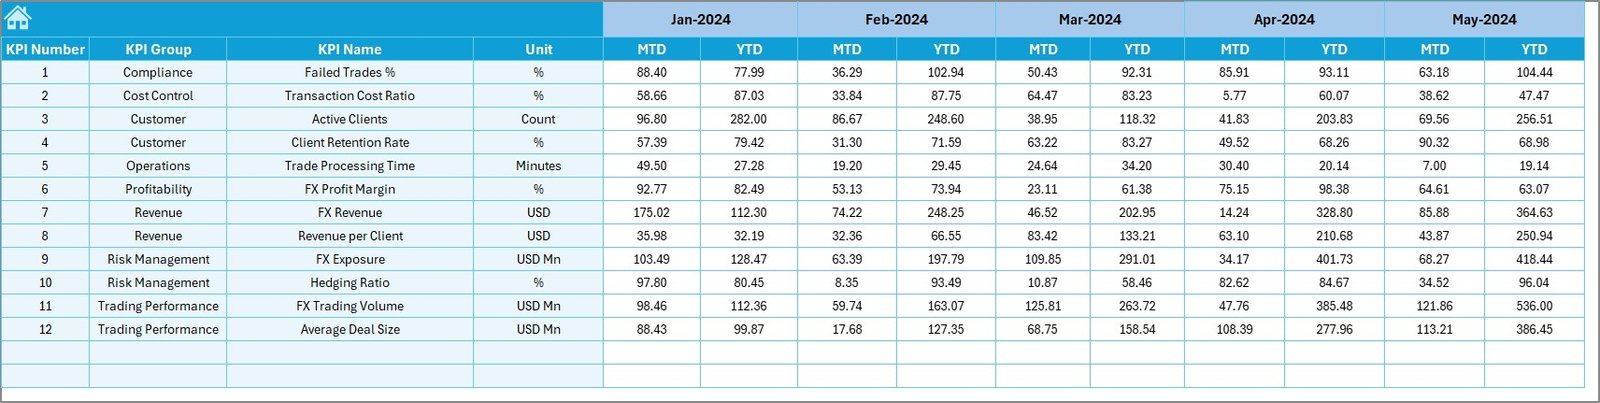
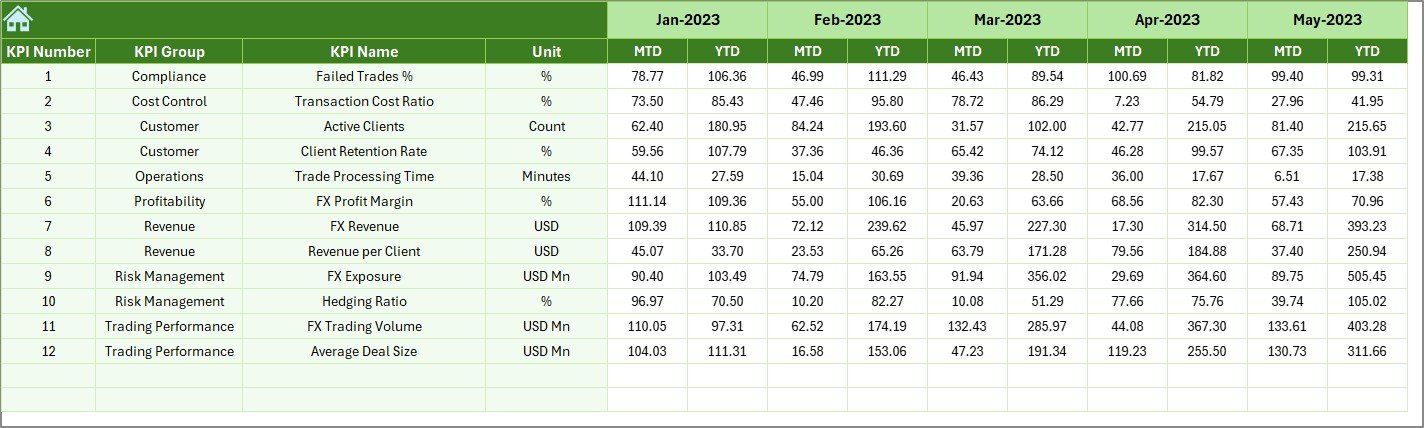
📌 Actual Numbers Input Sheet
Simple and structured data entry for monthly and yearly actual values.
📌 Target Sheet
Define and manage MTD and YTD performance targets.
📌 Previous Year Data Sheet
Store and compare historical performance data.
📌 KPI Definition Sheet
Clear documentation of all KPIs to ensure consistency and alignment across teams.
🛠️ How to Use the Forex Services KPI Dashboard in Excel
Using this dashboard is simple and intuitive:
1️⃣ Enter monthly actual data in the Actual Numbers sheet
2️⃣ Update performance targets in the Target sheet
3️⃣ Maintain historical values in the Previous Year sheet
4️⃣ Select the desired month from the dropdown
5️⃣ Review performance instantly on the Dashboard and Trend pages
No advanced Excel skills are required—basic Excel knowledge is enough.
👥 Who Can Benefit from This Forex Services KPI Dashboard in Excel
This dashboard is ideal for:
👔 Forex service providers
💱 Currency exchange firms
📊 Treasury and finance teams
📈 Operations managers
⚖️ Compliance teams
🏢 Business owners and decision-makers
Whether you manage a small forex operation or a growing financial service firm, this dashboard adapts to your needs.
Click here to read the Detailed blog post
Watch the step-by-step video tutorial:


Reviews
There are no reviews yet.