Forestry operations demand precision, sustainability, and profitability. Forest managers must monitor harvesting performance, control plantation costs, evaluate species profitability, and track regional margins consistently. However, many forestry companies still rely on scattered Excel sheets and manual reports. As a result, leaders struggle to gain real-time insights and often react late to cost overruns or declining margins.
That is exactly why the Forestry Dashboard in Power BI becomes a powerful business intelligence solution 🌲📊.
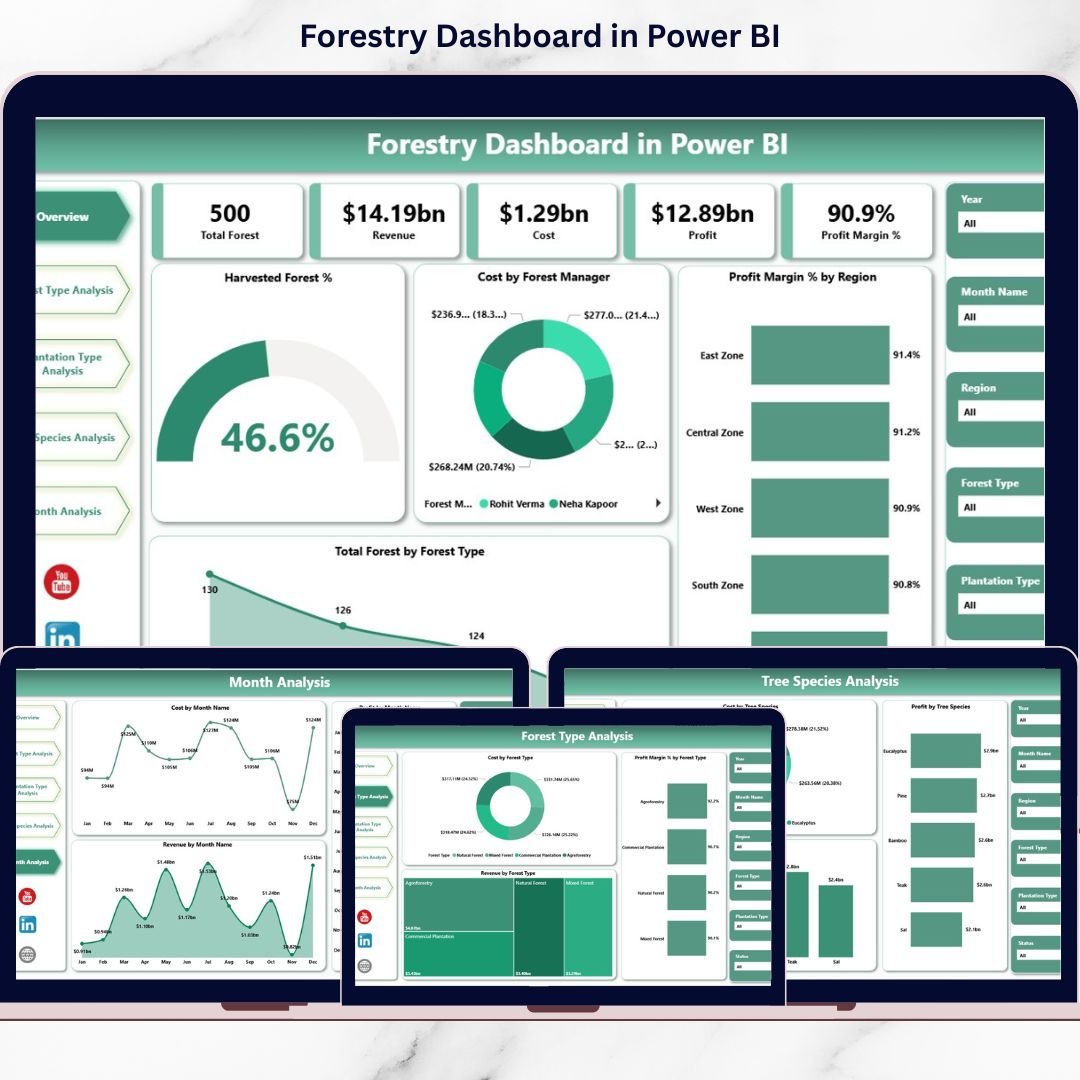
This ready-to-use Power BI dashboard transforms structured forestry data into interactive, visually rich insights. Instead of reviewing multiple spreadsheets, you monitor harvesting percentage, revenue, cost, profit margin, forest type performance, plantation type efficiency, and tree species profitability — all in one centralized system.
Because it connects directly to Excel or other data sources, the dashboard updates automatically. Therefore, forestry businesses move from guesswork to data-driven decision-making.
🔑 Key Features of Forestry Dashboard in Power BI
🌲 5 Interactive Analytical Pages
Structured views for forest type, plantation type, species, and monthly trends.
📊 Executive Overview Page
High-level KPIs for instant leadership insights.
📈 Profitability & Cost Monitoring
Track revenue, cost, and margin across multiple dimensions.
🌍 Regional & Manager-Level Analysis
Compare performance by region and forest manager.
📅 Monthly Trend Tracking
Identify seasonal harvesting and revenue patterns.
🎛️ Dynamic Slicers & Filters
Filter data instantly by region, forest type, plantation type, species, and month.
⚡ Real-Time Data Refresh
Connect to Excel and refresh automatically.
📊 Dashboard Structure – 5 Powerful Pages
1️⃣ Overview Page – Executive Control Center
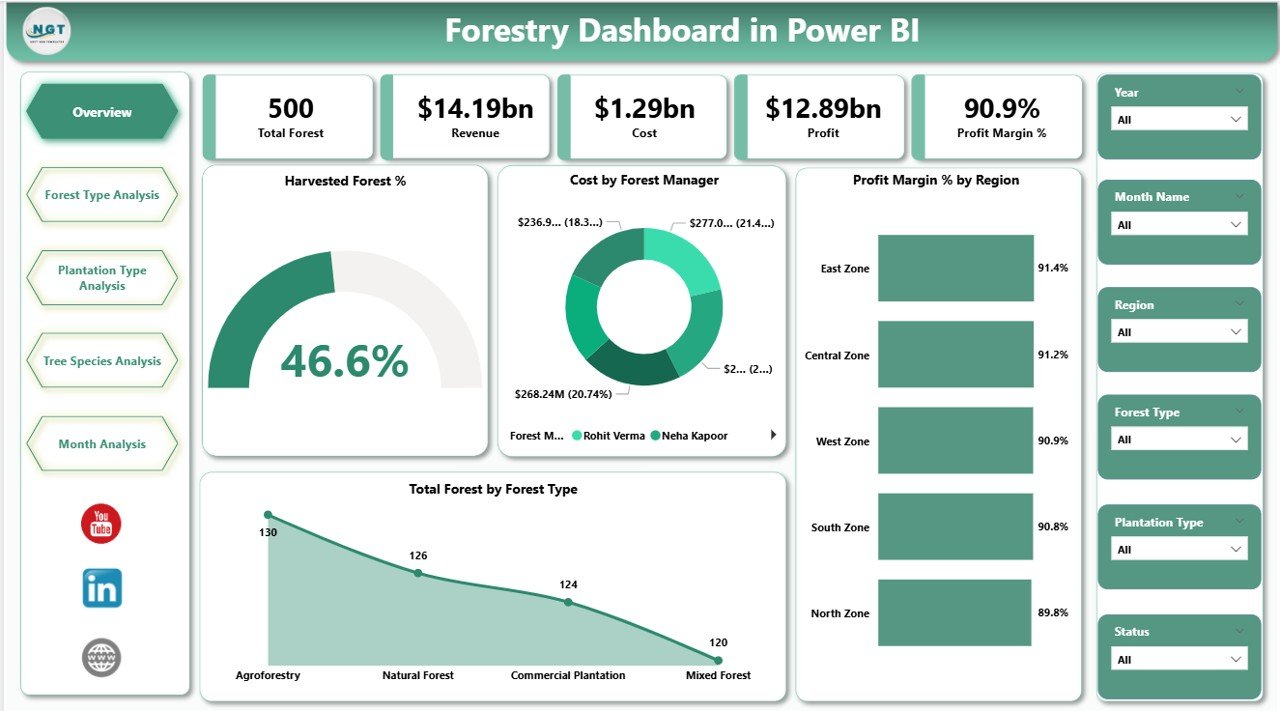
The Overview page provides a complete business snapshot.
🔹 Interactive Slicers
-
Region
-
Forest Type
-
Plantation Type
-
Month
🔹 KPI Cards
-
Harvested Forest %
-
Total Revenue
-
Total Cost
-
Total Profit
-
Profit Margin %
🔹 Visual Highlights
-
Cost by Forest Manager
-
Profit Margin % by Region
-
Total Forest by Forest Type
-
Overall Financial Summary
This page helps executives quickly identify high-cost managers, profitable regions, and harvesting progress.
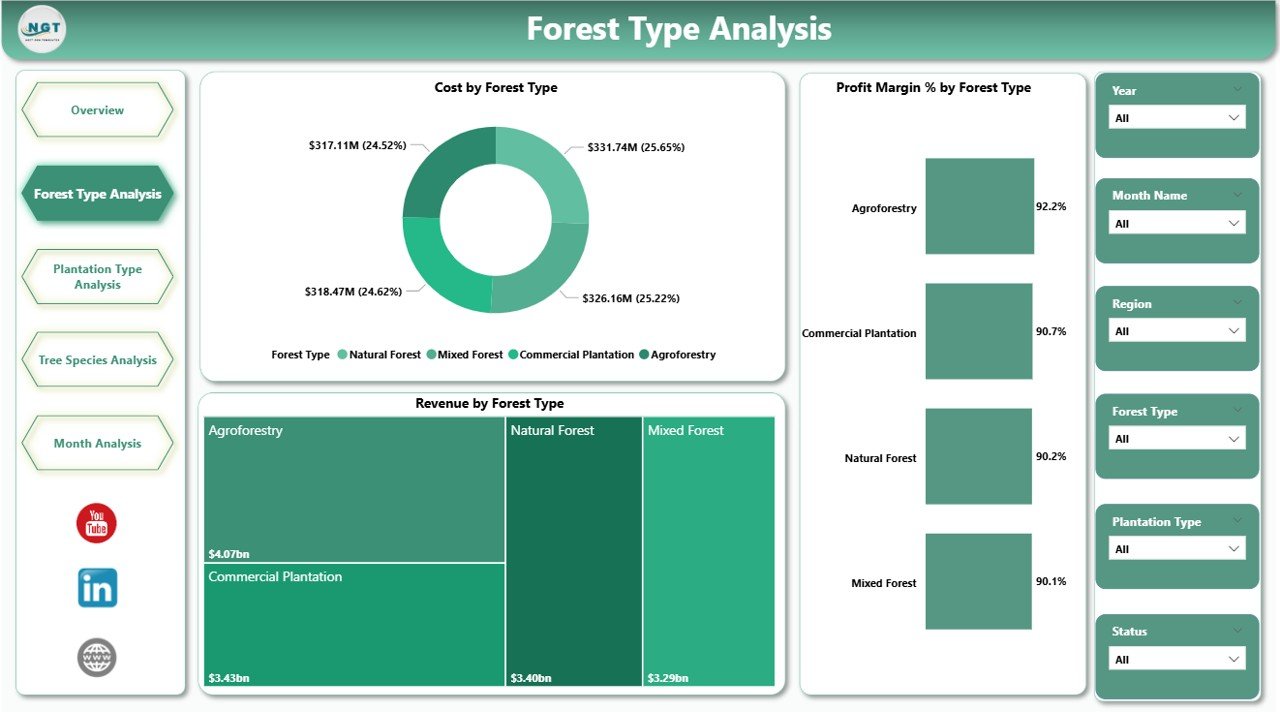
2️⃣ Forest Type Analysis Page
Different forest types behave differently in terms of cost and revenue.
🔹 Charts Include:
-
Revenue by Forest Type
-
Cost by Forest Type
-
Profit Margin % by Forest Type
This page answers:
-
Which forest type generates the highest revenue?
-
Which type has high maintenance cost?
-
Which forest type delivers the best margins?
Managers can allocate budget and resources more effectively.
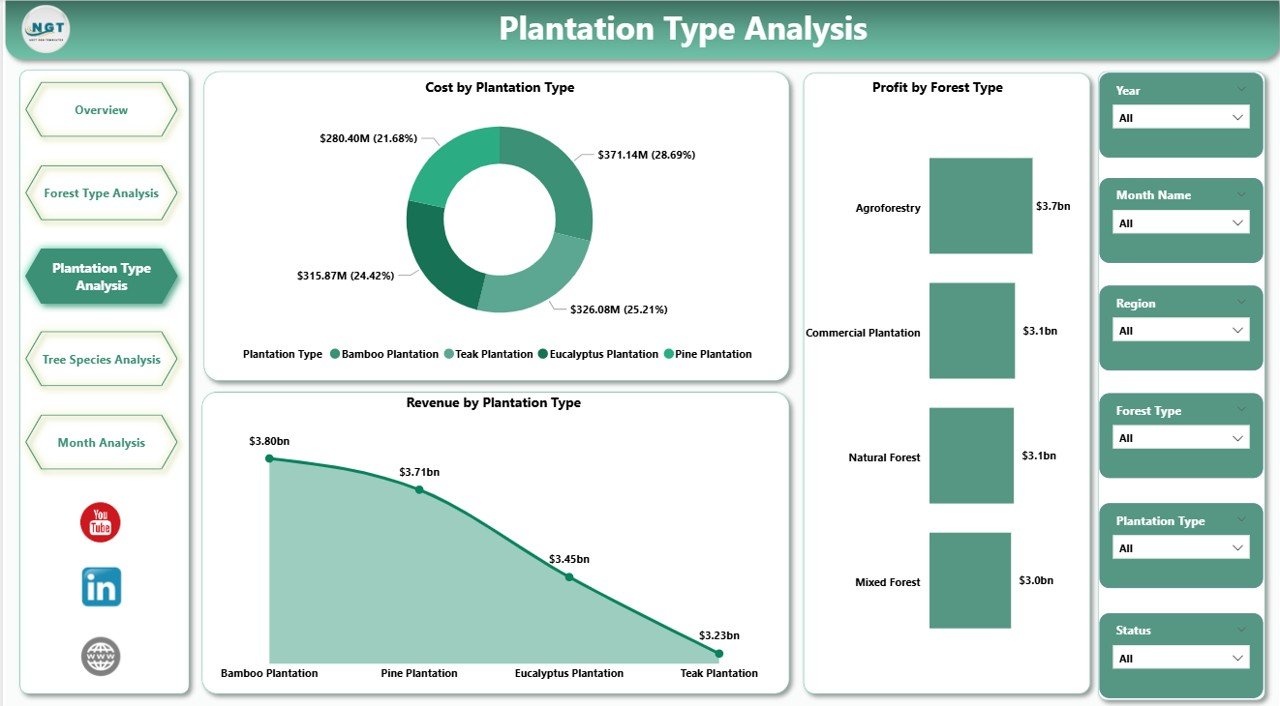
3️⃣ Plantation Type Analysis Page
Plantation strategy directly impacts long-term returns and sustainability.
🔹 Charts Include:
-
Revenue by Plantation Type
-
Cost by Plantation Type
-
Profit by Plantation Type
This page helps evaluate plantation models such as:
-
Commercial Plantation
-
Reforestation Projects
-
Agroforestry
-
Timber Plantations
As a result, companies can optimize long-term plantation planning.
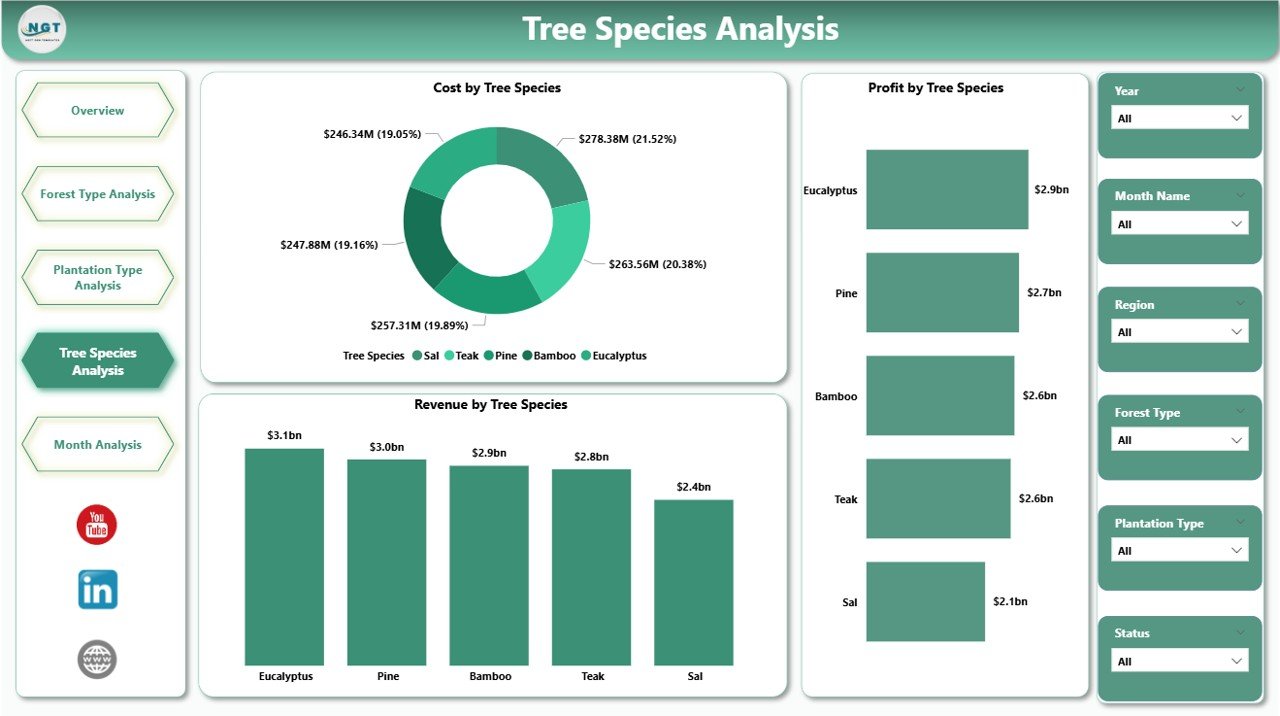
4️⃣ Tree Species Analysis Page
Tree species profitability varies significantly.
🔹 Charts Include:
-
Revenue by Tree Species
-
Cost by Tree Species
-
Profit by Tree Species
This analysis helps you:
-
Identify premium species
-
Detect high-cost species
-
Improve species selection strategy
-
Optimize plantation mix
Strategic species planning increases margins and sustainability.
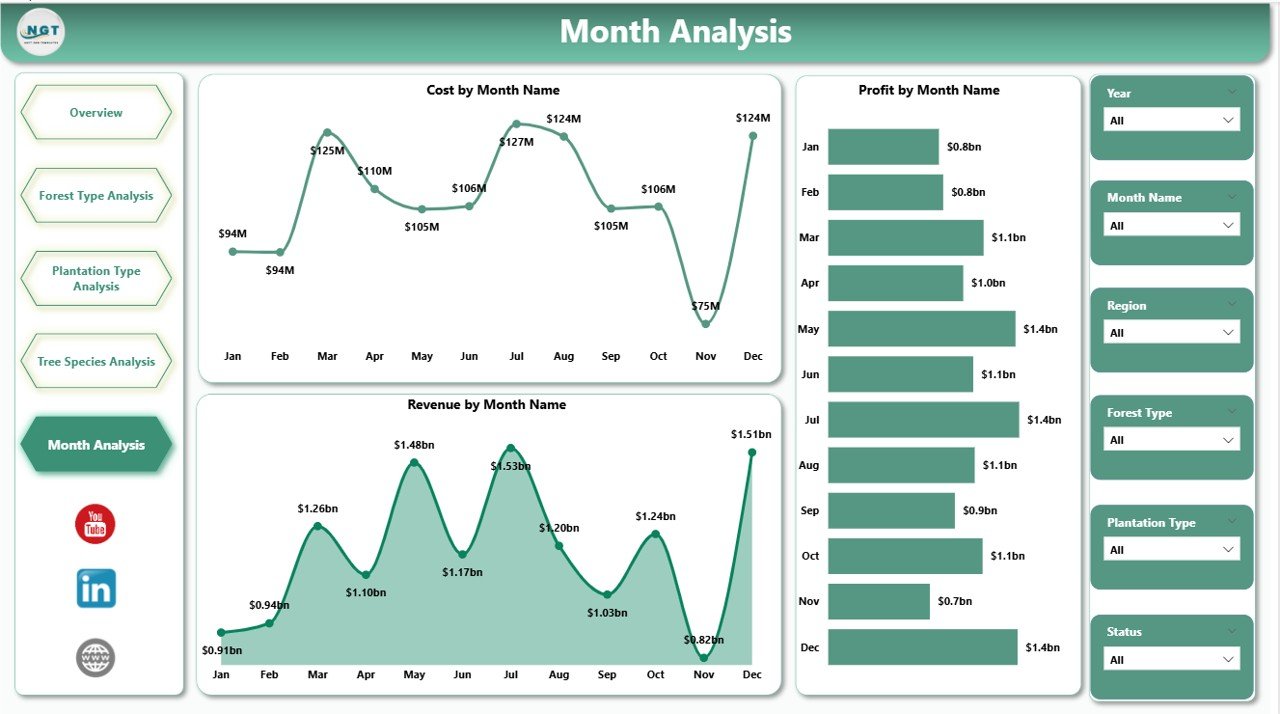
5️⃣ Month Analysis Page
Forestry performance depends heavily on seasonal cycles.
🔹 Charts Include:
-
Revenue by Month
-
Cost by Month
-
Profit by Month
Benefits of this page:
-
Identify peak harvesting seasons
-
Track seasonal cost spikes
-
Forecast revenue patterns
-
Improve budgeting accuracy
Instead of reacting late, you plan ahead.
📌 Key KPIs Included
This dashboard tracks critical forestry performance indicators:
-
Harvested Forest Percentage
-
Total Forest Area
-
Revenue
-
Cost
-
Profit
-
Profit Margin %
-
Revenue by Forest Type
-
Revenue by Plantation Type
-
Revenue by Tree Species
-
Monthly Revenue Trends
These KPIs ensure complete operational and financial visibility.
🚀 Advantages of Forestry Dashboard in Power BI
1️⃣ Real-Time Insights
Instant data refresh supports faster decisions.
2️⃣ Centralized Reporting
All forestry data lives in one structured BI solution.
3️⃣ Improved Profitability Tracking
Identify high-margin forest zones and species quickly.
4️⃣ Better Cost Control
Analyze cost by manager, region, plantation type, and species.
5️⃣ Strategic Planning Support
Use trend data for long-term forestry investment planning.
6️⃣ Sustainability Monitoring
Track harvesting percentage and species distribution.
7️⃣ Interactive & Professional Visuals
Power BI enables drill-down analysis and dynamic filtering.
🛠️ How to Implement the Forestry Dashboard in Power BI
1️⃣ Collect forestry data in Excel
2️⃣ Include fields such as Date, Region, Forest Type, Plantation Type, Tree Species, Revenue, Cost
3️⃣ Import data into Power BI
4️⃣ Create measures for Revenue, Profit, and Margin
5️⃣ Build visuals for 5 structured pages
6️⃣ Add slicers for dynamic filtering
7️⃣ Publish and share with stakeholders
Within a short time, your forestry data becomes actionable intelligence.
👥 Who Should Use This Dashboard?
🌲 Forestry Companies
🌳 Timber Producers
🏞️ Plantation Owners
🌍 Environmental Agencies
📊 Sustainability Managers
💰 Financial Controllers
If you manage forestry performance, cost control, or sustainability planning, this dashboard provides clarity and control.
🔗 Visit our YouTube Channel for Step-by-Step Tutorials
https://youtube.com/@PKAnExcelExpert