The footwear manufacturing industry demands precision, speed, and continuous performance monitoring. Manufacturers must manage production efficiency, quality standards, labor productivity, material usage, delivery timelines, and operational costs simultaneously. However, relying on scattered spreadsheets or manual reporting often leads to delayed decisions and hidden operational issues.
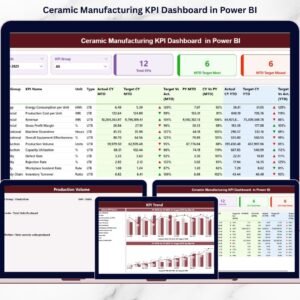
The Footwear Manufacturing KPI Dashboard in Power BI provides a powerful, centralized analytics solution that transforms raw factory data into clear visual insights. Instead of analyzing multiple reports, managers can monitor KPIs, compare targets with actual performance, and evaluate trends using one interactive dashboard.
This ready-to-use Power BI dashboard helps manufacturing teams gain real-time visibility, improve productivity, and make smarter data-driven decisions without complex reporting processes.
⭐ Key Feature of Footwear Manufacturing KPI Dashboard in Power BI
📊 Centralized KPI Monitoring
Track all manufacturing KPIs from one interactive dashboard.
⚡ Real-Time Performance Insights
Instantly analyze factory performance using dynamic visuals.
📅 MTD & YTD Analysis
Monitor both monthly and yearly performance simultaneously.
🎯 Target vs Actual Comparison
Quickly identify underperforming and high-performing KPIs.
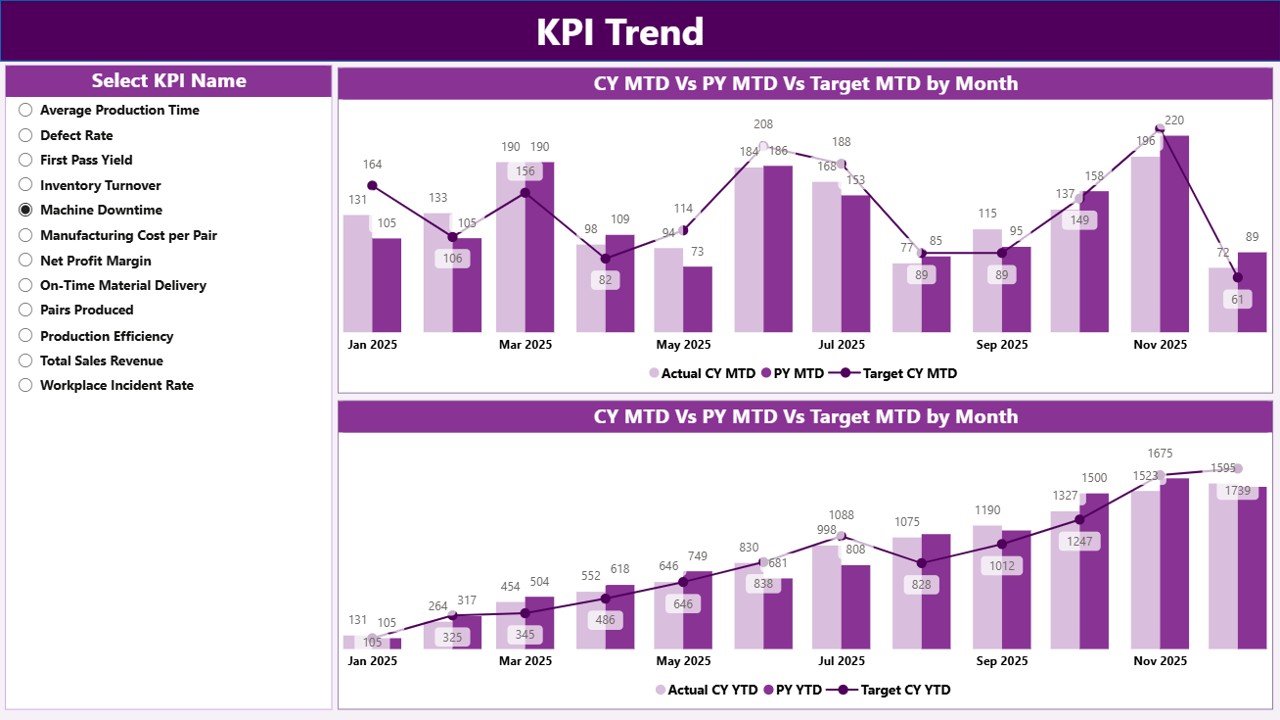
📈 Trend Analysis Visualization
Analyze performance patterns using interactive charts.
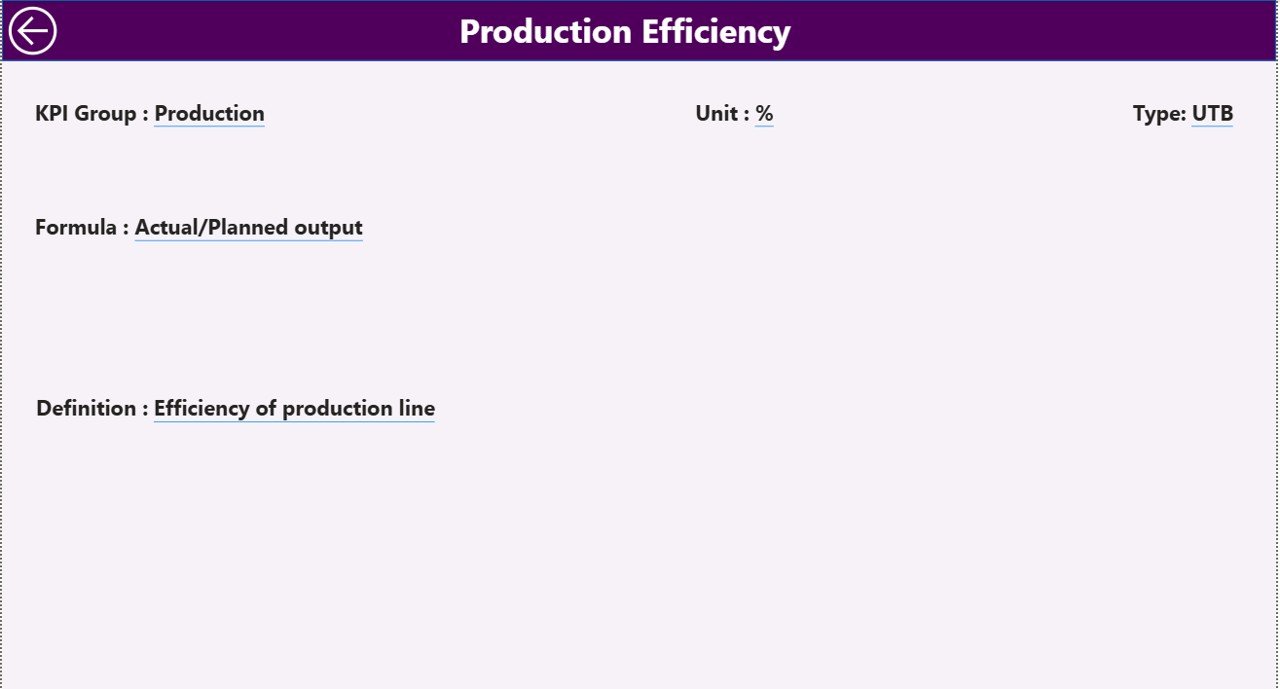
🔎 Drill-Through KPI Definitions
View KPI formulas and logic directly within the dashboard.
🧩 Interactive Slicers & Filters
Filter data by month or KPI group instantly.
🔄 Excel-Based Data Integration
Update Excel input files and refresh Power BI automatically.
📂 What’s Inside the Footwear Manufacturing KPI Dashboard
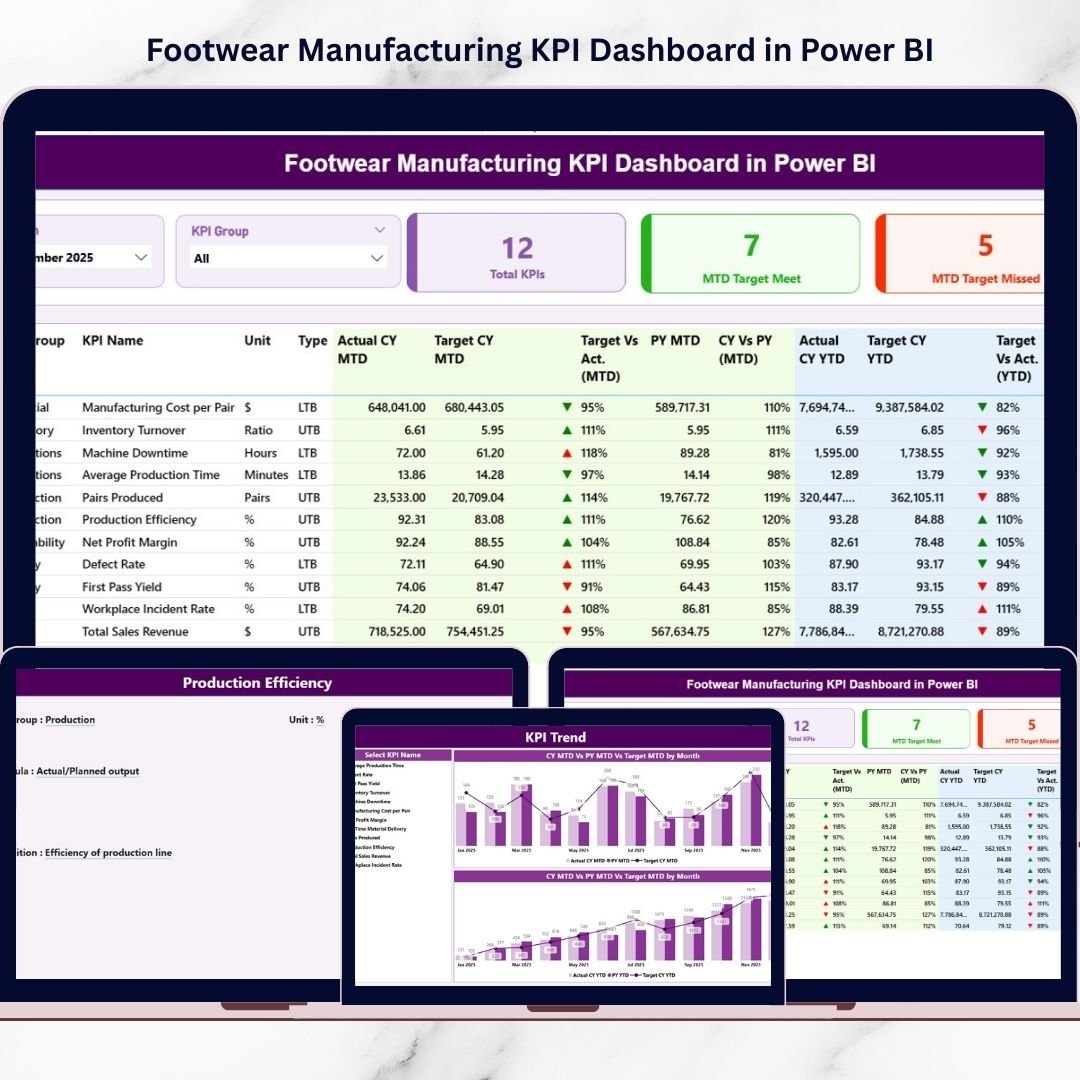
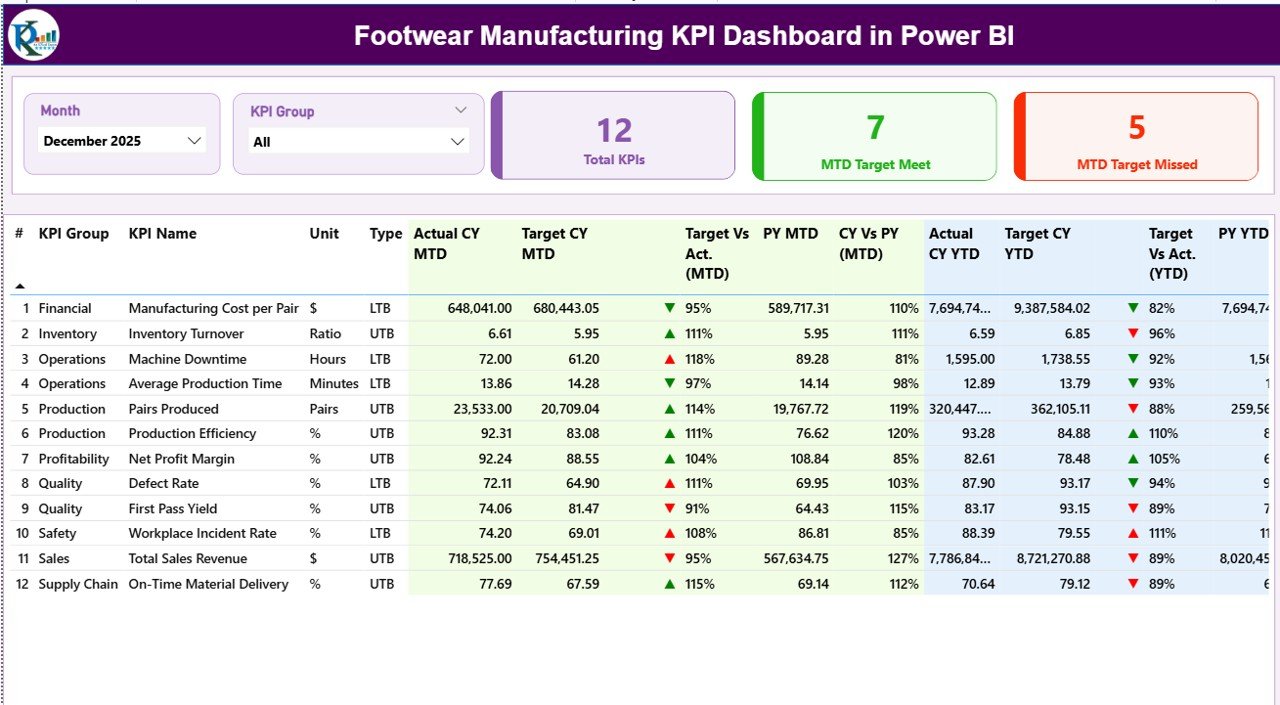
The dashboard includes three structured analytical pages:
✔️ Summary Page – Central performance monitoring hub with KPI cards and detailed KPI table
✔️ KPI Trend Page – Visual analysis of MTD and YTD performance trends
✔️ KPI Definition Page – Drill-through page containing KPI formulas and explanations
Additionally, the dashboard connects to an Excel data source containing:
-
Input_Actual Sheet (actual KPI values)
-
Input_Target Sheet (target values)
-
KPI Definition Sheet (KPI structure and logic)
Together, these components create a complete manufacturing analytics system.
🛠️ How to Use the Footwear Manufacturing KPI Dashboard
Follow these simple steps:
Step 1: Define KPIs in the KPI Definition sheet
Step 2: Enter target values in Input_Target
Step 3: Add actual performance data in Input_Actual
Step 4: Refresh Power BI dataset
Step 5: Select month or KPI group using slicers
Step 6: Analyze insights and take corrective actions
Once updated, all visuals refresh automatically.
📊 Who Can Benefit from This Dashboard?
This dashboard is ideal for:
✅ Factory Managers
✅ Production Supervisors
✅ Operations Heads
✅ Quality Control Teams
✅ Supply Chain Managers
✅ Manufacturing Analysts
✅ Business Owners & Consultants
Both small factories and large manufacturing units can implement it easily.
🚀 Advantages of Footwear Manufacturing KPI Dashboard in Power BI
✔️ One unified view of manufacturing performance
✔️ Faster and smarter decision-making
✔️ Early detection of production issues
✔️ Improved accountability across departments
✔️ Automated reporting and reduced manual work
✔️ Historical and trend comparison analysis
✔️ Scalable solution for future KPIs
Because Power BI provides interactive analytics, decision-makers gain deeper insights without technical complexity.
💡 Best Practices for Maximum Results
-
Track only actionable KPIs
-
Maintain standardized KPI definitions
-
Update Excel data regularly
-
Focus on trend analysis, not only numbers
-
Use visual indicators consistently
-
Train teams on dashboard interpretation
-
Review KPIs periodically
Following these practices ensures reliable and meaningful analytics.
📘 Click hare to read the Detailed blog post
📺 Visit our YouTube channel to learn step-by-step video tutorials
👉 https://Youtube.com/@PKAnExcelExpert