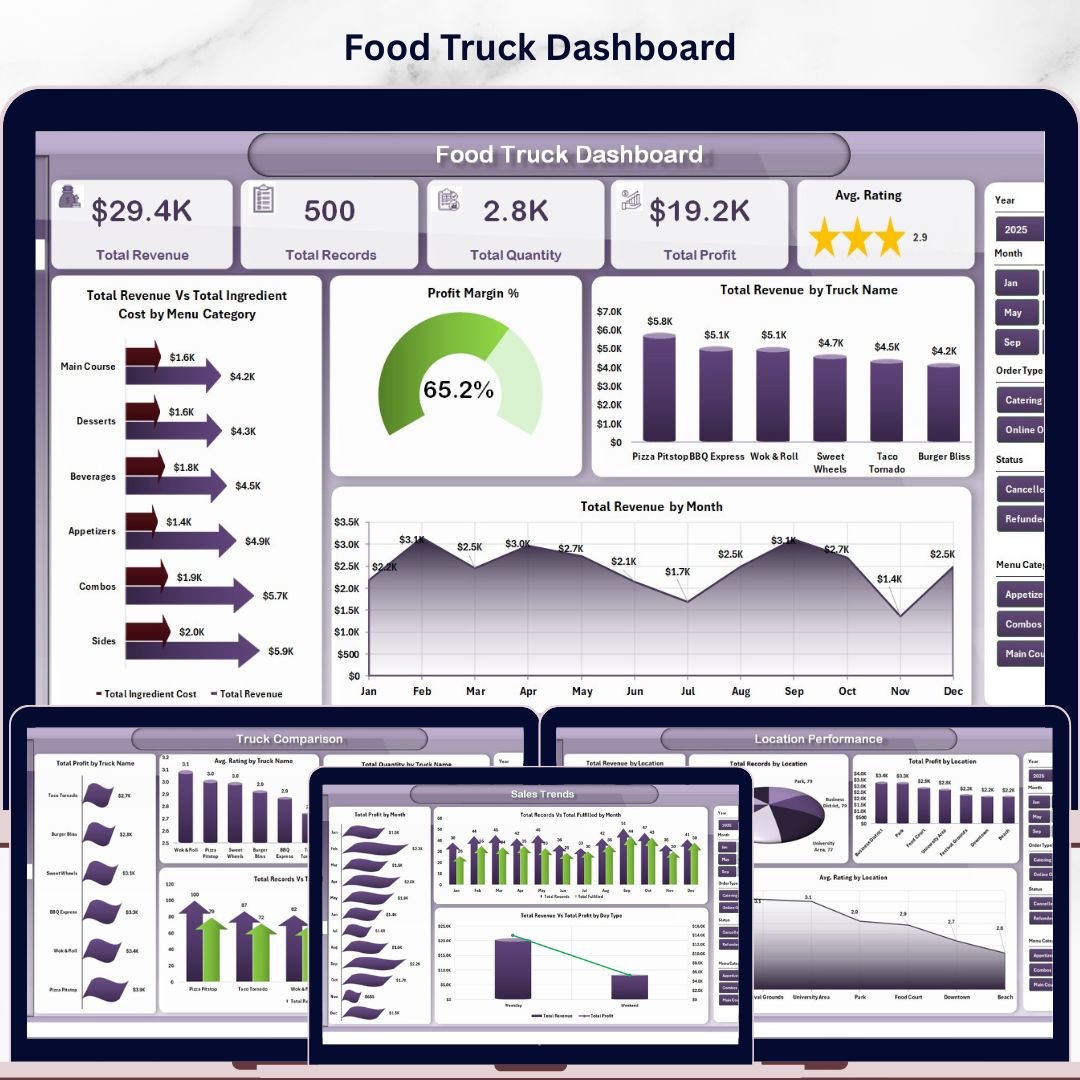
Food Truck Dashboard in Excel
Running a food truck business means juggling menus, locations, trucks, and daily sales — all while staying profitable. Our Food Truck Dashboard in Excel brings all your key metrics into one powerful, interactive workbook so you can make smarter decisions faster.
This dashboard is built on pivot tables and slicers, so every chart updates dynamically when you refresh your data. No VBA, no complex setup — just paste your data and hit Refresh All.
What’s Inside This Dashboard
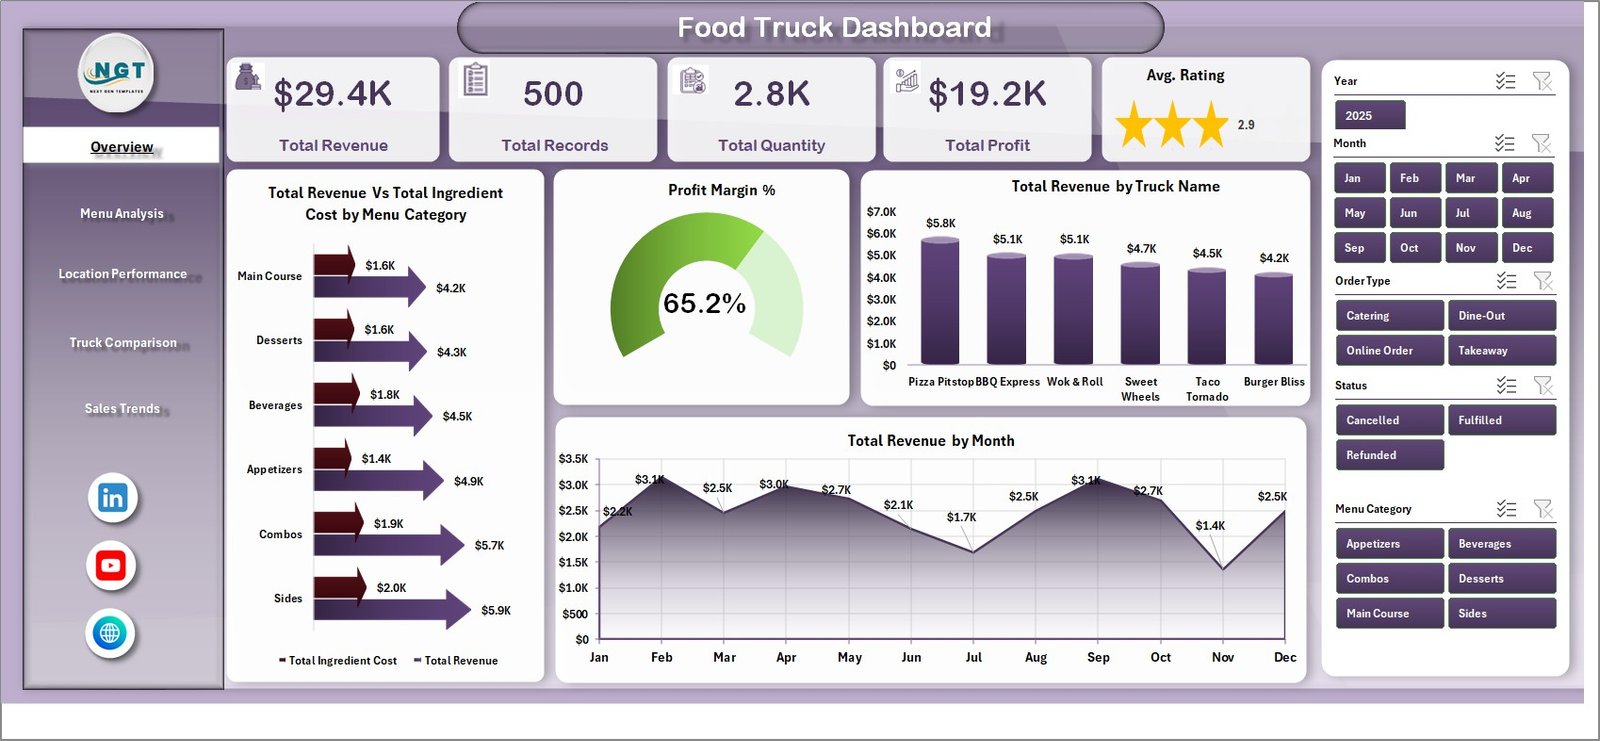
1. Overview Page
Get a bird’s-eye view of your entire food truck operation. The top section features KPI cards showing:
- Total Revenue – Overall income across all trucks and locations
- Total Records – Count of all sales transactions
- Total Quantity – Total items sold across your fleet
- Total Profit – Net earnings after ingredient costs
- Avg. Rating – Average customer satisfaction score
Below the cards, interactive charts provide deeper insights:
- Total Revenue Vs Total Ingredient Cost by Menu Category – Compare how much each menu category earns against its ingredient spend to spot your most and least profitable categories at a glance.
- Profit Margin % – Visualize the margin percentage to quickly identify which segments deliver the best returns on your food costs.
- Total Revenue by Truck Name – See which trucks are your top earners and which ones may need operational improvements or menu adjustments.
- Total Revenue by Month – Track monthly revenue trends to identify seasonal patterns, peak months, and slow periods for better planning.
Multiple slicers let you filter the entire dashboard by truck, location, menu category, and more.
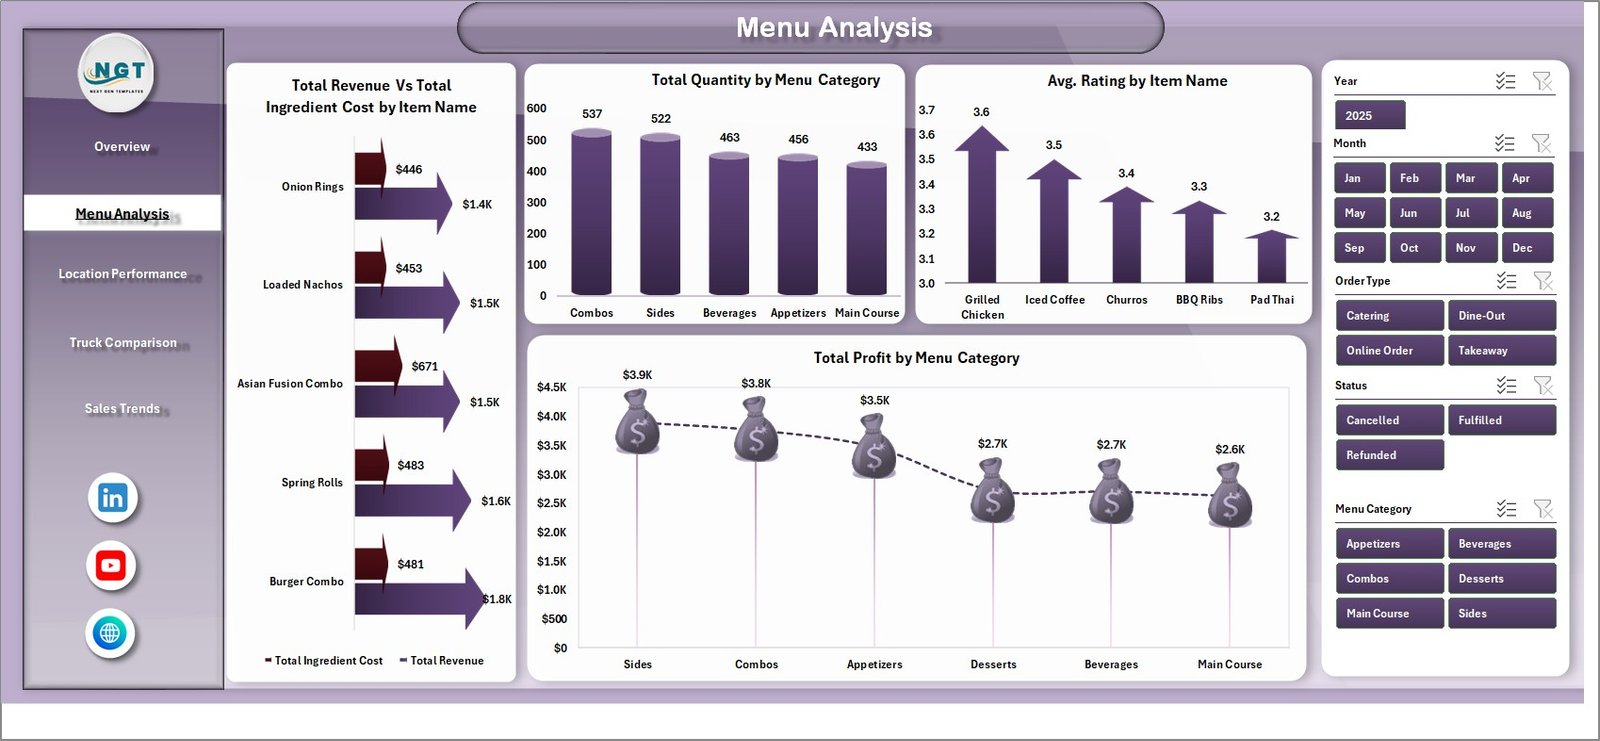
2. Menu Analysis
Dive deep into your menu performance with dedicated charts:
- Total Revenue Vs Total Ingredient Cost by Item Name – Evaluate individual menu items to see which ones generate the most revenue relative to their ingredient costs.
- Total Quantity by Menu Category – Understand which categories drive the highest volume of sales across your trucks.
- Avg. Rating by Item Name – Identify your customers’ favorite items and spot underperformers that may need recipe tweaks or removal.
- Total Profit by Menu Category – Focus on the categories that contribute most to your bottom line and optimize your menu mix accordingly.
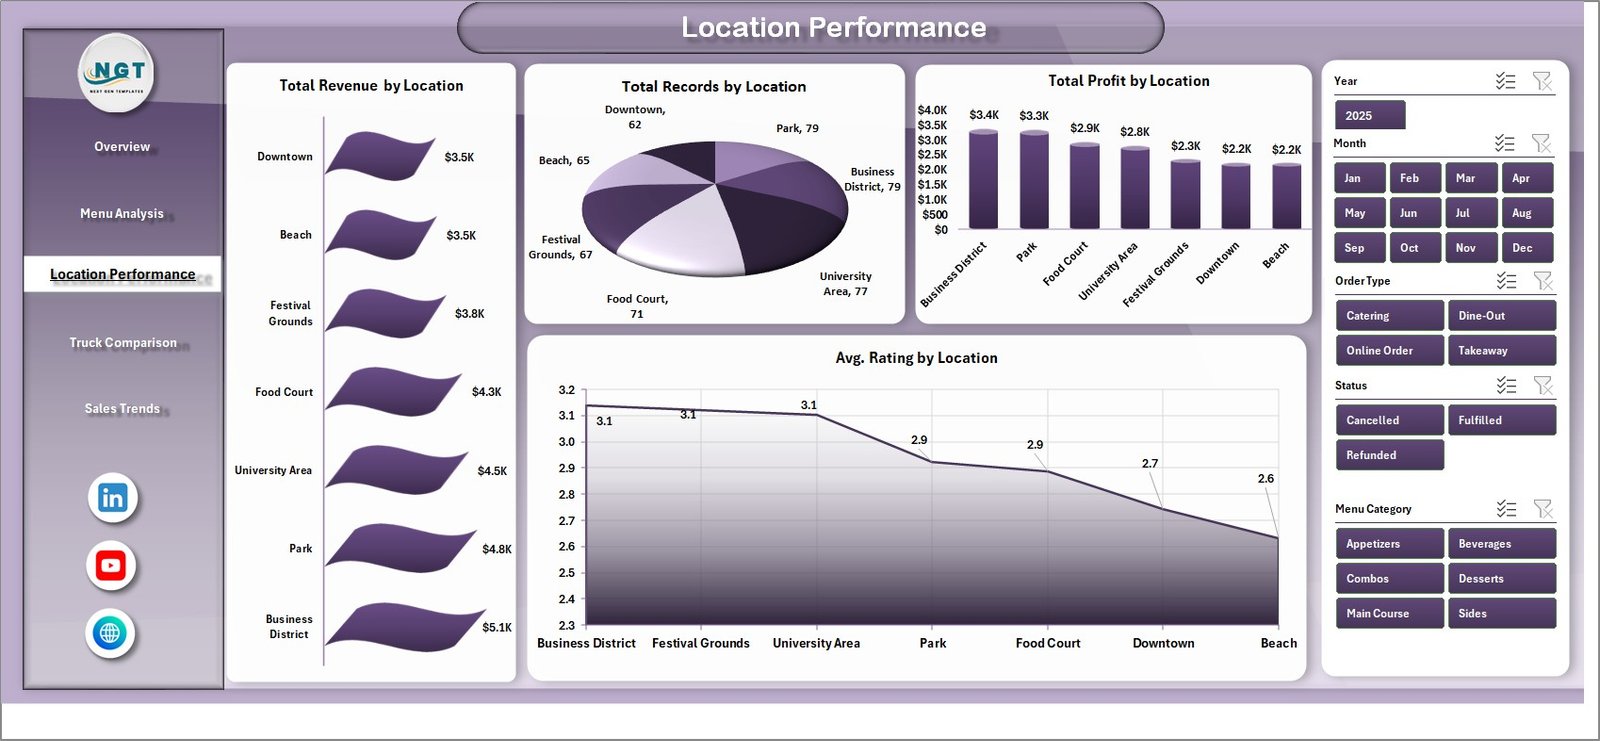
3. Location Performance
Understand how each location performs with these breakdowns:
- Total Revenue by Location – Compare earnings across all your operating locations to find your highest-revenue spots.
- Total Records by Location – See transaction volume by location to gauge foot traffic and customer engagement.
- Total Profit by Location – Identify which locations are most profitable after accounting for ingredient and operational costs.
- Avg. Rating by Location – Monitor customer satisfaction at each spot to maintain quality standards across your route.
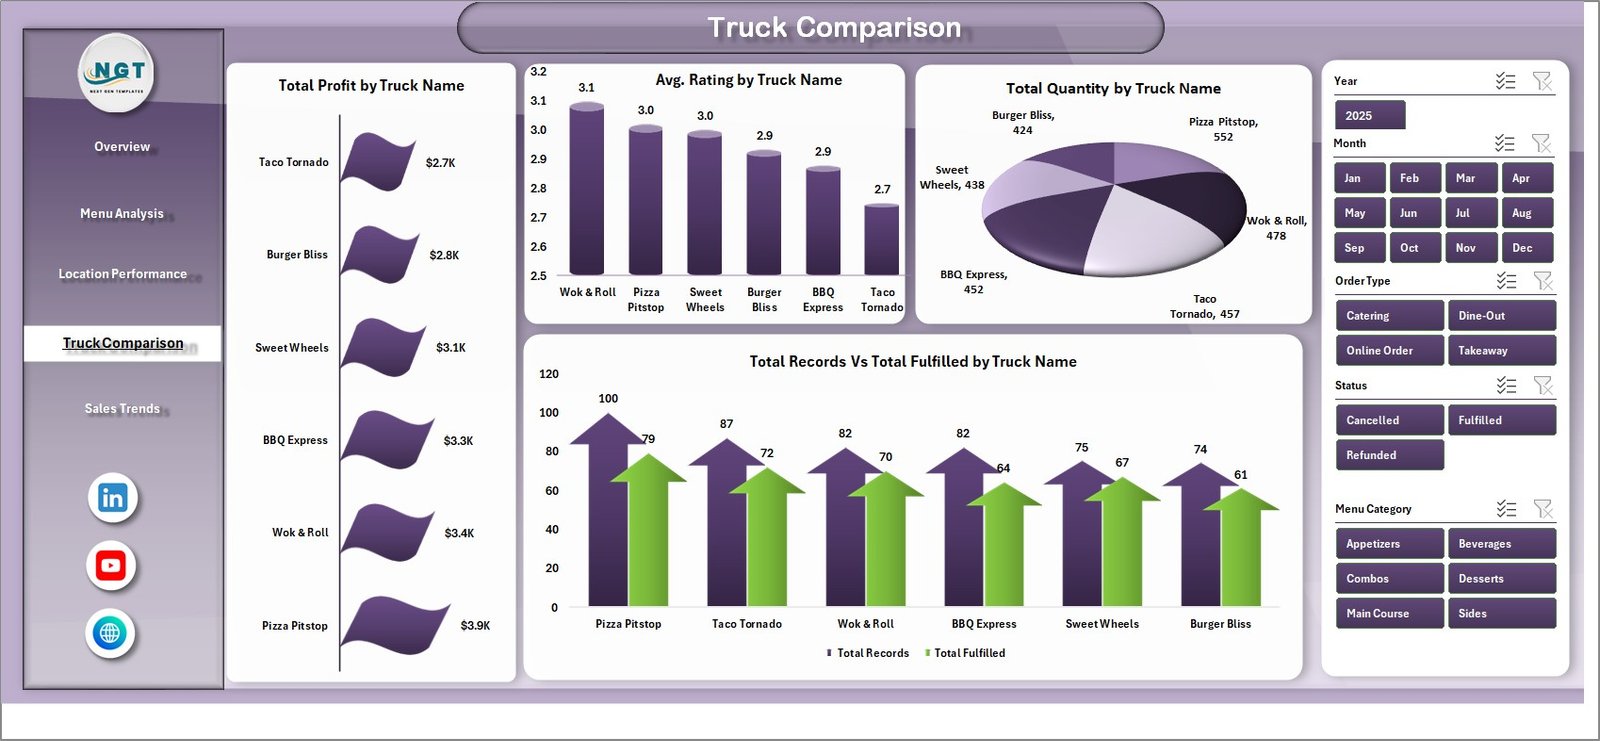
4. Truck Comparison
Compare your fleet performance side by side:
- Total Profit by Truck Name – Rank your trucks by profitability to see which vehicles deliver the best financial results.
- Avg. Rating by Truck Name – Compare customer satisfaction scores across trucks to identify service quality differences.
- Total Quantity by Truck Name – Track sales volume per truck to optimize staffing and inventory allocation.
- Total Records Vs Total Fulfilled by Truck Name – Monitor order fulfillment rates to spot operational bottlenecks or waste issues per truck.
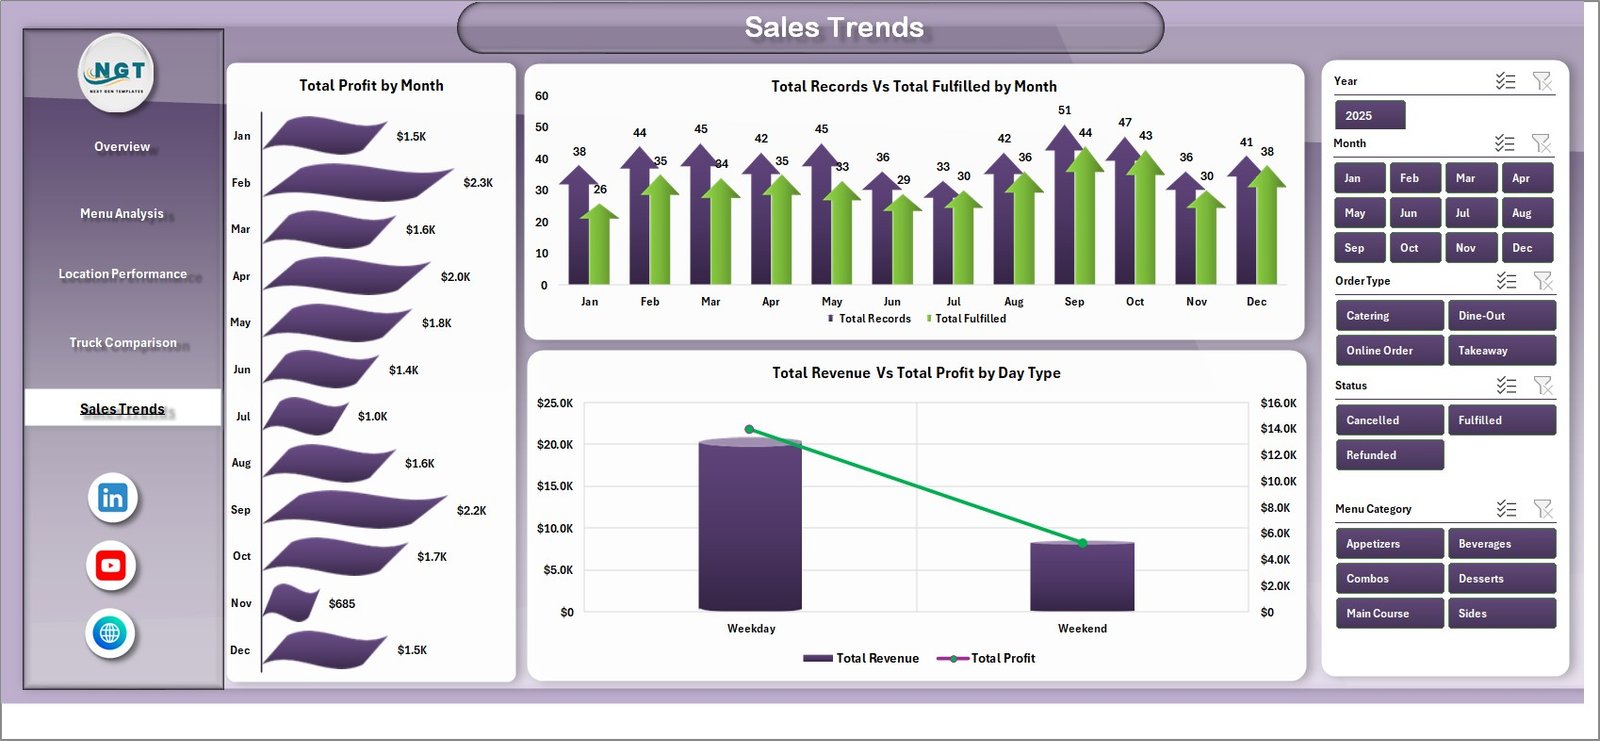
5. Sales Trends
Spot patterns and plan ahead with time-based analysis:
- Total Profit by Month – Track monthly profit trends to plan staffing, inventory purchases, and seasonal menu changes.
- Total Records Vs Total Fulfilled by Month – Compare orders received versus fulfilled over time to identify fulfillment gaps and improve operations.
- Total Revenue Vs Total Profit by Day Type – Analyze weekday versus weekend performance to optimize your schedule and maximize earnings on your best days.
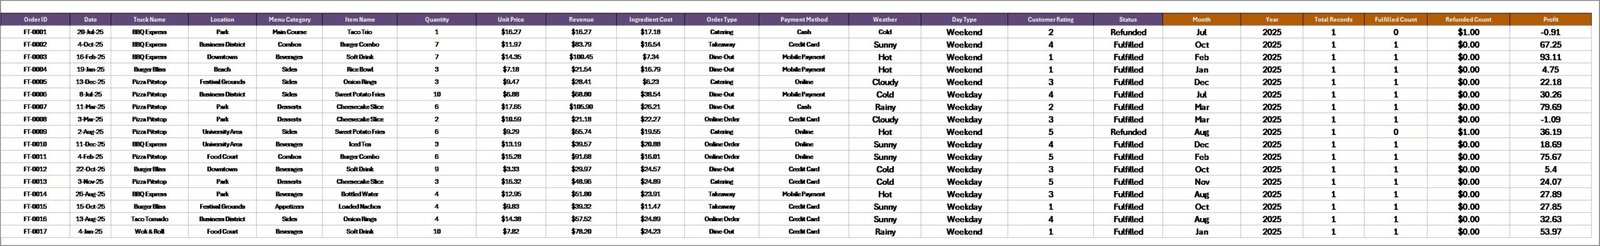
6. Data Sheet
This is where your raw data lives. Simply add your food truck transaction records in the same format — including truck name, location, menu item, category, quantity, revenue, ingredient cost, rating, and more. Keep the column structure intact for seamless dashboard updates.
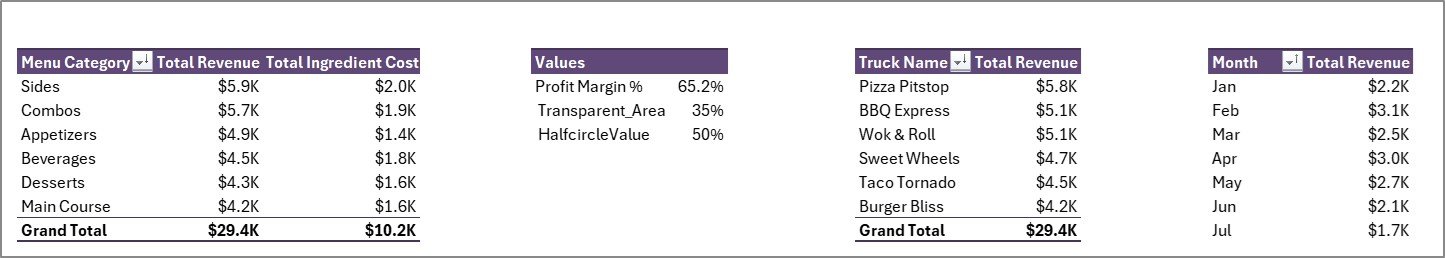
7. Support Sheet
This hidden sheet powers the entire dashboard. It contains multiple pivot tables that feed every chart and KPI card. After updating your data, simply go to the Data tab in the Excel ribbon and click Refresh All — every pivot table and chart updates automatically. You can keep this sheet hidden during normal use.
Key Features
- 7 professionally designed sheet tabs
- Dynamic pivot tables and pivot charts
- Interactive slicers for instant filtering
- KPI cards with key business metrics
- No VBA or macros — pure Excel formulas and pivots
- Just update data and click Refresh All
- Works with Excel 2016 and later
Who Is This For?
- Food truck owners and operators
- Mobile food business managers
- Street food entrepreneurs
- Food truck fleet managers
- Restaurant owners exploring mobile food operations
Download now and take full control of your food truck business data!
👉 Read the detailed blog post about this dashboard


Reviews
There are no reviews yet.