
Key Features of Food Supply Chain KPI Scorecard
Unlock the full potential of your food supply chain management with our Food Supply Chain KPI Scorecard, a ready-to-use, comprehensive digital template designed to streamline your performance tracking and decision-making process. This scorecard offers a powerful interface to monitor, analyze, and improve your supply chain KPIs effortlessly.
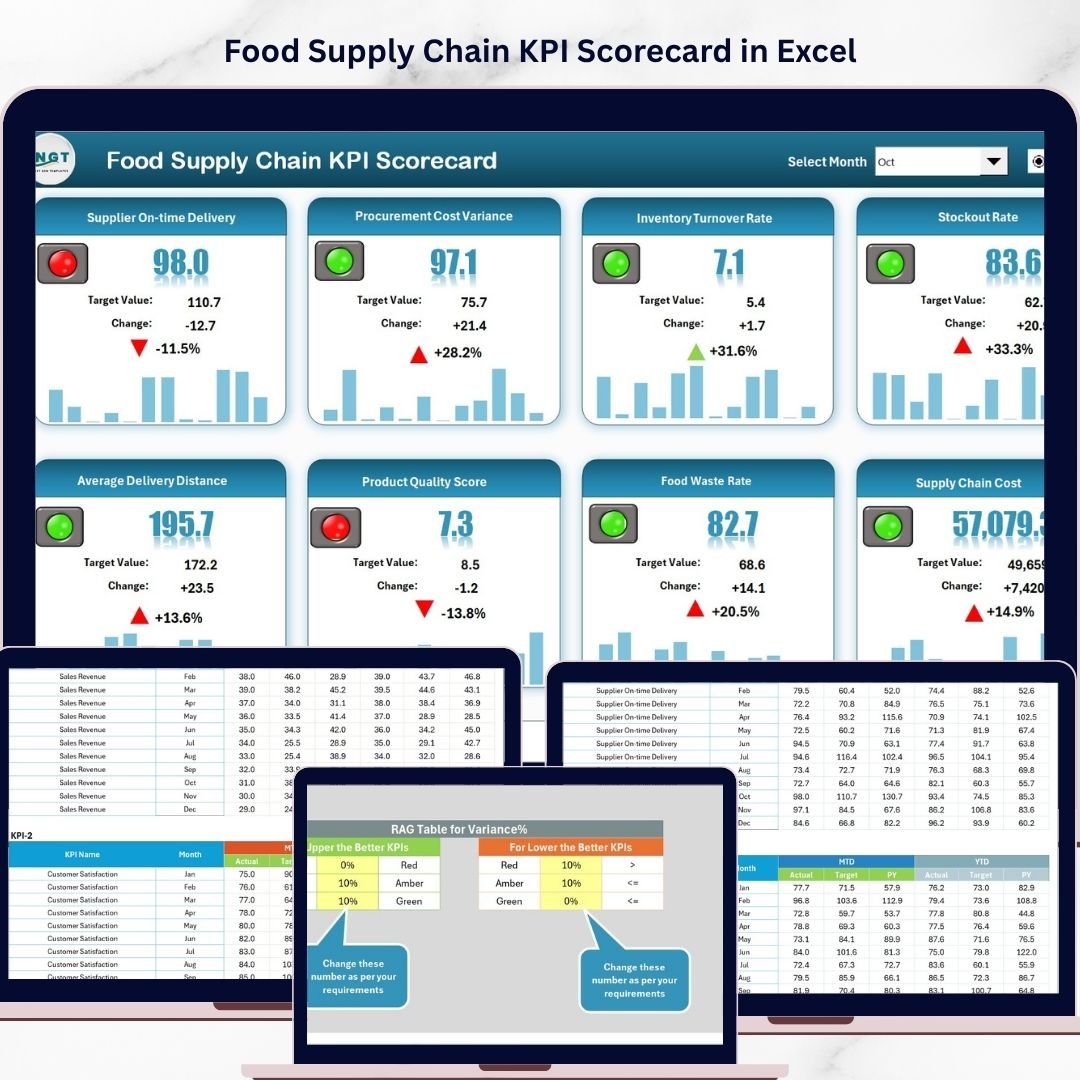
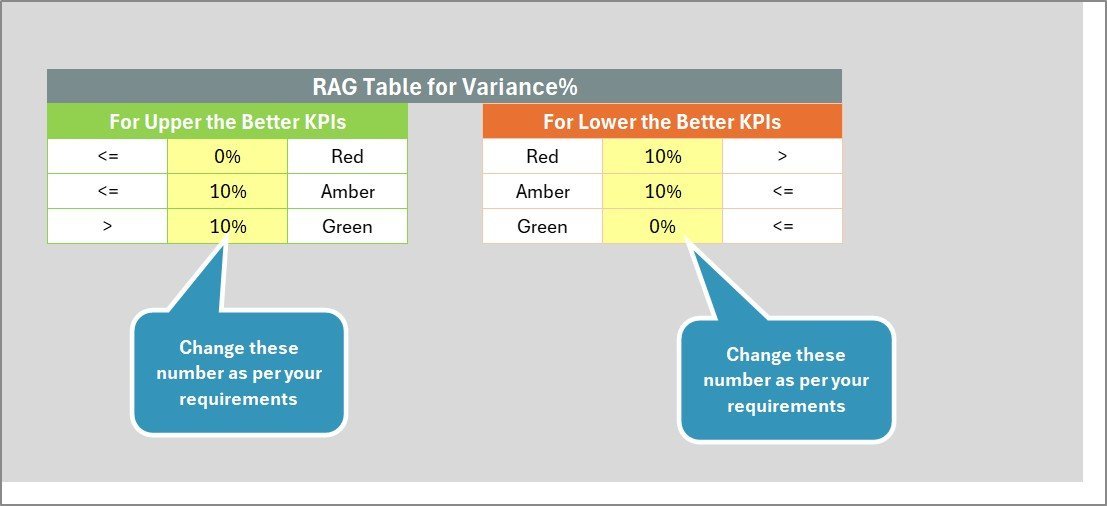
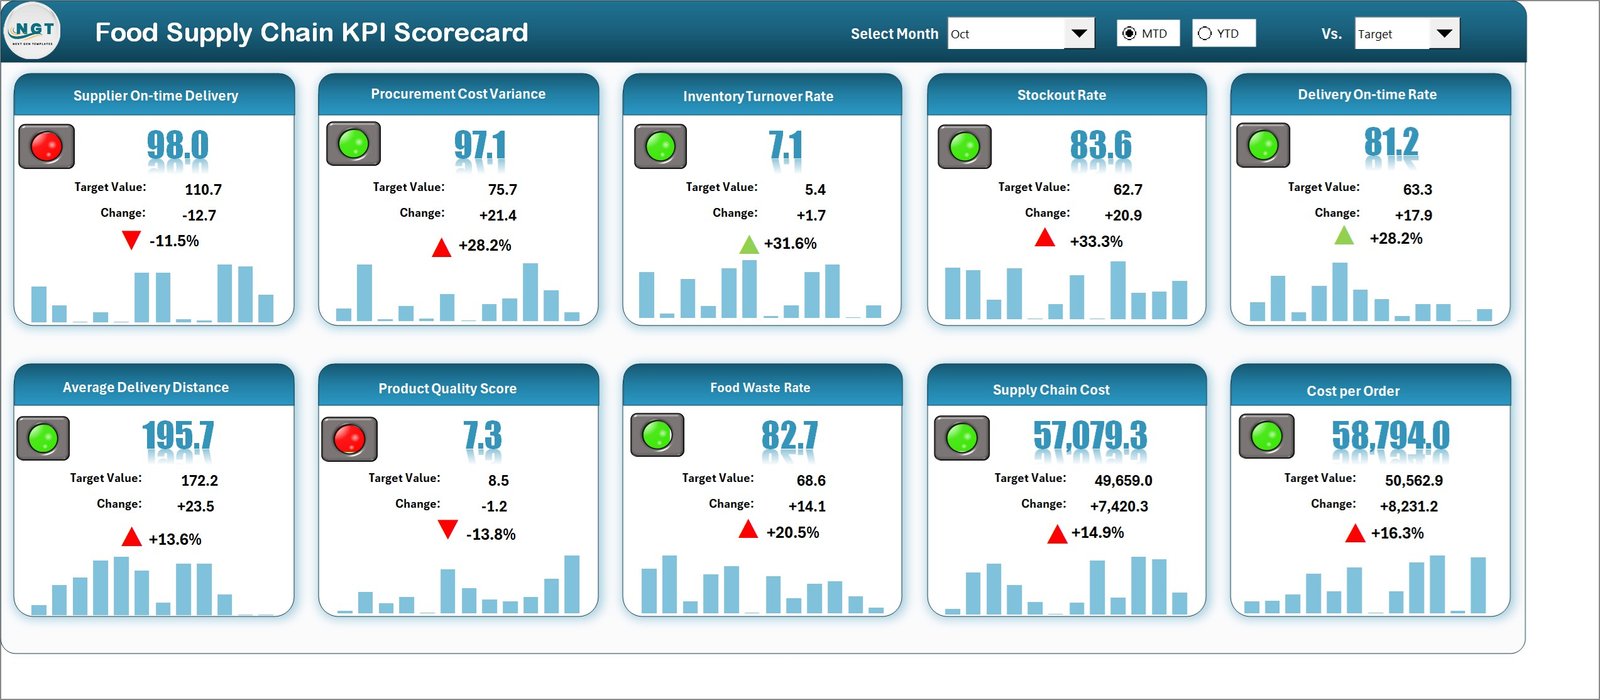
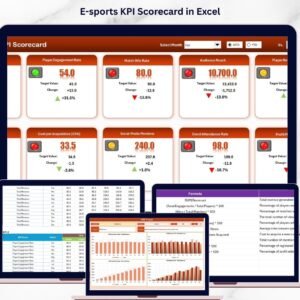
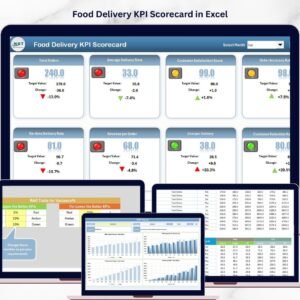
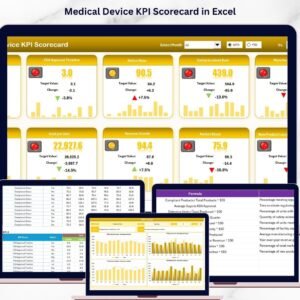
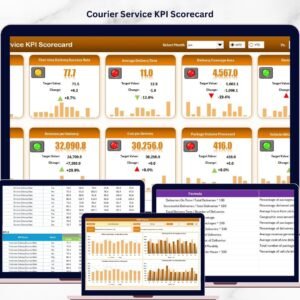
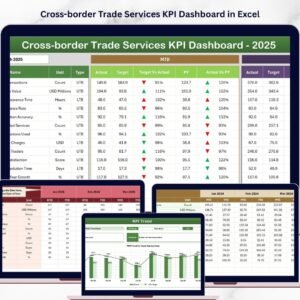
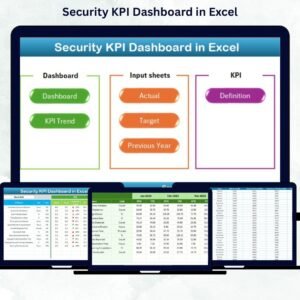
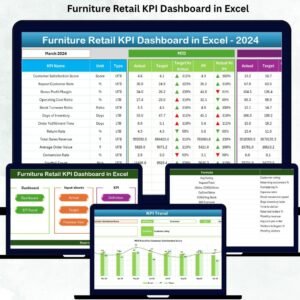
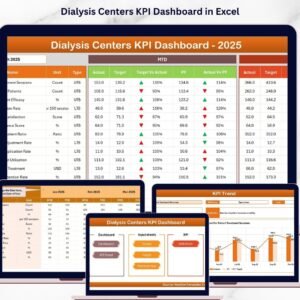
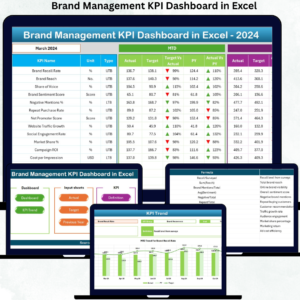
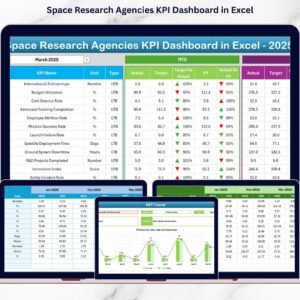
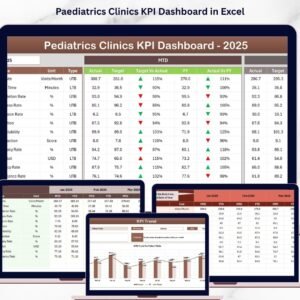
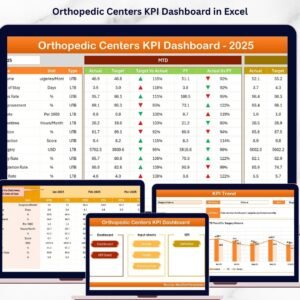
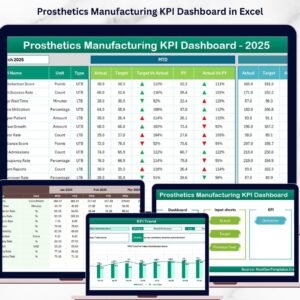
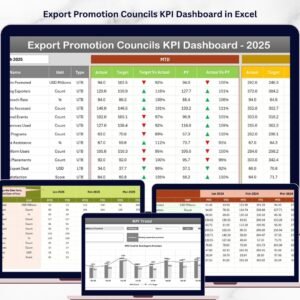
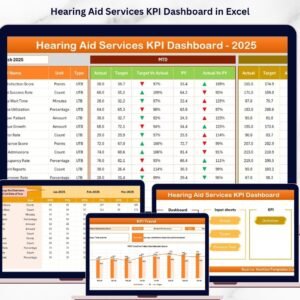
With four intuitive worksheets, the scorecard provides a detailed and dynamic overview of your supply chain’s health, helping you stay ahead in a competitive market. The Scorecard Sheet serves as the main dashboard, featuring dropdown menus to select performance views by month, MTD (Month-to-Date), or YTD (Year-to-Date), allowing you to compare actual vs target values quickly. Visual indicators with color-coded cues give immediate insight into KPI performance, making it easier to identify areas needing attention.
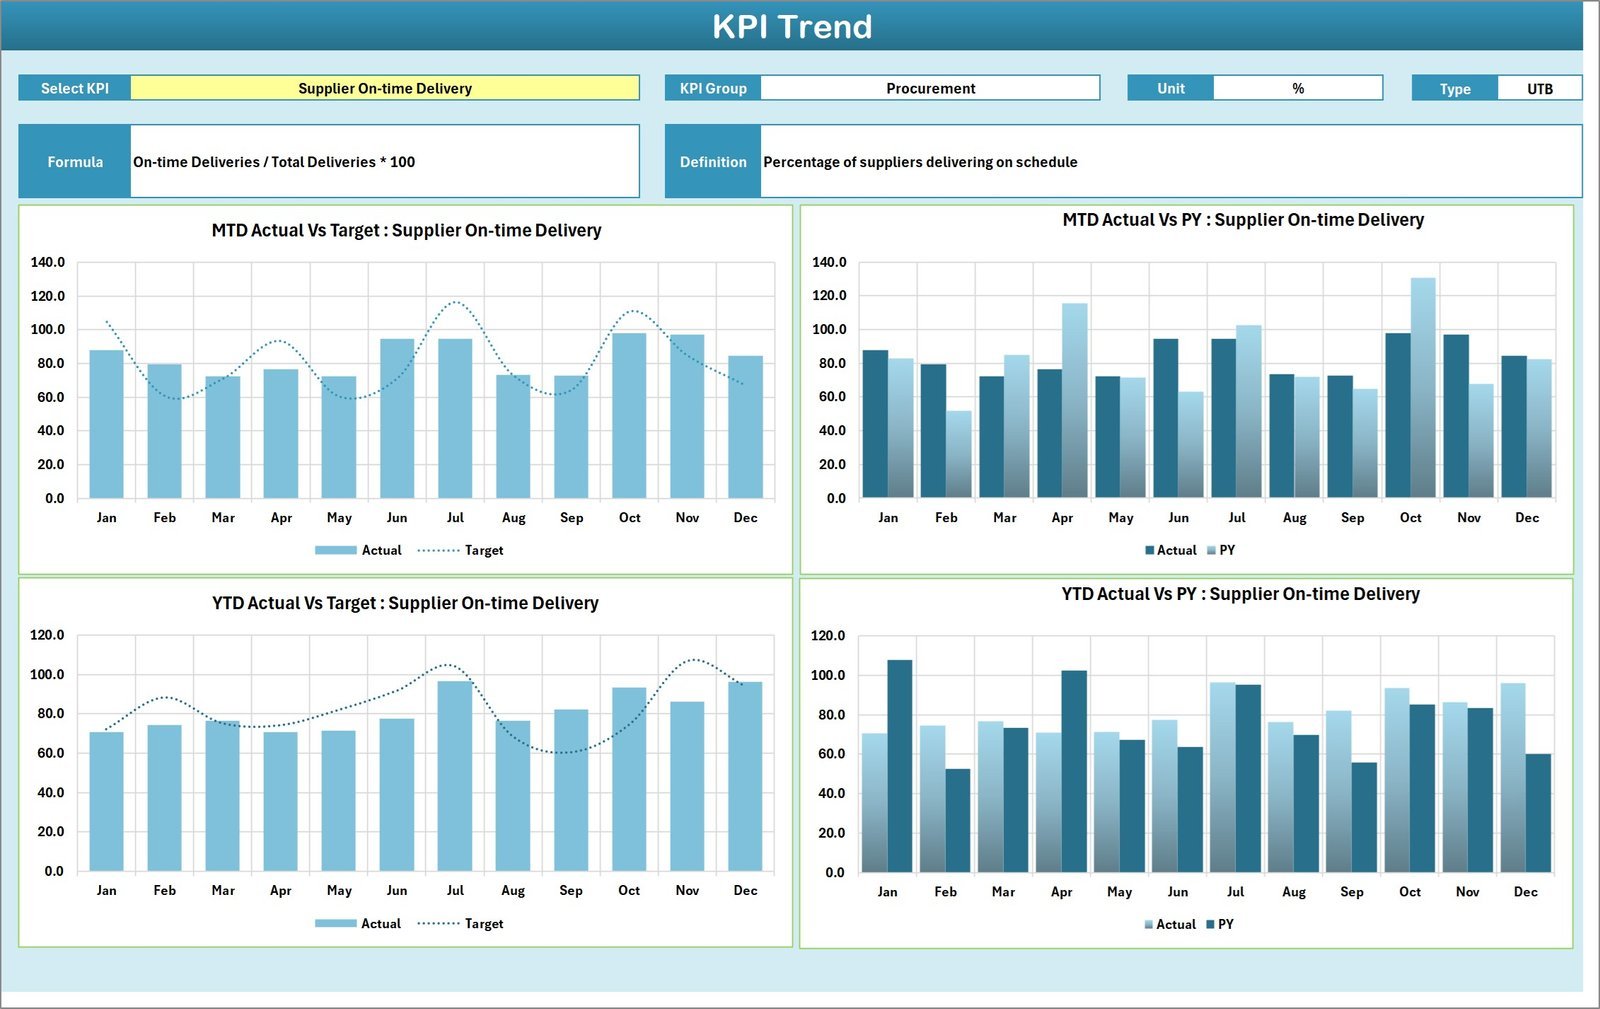
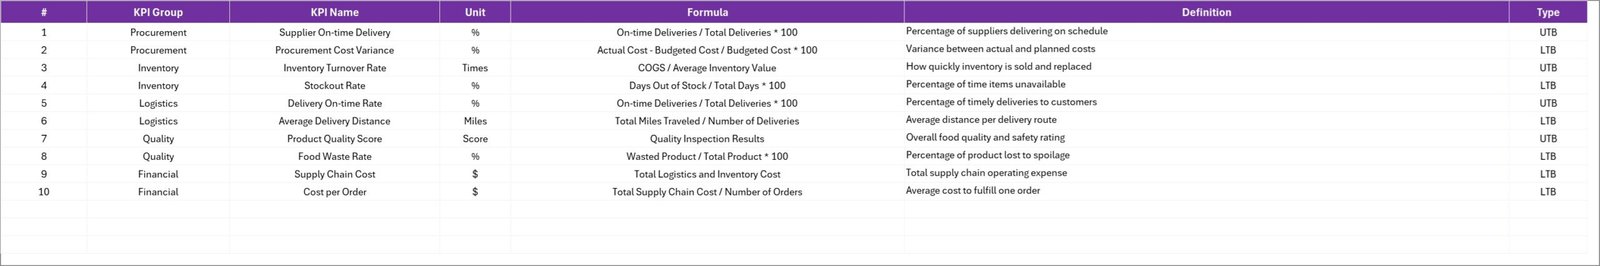
The KPI Trend Sheet lets you select any KPI from a dropdown menu to examine its trends over time, including MTD and YTD charts for actual, target, and prior year (PY) data. You’ll also find detailed KPI metadata such as KPI Group, Unit, Type (whether lower or upper is better), formula, and definition, ensuring you fully understand each metric’s impact.
Data management is simple with the Input Data Sheet, where you can record all KPI values, targets, and other relevant data. This sheet is designed for easy updates, keeping your scorecard current and actionable. Finally, the KPI Definition Sheet enables you to customize or add new KPIs by entering their name, group, unit, formula, and definition, providing flexibility to tailor the template exactly to your business needs.
What’s Inside the Food Supply Chain KPI Scorecard
- 🗓️ Scorecard Sheet: A dynamic dashboard with dropdown filters, actual vs target comparisons, and visual performance indicators.
- 📈 KPI Trend Sheet: Interactive trend charts showcasing monthly and yearly KPI performance with detailed KPI metadata.
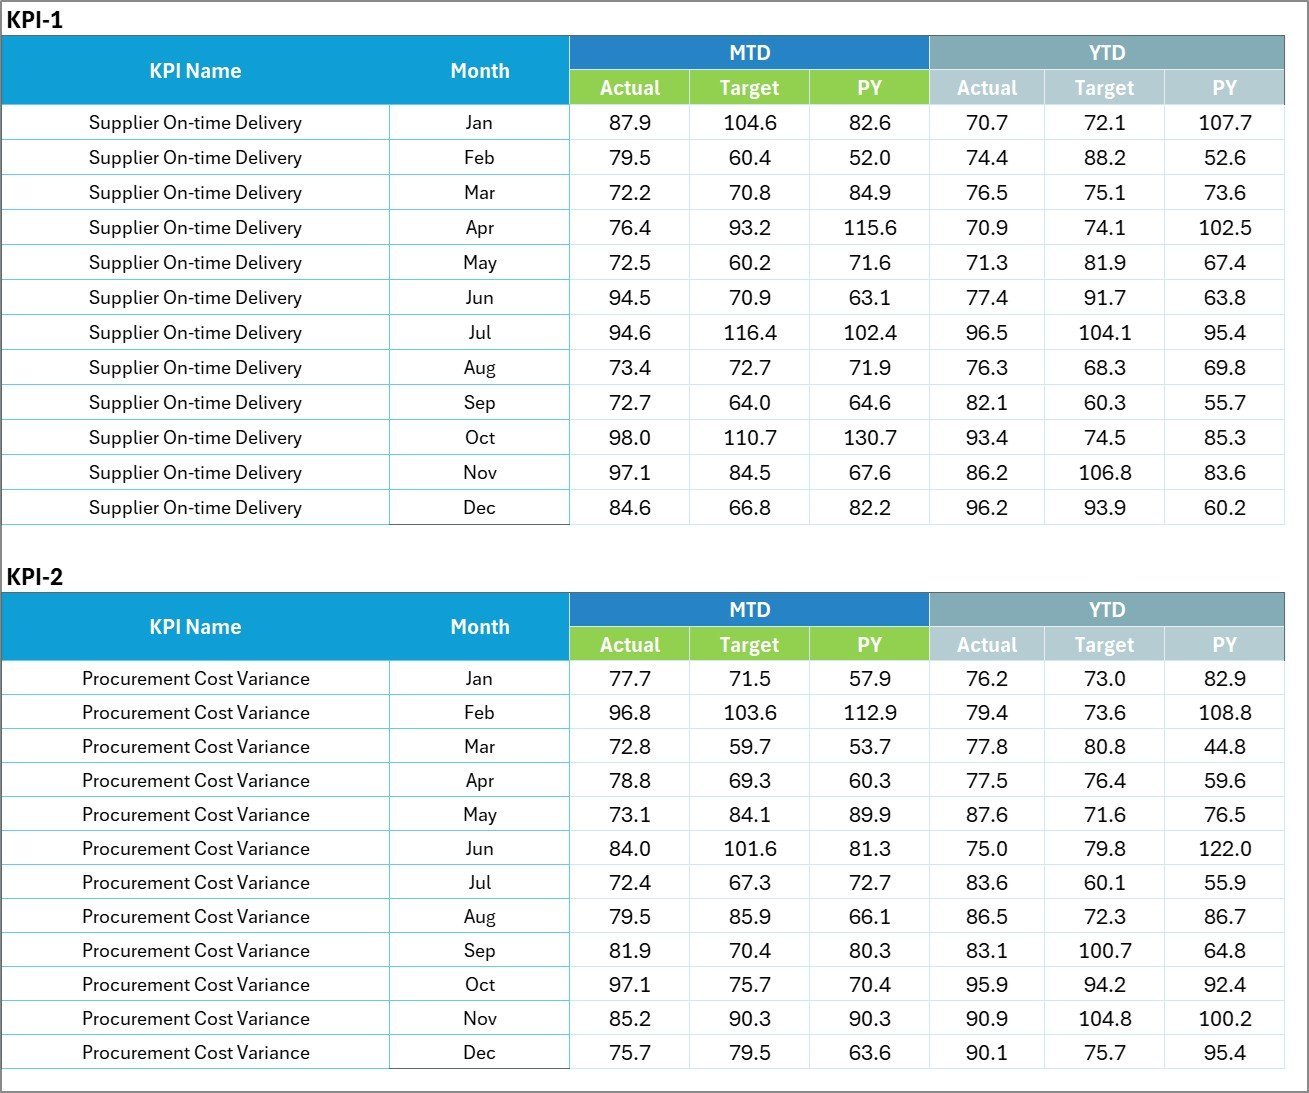
- 📝 Input Data Sheet: Easy-to-use data entry form to capture and update all KPI values and targets.
- 🔍 KPI Definition Sheet: Customizable KPI details including formulas and definitions for tailored scorecard management.
How to Use the Food Supply Chain KPI Scorecard
Getting started with the Food Supply Chain KPI Scorecard is straightforward. Begin by entering your KPI data into the Input Data Sheet, including actual results and target values. Use the KPI Definition Sheet to add or modify KPIs according to your specific supply chain parameters.
Navigate to the Scorecard Sheet to instantly view your KPIs’ performance with clear visual cues highlighting where you’re exceeding targets or need improvement. Use the dropdown menus to filter data by month, MTD, or YTD for deeper insights.
For trend analysis, select any KPI in the KPI Trend Sheet to visualize performance over time, analyze historical data, and forecast future trends. This helps in making data-driven decisions and optimizing supply chain operations.
The scorecard’s user-friendly design requires no advanced technical knowledge, making it ideal for supply chain managers, analysts, and executives who want to improve operational efficiency and achieve business goals.
Who Can Benefit from This Food Supply Chain KPI Scorecard
- 🏭 Supply Chain Managers: Monitor and enhance supply chain efficiency with real-time KPI tracking.
- 📊 Data Analysts: Analyze detailed KPI trends and support strategic decision-making.
- 👨💼 Operations Executives: Gain a comprehensive overview of supply chain performance at a glance.
- 🛒 Procurement Teams: Track supplier performance and delivery timelines effectively.
- 🍽️ Food Manufacturers: Ensure quality and compliance by monitoring critical KPIs in production and distribution.
- 📈 Business Owners: Make informed decisions that drive growth and profitability.
- 💡 Consultants & Advisors: Provide clients with actionable insights using a proven KPI tracking tool.
Empower your food supply chain with data-driven insights using this all-in-one KPI Scorecard. Stay agile, improve productivity, and reduce risks with ease!
Food Supply Chain KPI Scorecard

KPI Trend Sheet

Input Data Sheet
KPI Definition Sheet
Click here to read the Detailed blog post.
Visit our YouTube channel to learn step-by-step video tutorials


Reviews
There are no reviews yet.