
Running a food and beverage business means juggling multiple variables — from ingredient costs and sales revenue to product availability and profit margins. Doing it manually often leads to missed insights and inconsistent decisions. The Food and Beverage Report in Excel changes that completely.
This all-in-one Excel reporting solution helps restaurant owners, hoteliers, caterers, and distributors transform raw numbers into actionable insights. With interactive dashboards, slicers, and KPI cards, you can monitor cost, sales, and performance — all in one place, in real time.
Built with Excel’s powerful formulas and pivot tables, this tool is easy to customize, cost-effective, and doesn’t require any technical expertise. Whether you’re managing one outlet or a chain of restaurants, this report gives you instant visibility into what drives your business.
⚙️ Key Features of the Food and Beverage Report in Excel
✅ 📊 Three Analytical Pages + Support Sheet – Streamlined reporting designed to help you visualize your entire operation effortlessly.
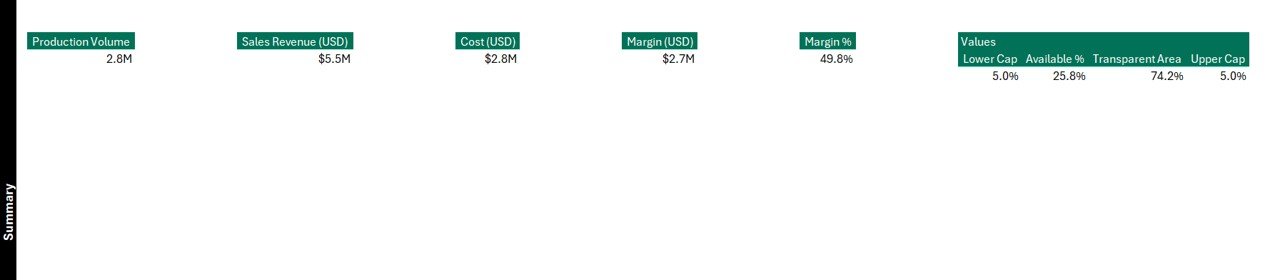
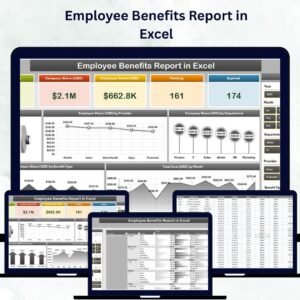
🧾 1. Summary Page – The Business Command Center
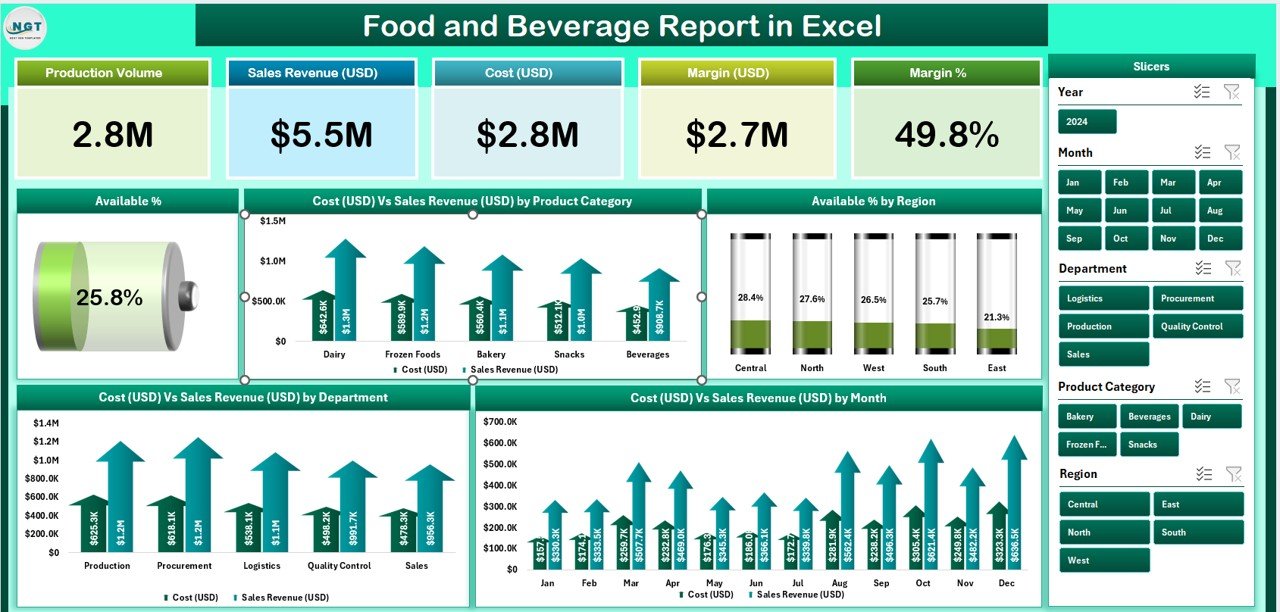
The Summary Page provides a top-level overview of your F&B performance through intuitive visuals and KPI cards.
Includes:
-
🧮 Five KPI Cards: Total Sales, Total Cost, Profit, Availability %, and Average Revenue per Product.
-
🎛️ Slicers: Filter reports by Product Category, Region, or Department with one click.
-
📈 Charts Displayed:
-
Availability % by Product Category
-
Cost (USD) vs Sales Revenue (USD) by Category
-
Availability % by Region
-
Cost vs Sales by Department
-
Monthly Cost vs Sales Trend
-
This page helps decision-makers spot best-selling items, high-cost departments, and seasonal performance changes at a glance.
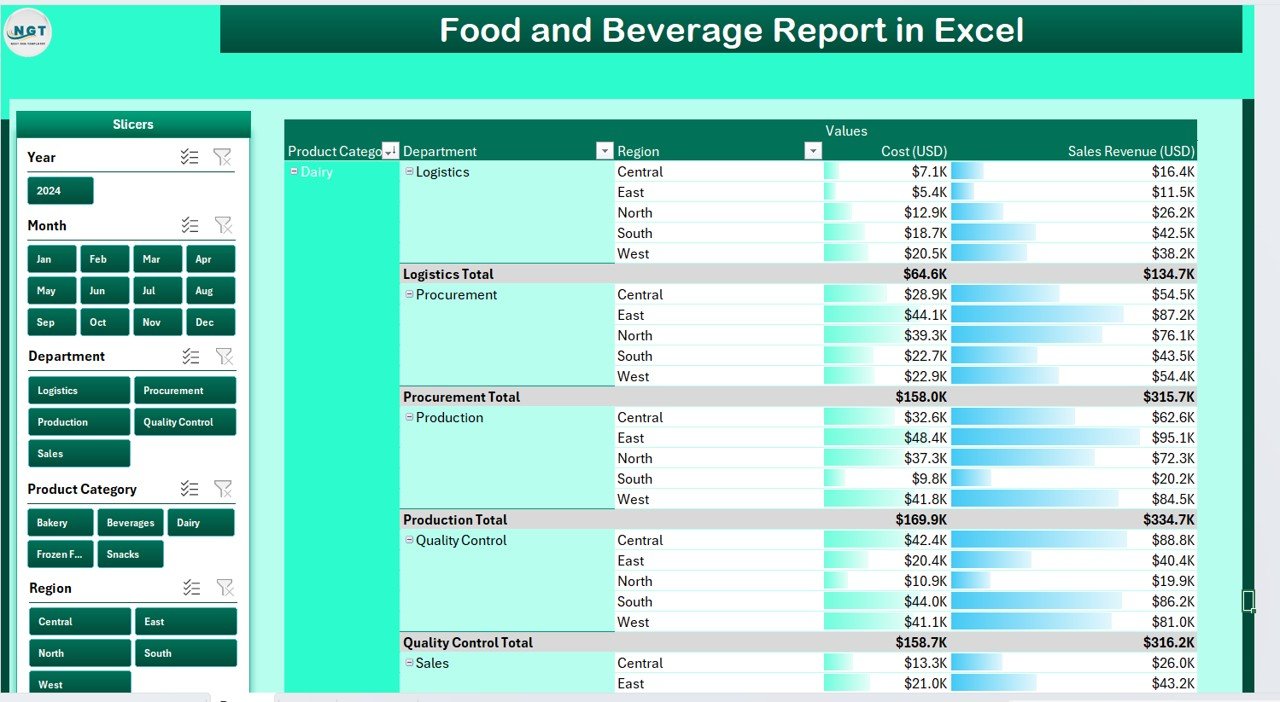
📋 2. Report Page – Detailed Transaction View
The Report Page acts as your comprehensive analytical table.
Key Highlights:
-
Left-side slicers for dynamic filtering by Region, Department, or Product.
-
Transaction-level data view showing Date, Product, Category, Cost, Sales, and Availability.
-
Real-time updates that refresh automatically when you modify your data sheet.
This section is perfect for departmental reporting or client presentations.
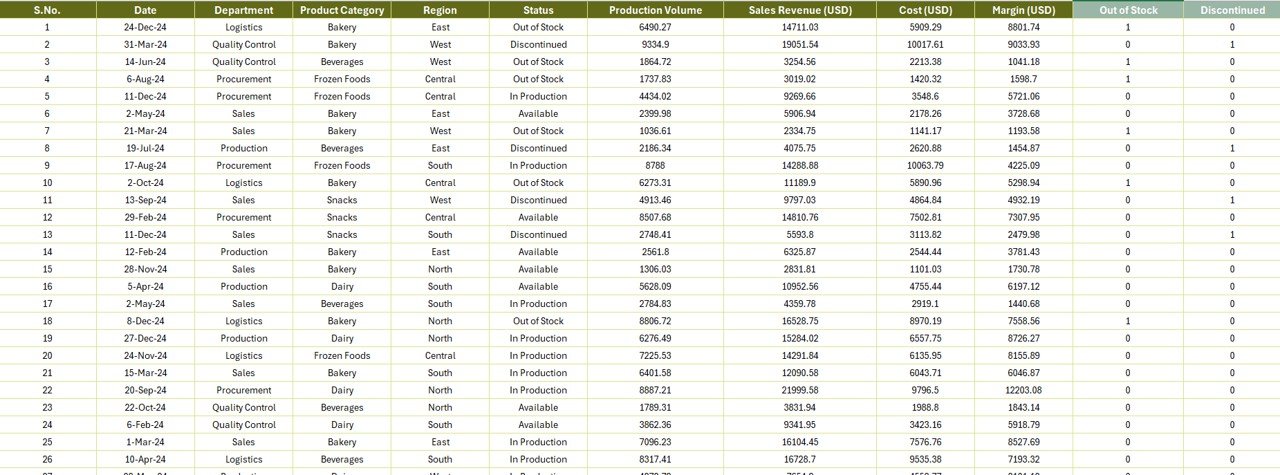
📊 3. Data Sheet – The Heart of the Report
The Data Sheet stores your raw business data that powers the entire dashboard.
Columns Include:
Product Name | Category | Region | Department | Cost (USD) | Sales Revenue (USD) | Availability % | Date of Transaction
Easily import data from your POS system, ERP, or accounting software — and refresh the report in seconds to update all visuals.
🧩 4. Support Sheet – Ensure Data Consistency
The Support Sheet includes reference lists for Product Categories, Regions, and Departments — ensuring dropdown accuracy and consistent reporting.
✅ Categories like Beverages, Bakery, Snacks, and Meals
✅ Regions like North, South, East, and West
✅ Departments like Kitchen, Bar, Service, Delivery
This structure eliminates manual errors and guarantees smooth automation.
🚀 Why Use Excel for Food and Beverage Reporting?
Excel remains one of the most versatile and user-friendly tools for financial and operational analytics.
Here’s why F&B professionals prefer it:
-
💡 Simple & Familiar Interface: No special software training needed.
-
⚙️ Customizable Design: Adjust charts, KPIs, or slicers to match your reporting needs.
-
🔁 Automation Ready: Use pivot tables and formulas for instant updates.
-
📂 Data Integration: Compatible with POS, CRM, or accounting tools.
-
📊 Instant Insights: Evaluate profitability, cost trends, and availability in real time.
Perfect for cafés, hotels, restaurants, and catering services, this Excel template gives professional-grade insights without the complexity or cost of enterprise software.
📘 How to Use the Food and Beverage Report in Excel
1️⃣ Enter Data: Fill in cost, sales, and availability details in the Data Sheet.
2️⃣ Refresh Pivots: Update the dashboard by refreshing pivot tables.
3️⃣ Use Slicers: Filter by Category, Region, or Department.
4️⃣ Analyze Charts: Compare Cost vs Sales or Availability % by Region.
5️⃣ Export Reports: Share clean, visual PDFs for management review.
👨🍳 Who Can Benefit from This Report
🍴 Restaurant Owners – Track menu performance, margins, and costs.
🏨 Hotel Managers – Evaluate department-wise profit and service efficiency.
🚚 Food Distributors – Analyze regional performance and availability trends.
📊 Financial Analysts – Compare monthly revenues vs expenses accurately.
👥 Executives – Gain an at-a-glance overview of operations across regions.
🌟 Advantages of Using the Food and Beverage Report in Excel
✅ Saves time with automated reporting.
✅ Enhances decision-making with clear visuals.
✅ Improves transparency across teams and departments.
✅ Reduces manual calculation errors.
✅ Delivers professional-quality insights affordably.
✅ Boosts productivity and business performance.
🔗 Click here to read the Detailed blog post
📺 Visit our YouTube channel for step-by-step tutorials
Visit our YouTube channel to learn step-by-step video tutorials
Watch the step-by-step video tutorial:
pert


Reviews
There are no reviews yet.