


The Fleet Utilization KPI Dashboard in Excel is a robust tool designed for fleet managers, logistics teams, and transportation companies to track and analyze the performance of their fleet. This Excel-based dashboard enables you to monitor key performance indicators (KPIs) such as vehicle utilization, maintenance schedules, fuel efficiency, and overall fleet costs. It provides real-time insights into fleet operations, helping you optimize vehicle usage, reduce costs, and increase operational efficiency.
With customizable charts, easy-to-read visuals, and an intuitive interface, this dashboard is essential for improving fleet management, ensuring that your vehicles are being used effectively and in compliance with maintenance schedules.

Key Features of the Fleet Utilization KPI Dashboard in Excel:
🚗 Vehicle Utilization Tracking
Monitor the utilization rates of each vehicle in your fleet, helping you optimize vehicle usage and reduce idle time.
⛽ Fuel Efficiency Monitoring
Track fuel consumption and identify patterns in fuel usage, enabling you to optimize routes, improve fuel efficiency, and reduce fuel costs.
🛠️ Maintenance and Downtime Tracking
Track vehicle maintenance schedules, repairs, and downtime to ensure that vehicles remain in good working condition and avoid costly breakdowns.
💸 Fleet Costs and Budgeting
Monitor total fleet expenses, including maintenance costs, fuel expenses, insurance, and leasing costs, ensuring that your fleet operates within budget.
📈 Fleet Performance KPIs
Track key performance indicators like cost per mile, vehicle efficiency, and maintenance costs, helping you make data-driven decisions to improve fleet operations.
🚀 Why You’ll Love the Fleet Utilization KPI Dashboard in Excel:
✅ Optimize Vehicle Utilization – Track how much each vehicle is being used, helping you optimize fleet resources and minimize downtime.
✅ Reduce Fuel Costs – Track fuel efficiency and identify opportunities to reduce fuel consumption, ultimately lowering transportation costs.
✅ Improve Fleet Efficiency – Monitor vehicle performance and maintenance schedules to ensure maximum uptime and reliability.
✅ Track Fleet Expenses – Monitor fleet-related costs such as fuel, maintenance, insurance, and leasing to ensure that your fleet is cost-effective and within budget.
✅ Data-Driven Decision Making – Use the data to make informed decisions about fleet management, route planning, and resource allocation.
✅ Customizable and Easy-to-Use – Fully customizable to suit your fleet’s needs, with an intuitive interface that makes it easy to track and analyze key metrics.
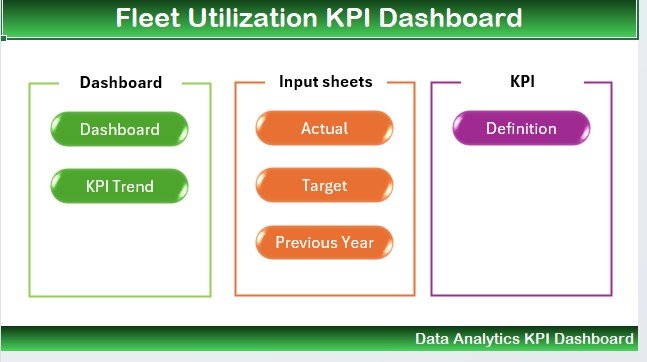
What’s Inside the Fleet Utilization KPI Dashboard in Excel:
-
Vehicle Utilization Tracking: Track the usage rates of each vehicle in your fleet, including miles driven, idle time, and active use.
-
Fuel Efficiency Monitoring: Track fuel consumption and cost per vehicle, helping you identify inefficiencies and improve fuel economy.
-
Maintenance and Downtime Tracking: Monitor scheduled maintenance, repairs, and downtime to ensure vehicles are in optimal condition and to avoid costly breakdowns.
-
Fleet Cost Monitoring: Track fleet-related expenses such as fuel, insurance, maintenance, and leasing costs to stay within budget.
-
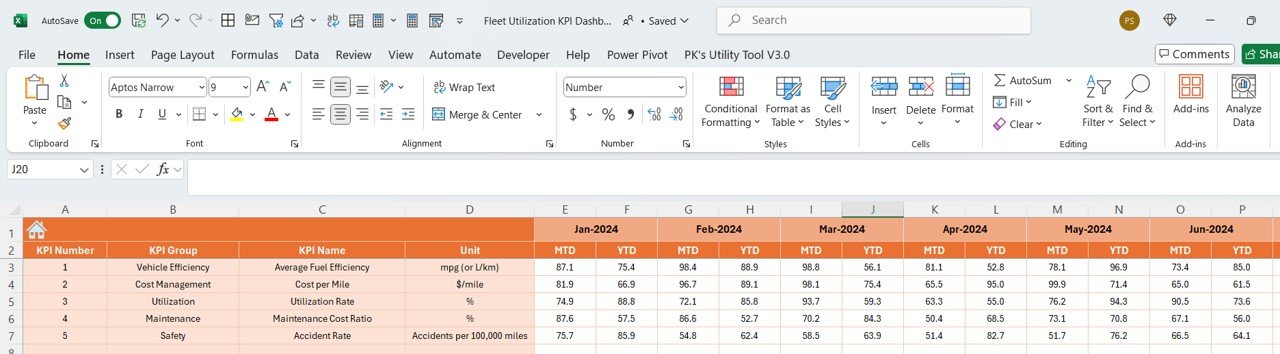
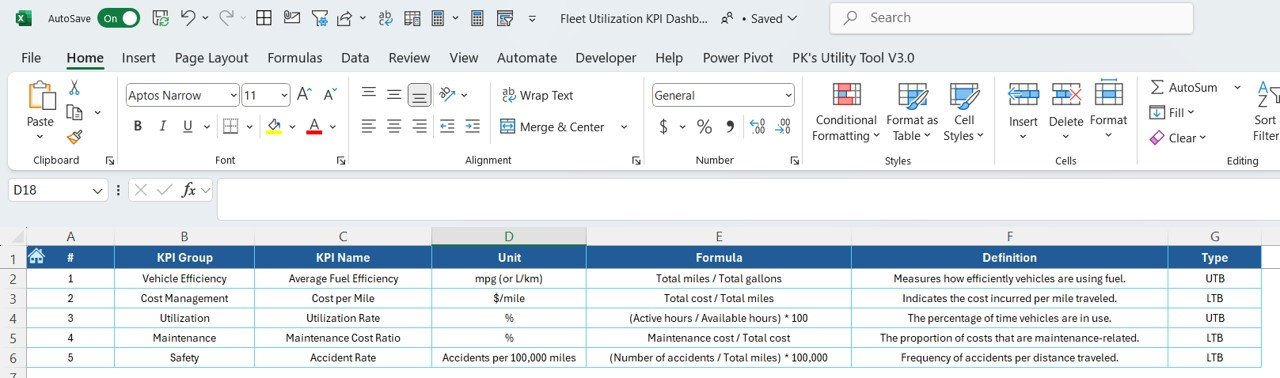
Key Fleet Performance Metrics: Track KPIs such as cost per mile, fleet efficiency, and maintenance costs to assess the overall performance of your fleet.
-
Custom Reports: Generate tailored reports to present fleet performance, costs, and utilization data to management, helping inform strategic decisions.
How to Use the Fleet Utilization KPI Dashboard in Excel:
1️⃣ Download the Template – Instantly access your Excel file upon purchase.
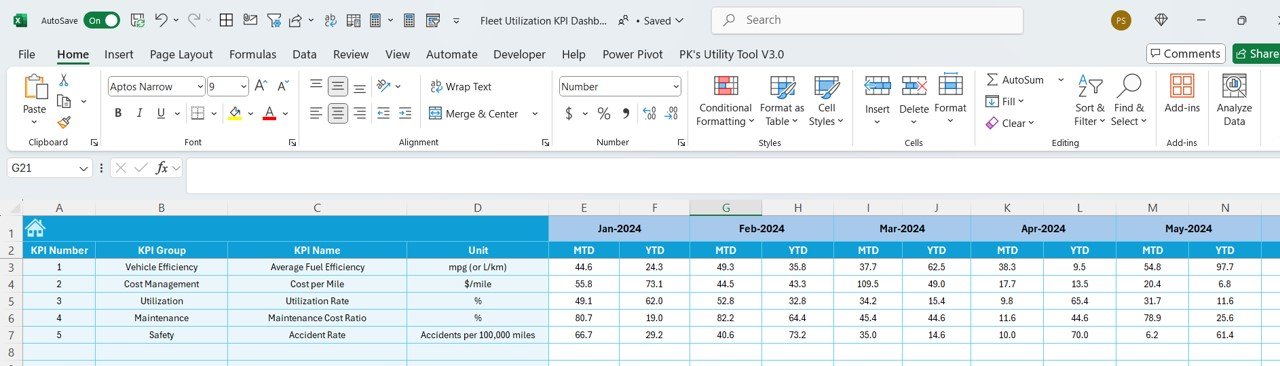
2️⃣ Input Fleet Data – Enter data for each vehicle, including mileage, fuel consumption, maintenance, and expenses to start tracking KPIs.
3️⃣ Monitor Fleet Metrics – Track vehicle utilization, fuel efficiency, maintenance schedules, and fleet costs in real-time.
4️⃣ Optimize Fleet Operations – Analyze KPIs to identify areas for improvement in vehicle usage, fuel consumption, and fleet management practices.
5️⃣ Generate Reports – Create detailed reports summarizing fleet performance and costs to make data-driven decisions for optimizing fleet operations.
Who Can Benefit from the Fleet Utilization KPI Dashboard in Excel:
-
Fleet Managers
-
Logistics and Transportation Teams
-
Vehicle Fleet Owners
-
Operations and Maintenance Managers
-
Small to Large Enterprises with Fleets
-
Delivery and Distribution Companies
-
Public and Private Sector Fleet Management Teams
The Fleet Utilization KPI Dashboard in Excel is an indispensable tool for anyone managing a fleet of vehicles. By providing insights into vehicle usage, fuel efficiency, maintenance needs, and fleet costs, this dashboard helps you optimize operations, reduce costs, and increase fleet performance.
Click here to read the Detailed blog post
https://www.pk-anexcelexpert.com/fleet-utilization-kpi-dashboard-in-excel/
Visit our YouTube channel to learn step-by-step video tutorials
Youtube.com/@PKAnExcelExpert


Reviews
There are no reviews yet.