The fintech world runs on speed, accuracy, and smart decisions. Every second, transactions happen, loans get approved, interest accumulates, and risks evolve. But here’s the problem — without structured reporting, fintech companies lose visibility. Revenue leaks go unnoticed. Risk exposure increases. Profit margins shrink.
That’s exactly why the Fintech Dashboard in Power BI becomes your ultimate financial command center
This ready-to-use, interactive Power BI solution transforms complex financial data into powerful, easy-to-understand visuals. Instead of juggling spreadsheets, you get one centralized dashboard that tracks revenue, lending performance, customer growth, and risk indicators in real time.
If you want clarity, control, and competitive advantage — this dashboard is built for you.
🚀 Key Feature of Fintech Dashboard in Power BI
📊 5 Interactive Dashboard Pages – Complete financial monitoring structure.
💰 Revenue Tracking System – Monitor Fee Revenue, Interest Revenue & Total Revenue instantly.
📈 Profit Margin Monitoring – Identify high and low-performing channels.
🏦 Lending Portfolio Insights – Analyze loan exposure by segment and channel.
⚠️ Risk Score Analytics (1–100) – Detect high-risk acquisition channels early.
👥 Customer Growth Analysis – Track CAC, segment profitability, and processing costs.
📉 EMI Performance Monitoring – Evaluate monthly EMI collection trends.
🎯 Dynamic Slicers & Filters – Drill down by segment, channel, or time period.
Everything updates automatically. Therefore, decision-makers get instant clarity.
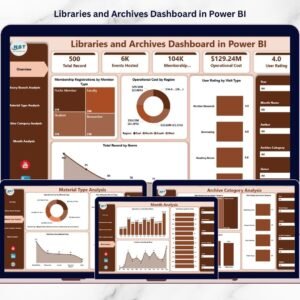
📦 What’s Inside the Fintech Dashboard in Power BI?
This dashboard includes 5 professionally designed pages:
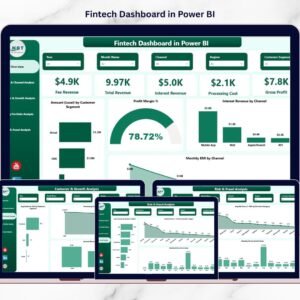
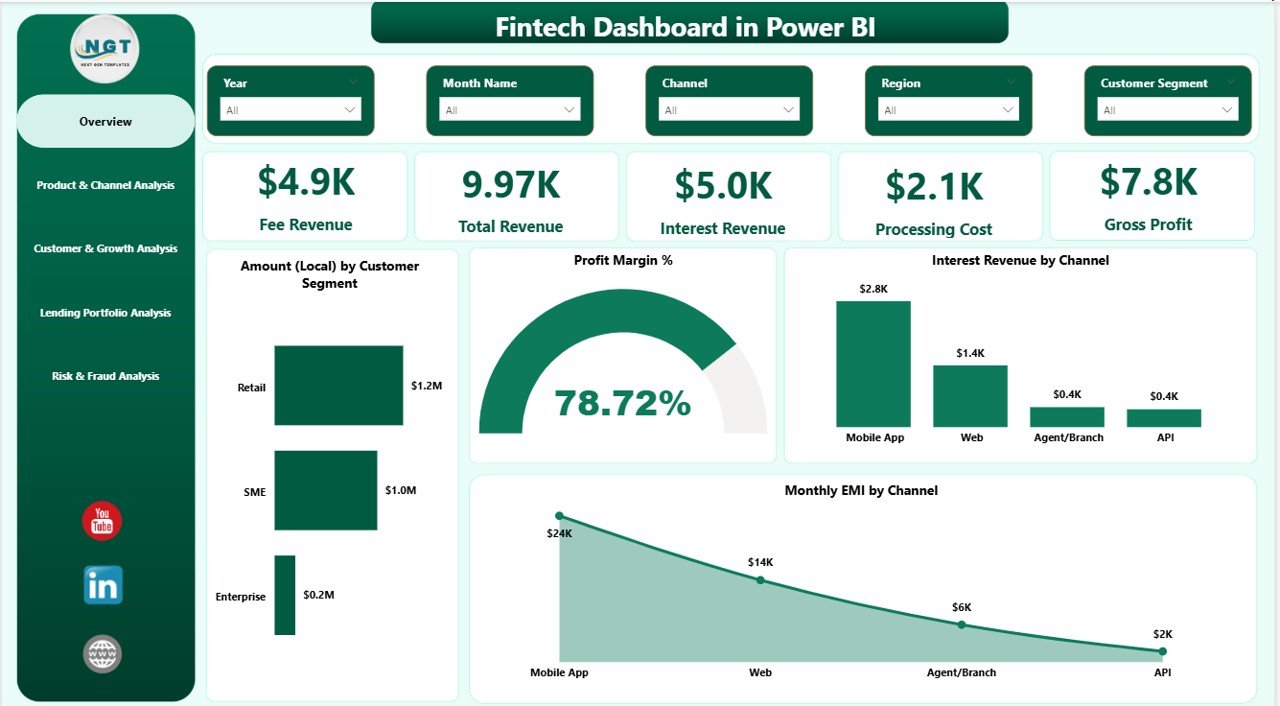
1️⃣ Overview Page – The Financial Snapshot
✔ 5 KPI Cards: Fee Revenue, Total Revenue, Interest Revenue, Processing Cost, Gross Cost
✔ Charts: Amount by Customer Segment, Profit Margin %, Interest Revenue by Channel, Monthly EMI by Channel
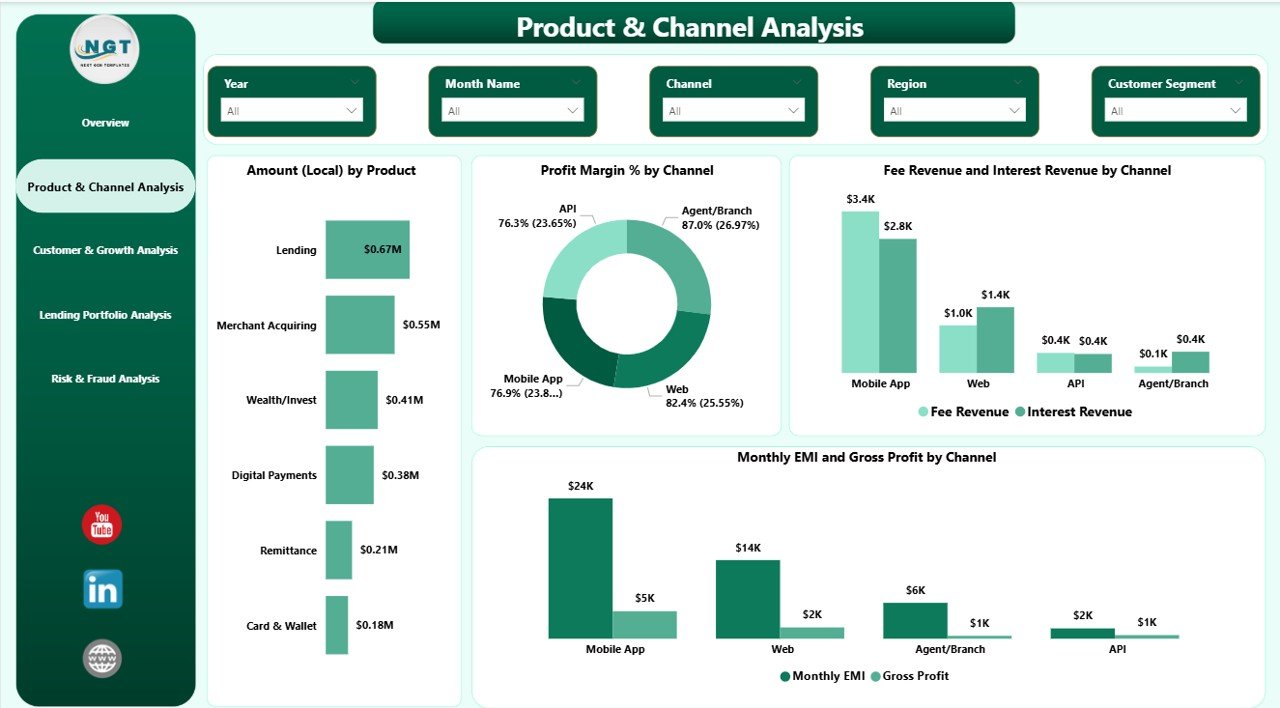
2️⃣ Product & Channel Analysis Page
✔ Revenue by Product
✔ Profit Margin by Channel
✔ Fee & Interest Revenue Comparison
✔ EMI & Gross Profit Trends
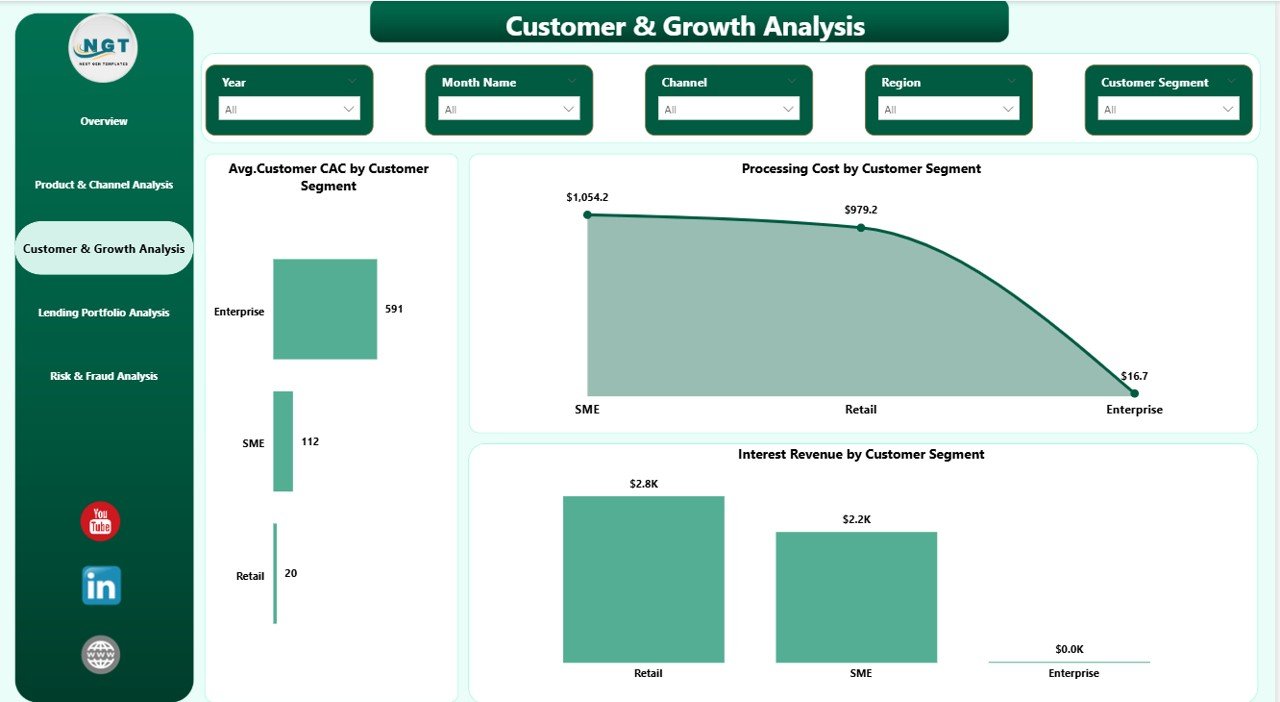
3️⃣ Customer & Growth Analysis Page
✔ Average Customer CAC by Segment
✔ Processing Cost by Segment
✔ Interest Revenue by Segment
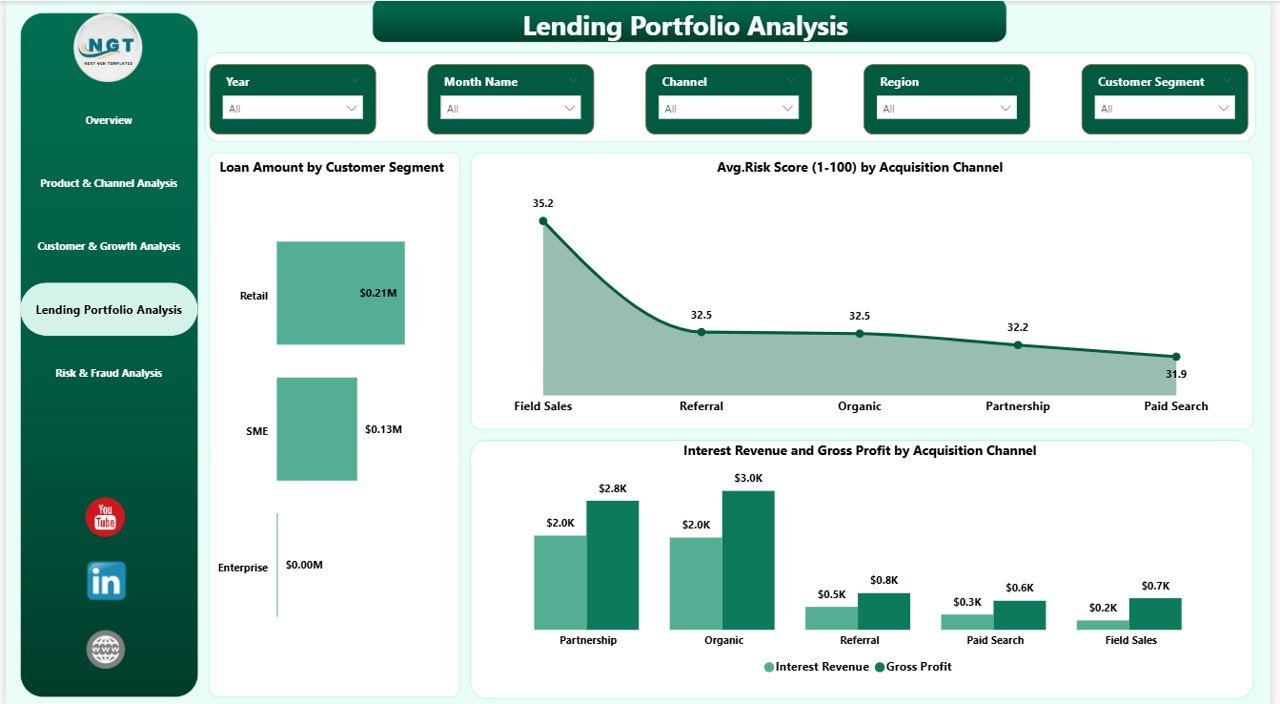
4️⃣ Lending Portfolio Analysis Page
✔ Loan Amount by Segment
✔ Average Risk Score by Channel
✔ Revenue & Gross Profit by Channel
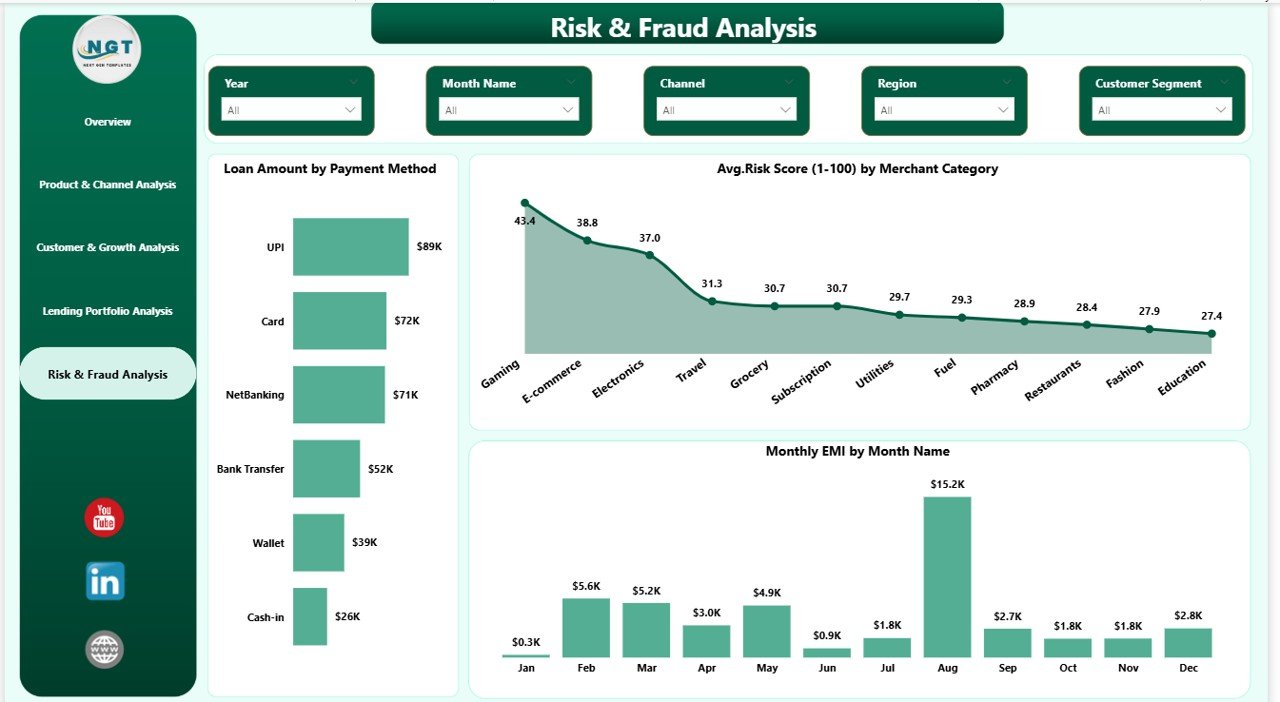
5️⃣ Risk & Fraud Analysis Page
✔ Loan Amount by Payment Method
✔ Risk Score by Merchant Category
✔ Monthly EMI Trends
This structured layout ensures complete fintech performance visibility.
⚙️ How to Use the Fintech Dashboard in Power BI?
Using this dashboard is simple:
1️⃣ Import your structured Excel or database data
2️⃣ Refresh the dataset
3️⃣ Use slicers to filter by segment, channel, or time
4️⃣ Analyze revenue, cost, and risk trends
5️⃣ Take immediate data-driven action
Because the dashboard is interactive, you can drill down into performance gaps instantly.
👥 Who Can Benefit from This Fintech Dashboard?
✔ Fintech Founders
✔ CFOs & Finance Managers
✔ Lending Managers
✔ Risk Analysts
✔ Fraud Monitoring Teams
✔ Marketing Teams
✔ Business Intelligence Analysts
If your business handles lending, payments, digital finance, or risk evaluation — this dashboard becomes your growth accelerator.
This dashboard doesn’t just show numbers — it answers critical business questions:
🔹 Which customer segment generates maximum profit?
🔹 Which acquisition channel brings higher risk?
🔹 Are processing costs increasing month-over-month?
🔹 Which product delivers the best margin?
🔹 Is EMI collection stable?
Instead of guessing, you decide with confidence.
Moreover, Power BI ensures smooth performance even with large datasets. Therefore, whether you’re a growing fintech startup or an established financial platform, this dashboard scales with you.
Adopting this solution means:
✅ Faster decision-making
✅ Improved profitability
✅ Better risk monitoring
✅ Centralized reporting
✅ Strong financial control
In today’s competitive fintech landscape, data clarity equals power. And this dashboard gives you that power.
Click hare to read the Detailed blog post
Watch the step-by-step video tutorial: