

Managing financial audits requires precision, speed, and total visibility. However, when audit data is spread across multiple Excel files, manual reports, and static summaries, performance tracking becomes slow and error-prone. That is exactly why the Financial Auditing KPI Dashboard in Excel is a game-changing solution for modern audit teams.
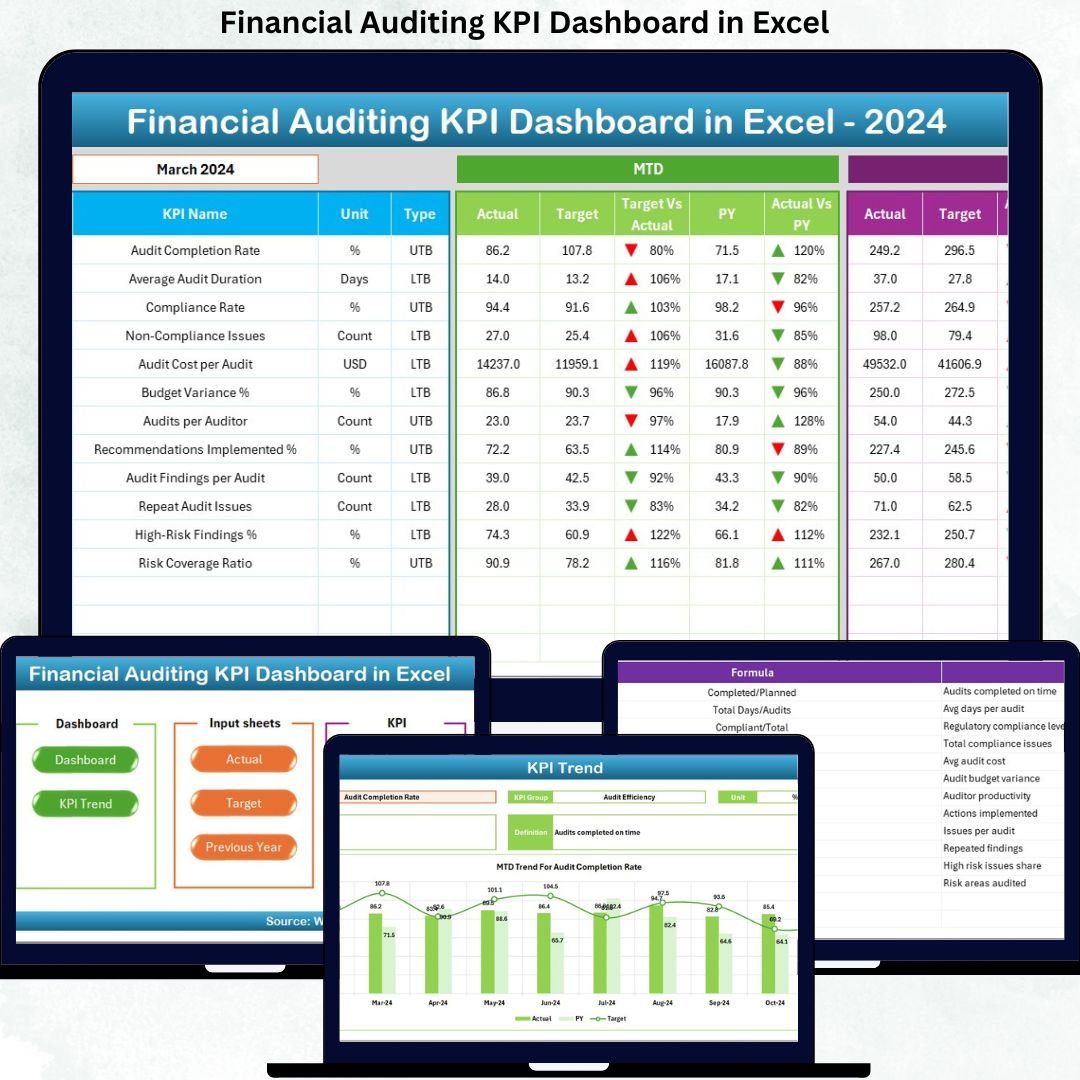
This professionally designed, ready-to-use Excel dashboard converts complex audit data into clear KPIs, visual trends, and actionable insights. Instead of spending hours compiling reports, auditors and finance leaders can instantly track audit performance, compliance status, and risk indicators—directly from a single Excel workbook.
Built with simplicity and flexibility in mind, this dashboard helps organizations improve audit efficiency, strengthen governance, and support data-driven decisions—without investing in expensive BI tools.
🔑 Key Features of Financial Auditing KPI Dashboard in Excel
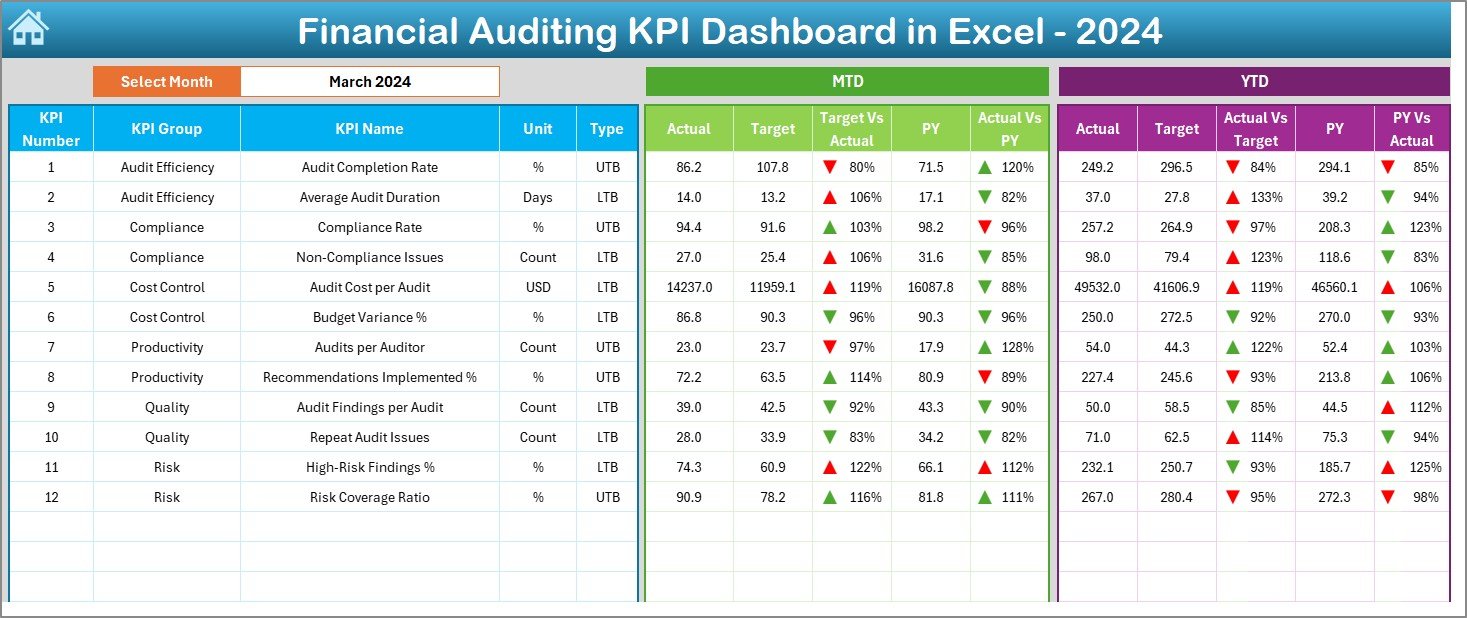
📌 Interactive Month Selection
Change the reporting month using a simple dropdown, and the entire dashboard updates instantly.
📊 MTD & YTD Performance Tracking
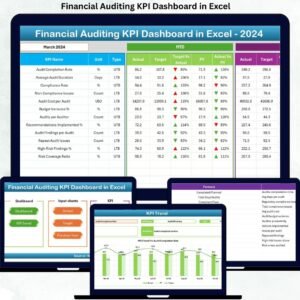
Track Month-to-Date and Year-to-Date KPIs with Actual, Target, and Previous Year comparisons.
📈 Smart Variance Analysis
Automatically calculate Target vs Actual (%) and Previous Year vs Actual (%) to identify gaps quickly.
🚦 Conditional Formatting Indicators
Up and down arrows visually highlight performance improvements or declines at a glance.
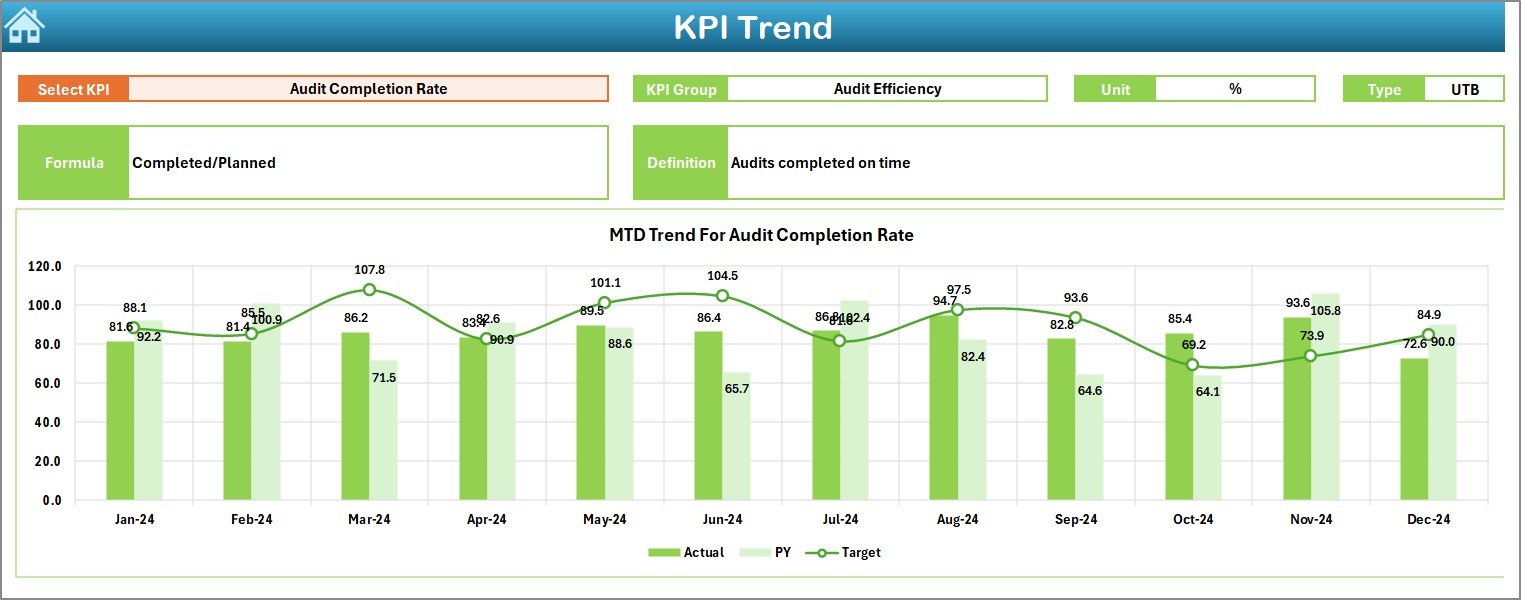
📉 KPI Trend Analysis
Analyze MTD and YTD trends using dynamic charts for deeper performance evaluation.
🧮 Centralized KPI Definitions
Ensure clarity with built-in KPI formulas, units, and definitions for consistent interpretation.
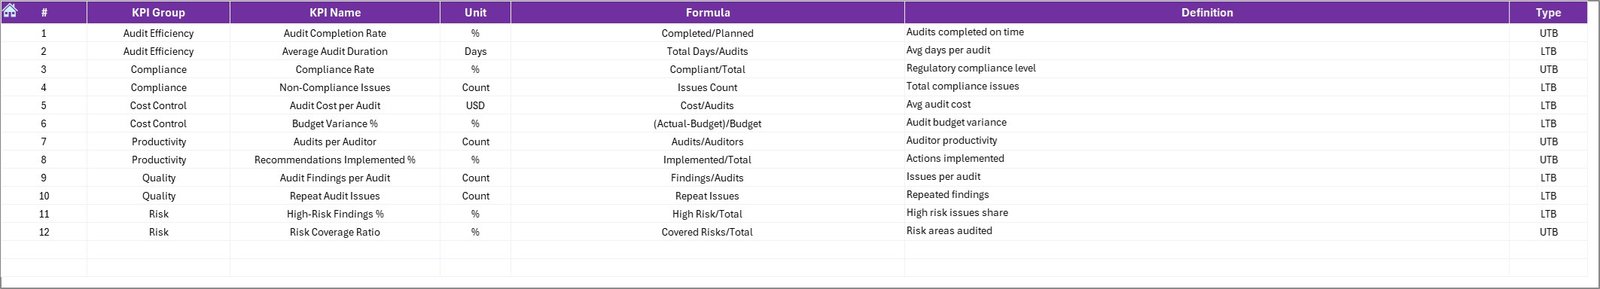
📦 What’s Inside the Financial Auditing KPI Dashboard in Excel
This dashboard includes 7 well-structured worksheets, each designed for a specific purpose:
📍 Summary Page – Acts as an index with navigation buttons for quick access.
📍 Dashboard Sheet – Displays all KPIs with MTD, YTD, variance analysis, and indicators.
📍 Trend Sheet – Provides KPI-level trend charts and detailed KPI information.
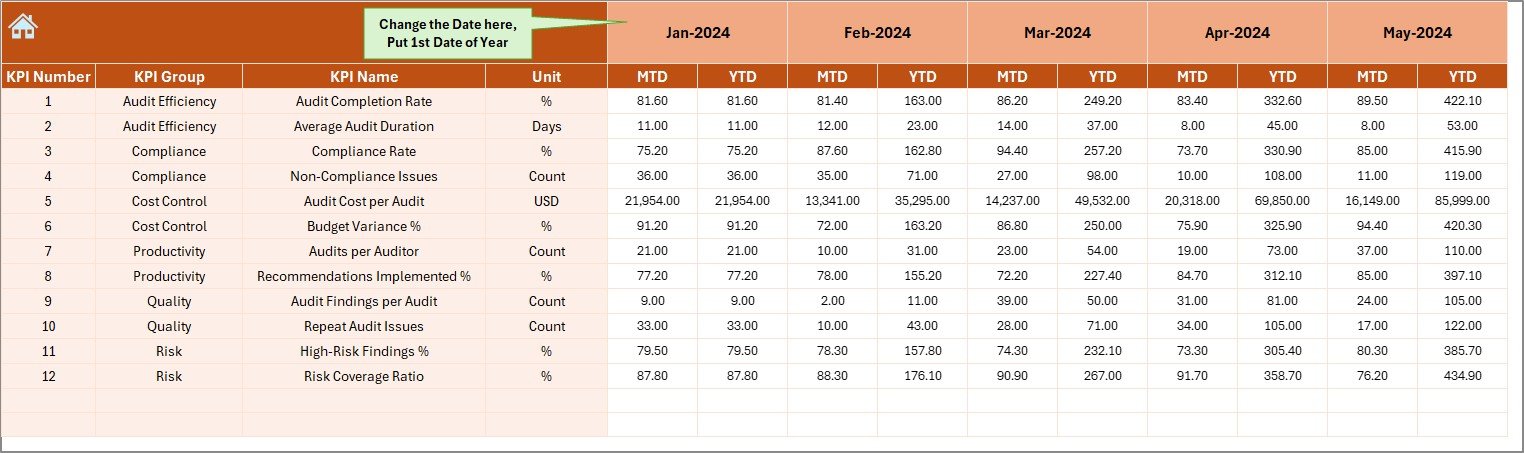
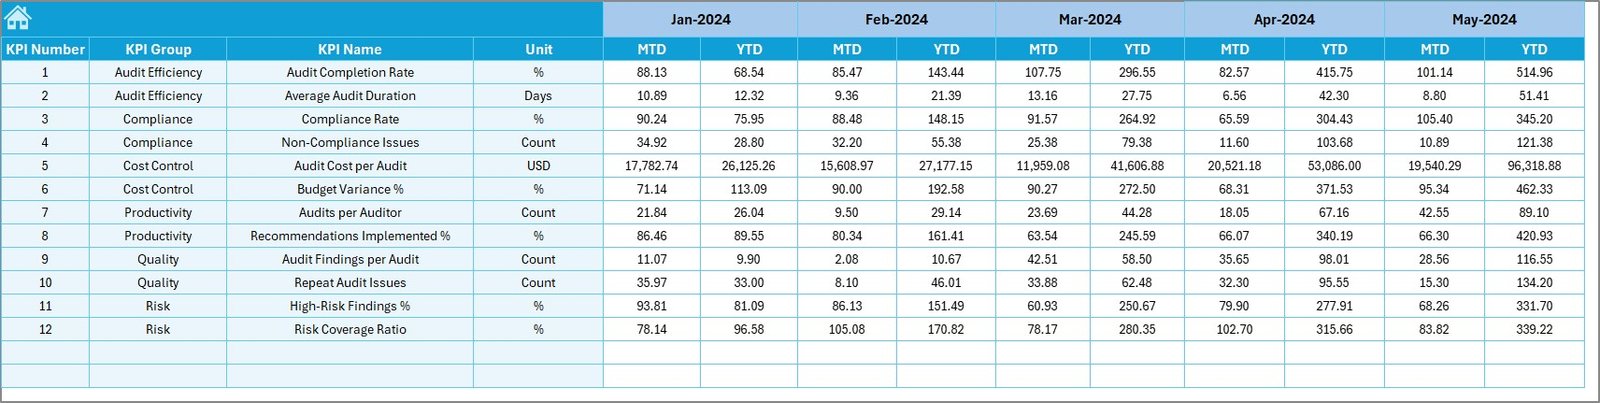
📍 Actual Numbers Sheet – Input sheet for monthly MTD and YTD actual values.
📍 Target Sheet – Stores planned MTD and YTD targets for comparison.
📍 Previous Year Sheet – Maintains historical data for year-over-year analysis.
📍 KPI Definition Sheet – Documents KPI name, group, unit, formula, and description.
This structure ensures clarity, accuracy, and ease of use across audit teams.
⚙️ How to Use the Financial Auditing KPI Dashboard in Excel
Using this dashboard is simple and intuitive:
1️⃣ Enter actual audit performance data in the Actual Numbers sheet
2️⃣ Define monthly and yearly targets in the Target sheet
3️⃣ Add previous year values for comparison
4️⃣ Select the reporting month from the dropdown
5️⃣ Instantly review KPIs, variances, and trends on the Dashboard
No advanced Excel skills are required—basic Excel knowledge is enough to get started.
🎯 Who Can Benefit from This Financial Auditing KPI Dashboard in Excel
This dashboard is ideal for:
✅ Internal audit teams
✅ External audit firms
✅ Finance and accounting managers
✅ Compliance officers
✅ Risk and governance professionals
✅ Small, mid-size, and large organizations
Because it is fully customizable, the dashboard adapts easily to different audit frameworks and regulatory requirements.
Click here to read the Detailed Blog Post
Watch the step-by-step video tutorial:


Reviews
There are no reviews yet.