In today’s dynamic business environment, organizations must maintain strong financial governance, ensure regulatory compliance, and continuously monitor operational risks. However, many companies still manage audit activities using disconnected spreadsheets, manual reporting processes, and scattered documentation. As a result, audit teams often struggle to track findings, monitor progress, and identify risks quickly.
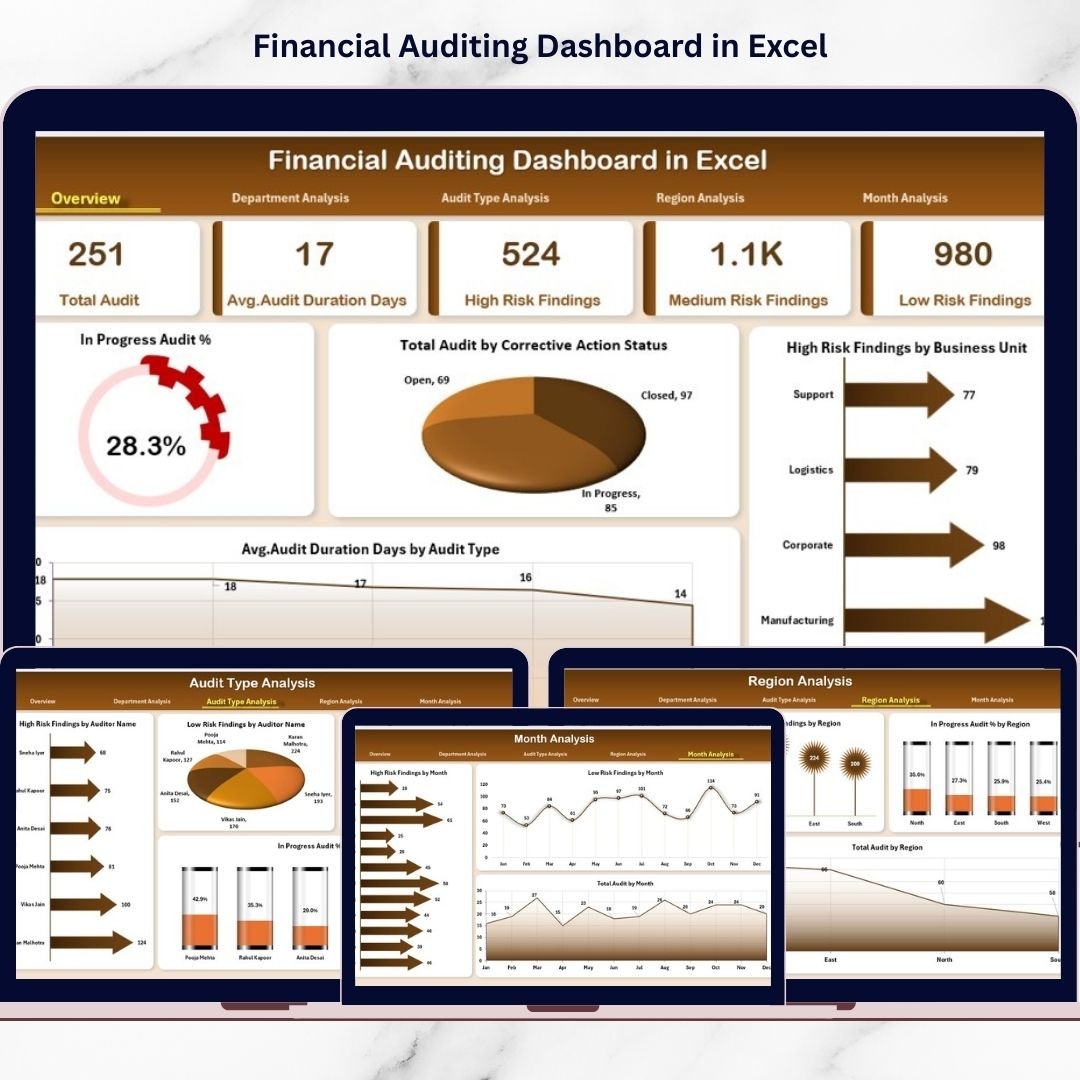
The Financial Auditing Dashboard in Excel is a powerful, ready-to-use analytical solution designed to simplify audit monitoring and performance tracking. This interactive Excel dashboard transforms complex audit data into clear visual insights, enabling organizations to manage audits efficiently while improving transparency and decision-making.
Instead of reviewing multiple audit reports individually, users can monitor audit progress, risk findings, corrective actions, and compliance performance from a centralized dashboard interface. Consequently, auditors, finance teams, and executives gain instant visibility into audit health and organizational risk exposure.
Built using Microsoft Excel, this dashboard provides enterprise-level analytics without requiring expensive audit management software. Through dynamic charts, KPI cards, automated calculations, and interactive slicers, users can analyze audit performance across departments, audit types, regions, and time periods.
📊 Key Features of Financial Auditing Dashboard in Excel
✅ Centralized Audit Monitoring
Track all audit activities, findings, and compliance metrics in one dashboard.
🎛️ Interactive Page Navigator
Quickly switch between analytical pages using a user-friendly navigation panel.
📈 Executive Overview Dashboard
Instantly understand audit performance through KPI cards and summary visuals.
⚠️ Risk Monitoring Analytics
Identify high-risk findings across departments and regions quickly.
🏢 Department Performance Analysis
Compare compliance and audit efficiency across business units.
🧾 Audit Type Evaluation
Analyze performance across internal, compliance, operational, and financial audits.
🌍 Regional Compliance Insights
Monitor audit performance across multiple locations.
📅 Monthly Trend Analysis
Track audit activity and risk patterns over time.
⚡ Automated Excel Calculations
Update data once and refresh the entire dashboard instantly.
📦 Dashboard Structure – What’s Included
This ready-to-use template includes multiple structured analytical pages:
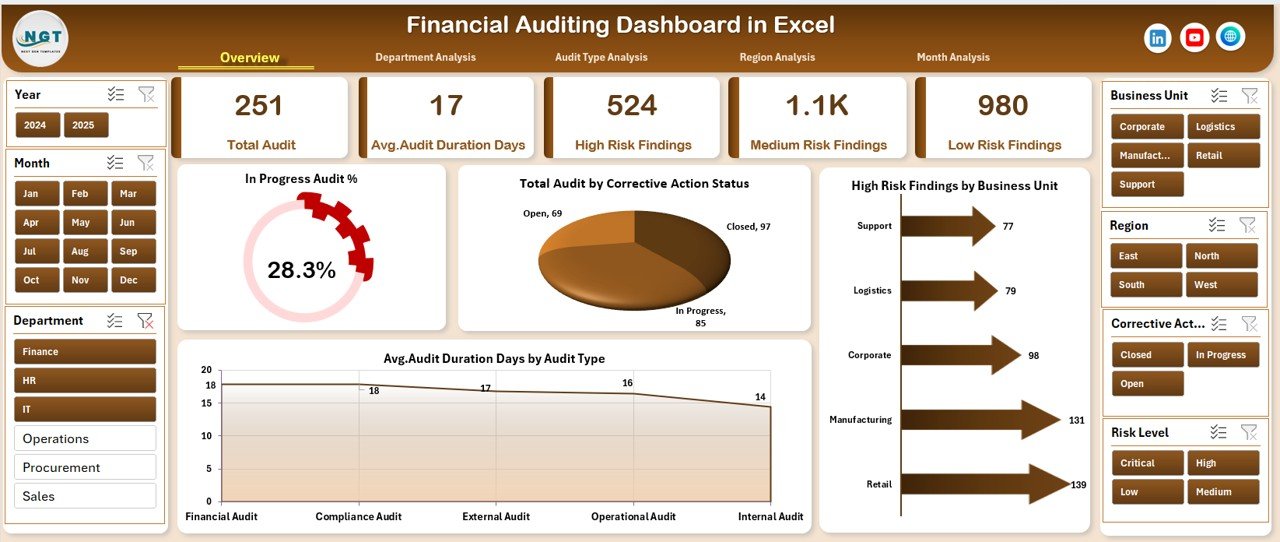
🔹 Overview Page
The executive control center showing:
-
In Progress Audit %
-
Total Audit by Corrective Action Status
-
High Risk Findings by Business Unit
-
Average Audit Duration by Audit Type
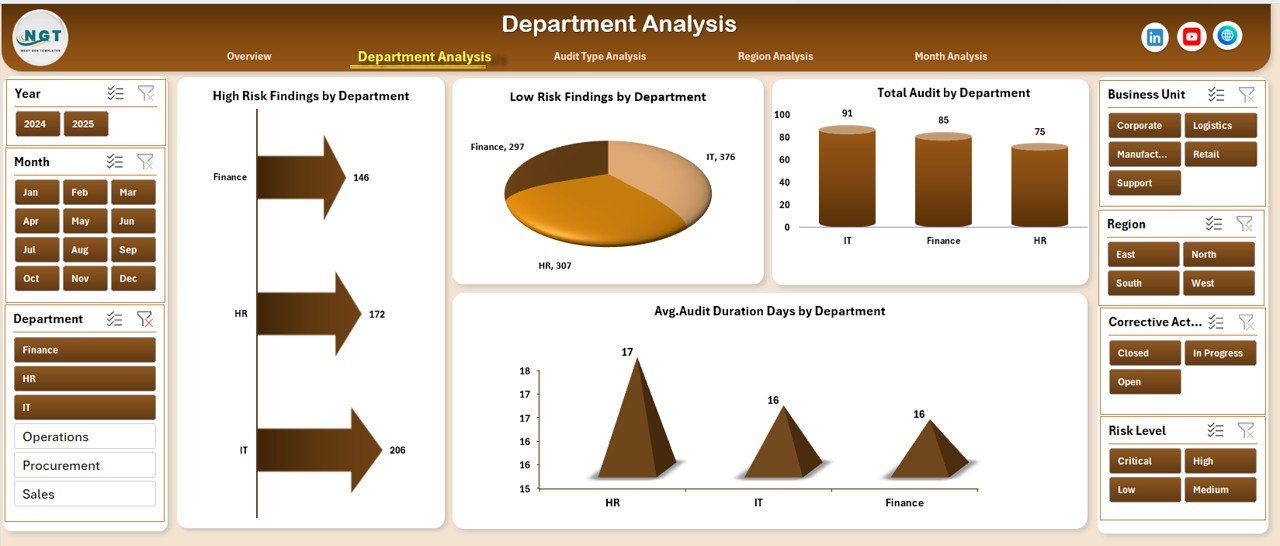
🔹 Department Analysis
Compare audit performance across departments using:
-
High & Low Risk Findings
-
Total Audits by Department
-
Average Audit Duration
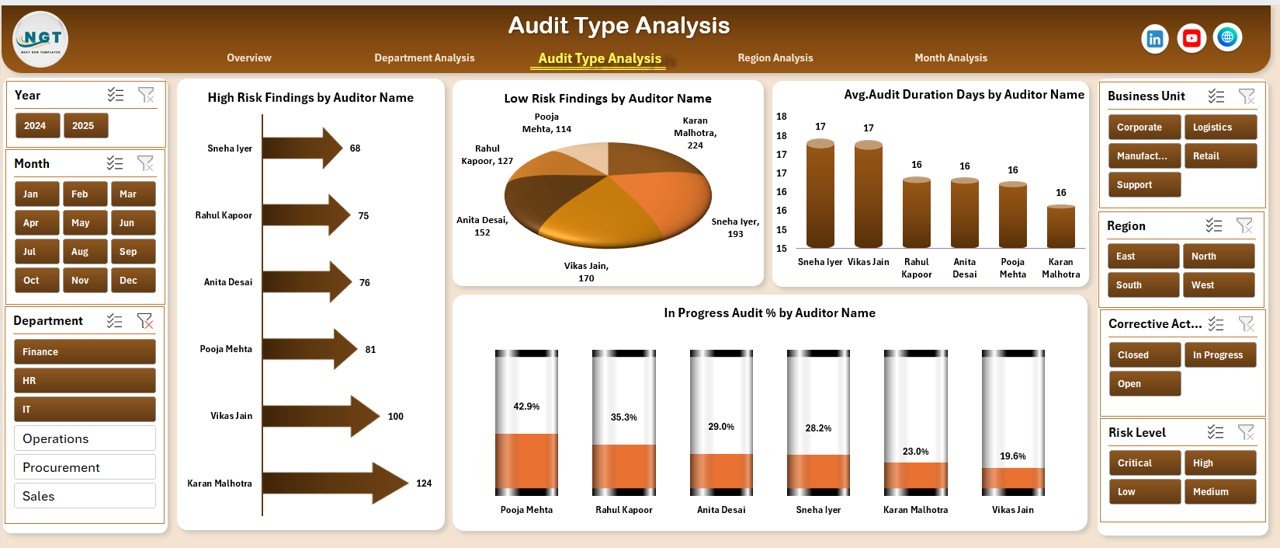
🔹 Audit Type Analysis
Evaluate audit complexity and efficiency through:
-
Risk findings by audit name
-
Audit progress tracking
-
Duration comparisons
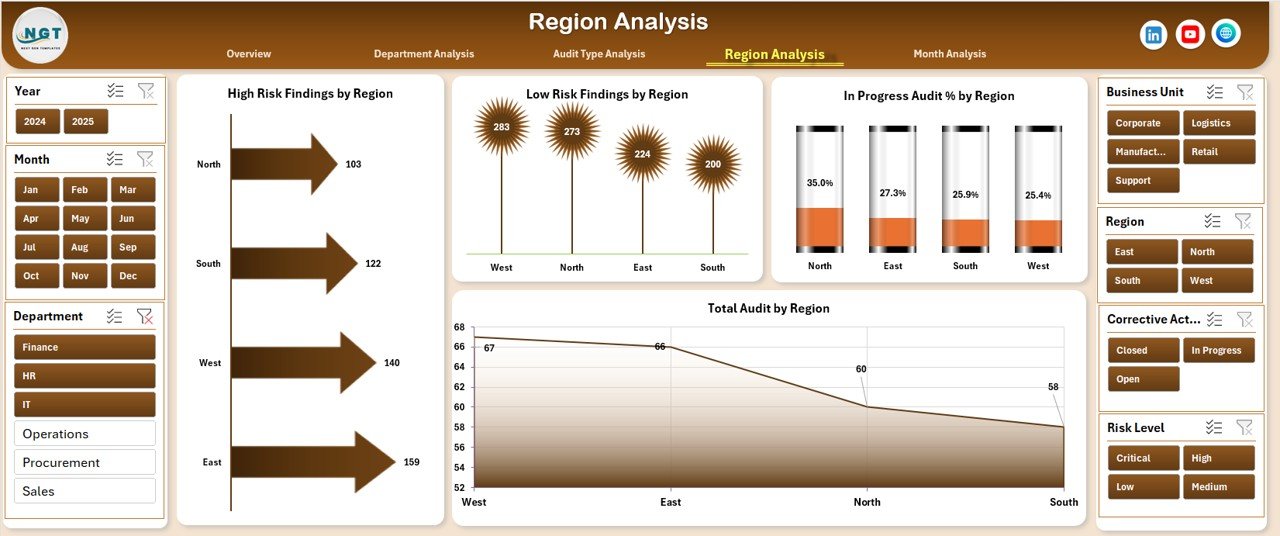
🔹 Region Analysis
Analyze geographic compliance performance including:
-
Risk findings by region
-
Audit completion status
-
Regional audit distribution
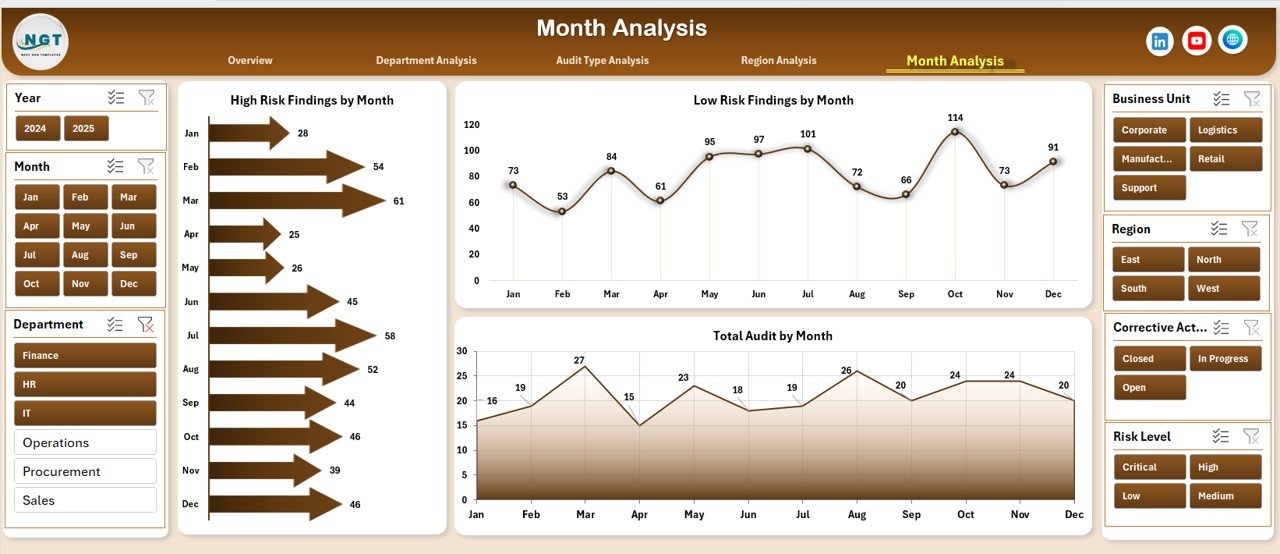
🔹 Month Analysis
Monitor trends using:
-
High Risk Findings by Month
-
Low Risk Findings by Month
-
Total Audits by Month
🗂️ Supporting Sheets
Data Sheet
Stores structured audit records such as:
-
Audit Name
-
Department
-
Region
-
Audit Type
-
Risk Level
-
Corrective Action Status
-
Audit Duration
-
Audit Date
Support Sheet
Handles backend operations including:
-
Calculations
-
Dropdown lists
-
Validation rules
-
Helper formulas
Because of this structured design, dashboards update automatically when data changes.
🛠️ How to Use the Financial Auditing Dashboard
Using the dashboard is simple and requires only basic Excel knowledge:
1️⃣ Enter audit records into the Data Sheet.
2️⃣ Update audit progress and corrective action status.
3️⃣ Use slicers to filter departments, regions, or audit types.
4️⃣ Review KPI cards on the Overview page.
5️⃣ Navigate across analysis pages for deeper insights.
6️⃣ Share visual reports with stakeholders instantly.
The automated structure significantly reduces manual reporting effort.
👥 Who Can Benefit from This Dashboard
This dashboard is ideal for:
✔ Internal Auditors
✔ Finance Managers
✔ Compliance Officers
✔ Risk Management Teams
✔ CFOs & Executive Leadership
✔ Corporate Governance Teams
✔ Consulting & Audit Firms
Any organization aiming to strengthen governance and compliance monitoring can use this solution effectively.
🚀 Business Benefits
Implementing the Financial Auditing Dashboard in Excel helps organizations:
-
Improve audit transparency
-
Detect risks earlier
-
Track corrective actions efficiently
-
Reduce reporting time
-
Strengthen compliance monitoring
-
Enhance decision-making accuracy
Instead of reactive auditing, organizations move toward proactive risk management.
👉 Visit our YouTube channel for step-by-step tutorials
https://youtube.com/@PKAnExcelExpert