
In today’s entertainment industry, every decision — from production to release — relies on accurate insights. Managing multiple projects, tracking post-production timelines, and monitoring revenue across platforms can be complex. The Film & Television Dashboard in Excel simplifies this challenge by turning raw data into dynamic visuals that help you manage your film and TV operations efficiently.
This ready-to-use Excel dashboard is designed for producers, studios, distributors, and streaming platforms to monitor progress, compare departmental performance, and evaluate profitability — all in one place. Whether you’re tracking film ratings or analyzing platform revenue, this dashboard gives you the clarity and control you need to make data-driven decisions with confidence.
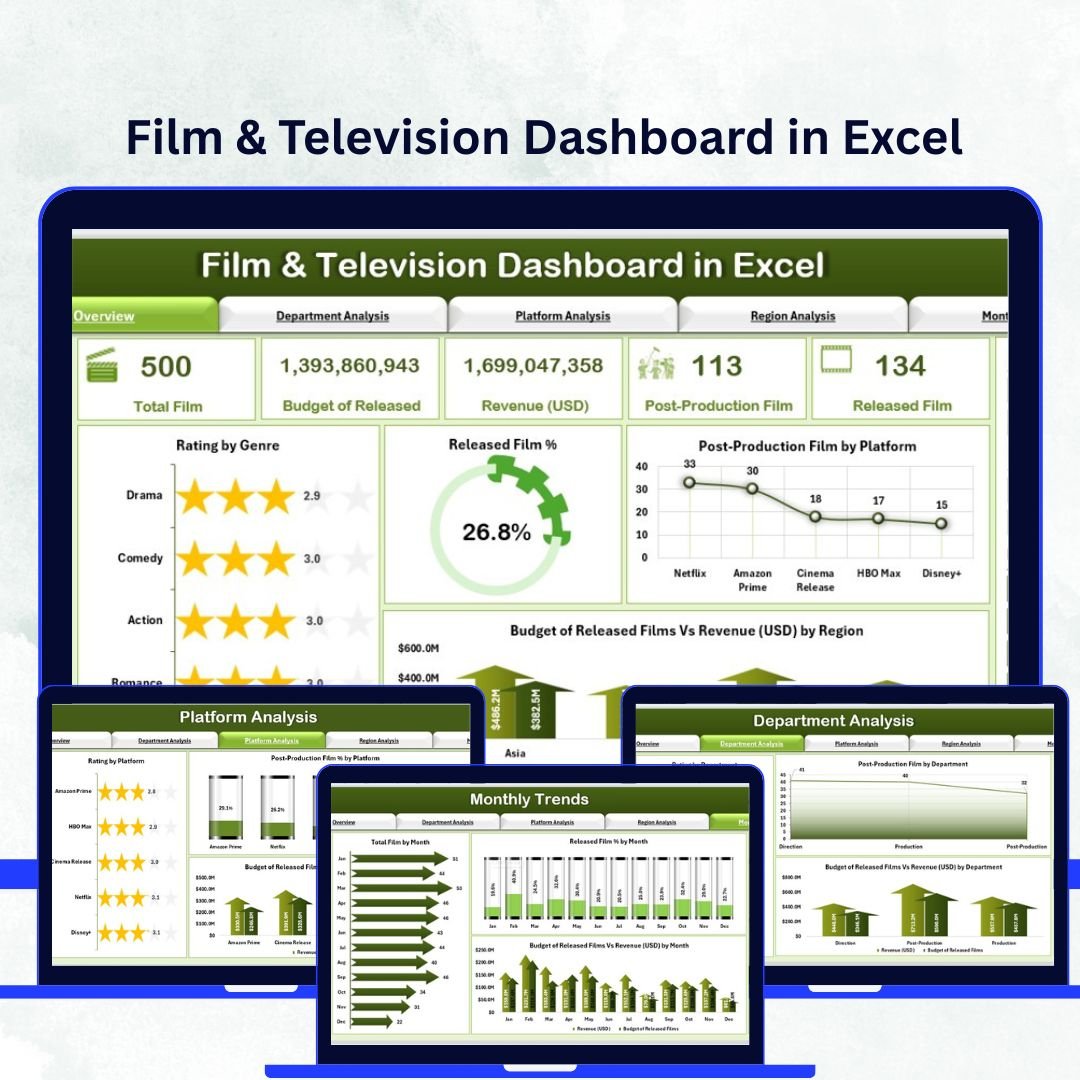
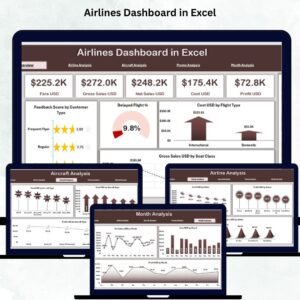
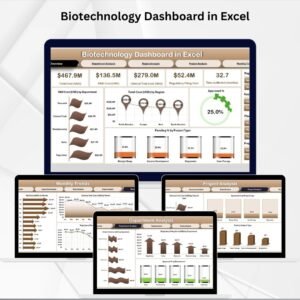
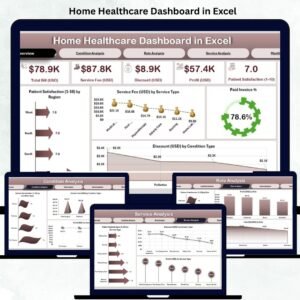
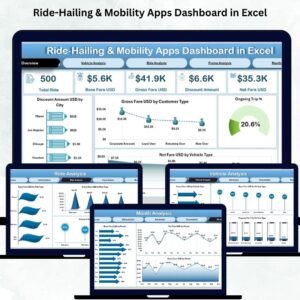
Built with interactive slicers, charts, and summary cards, the Film & Television Dashboard in Excel transforms traditional reporting into a visually engaging experience.
🎬 Key Features of the Film & Television Dashboard in Excel
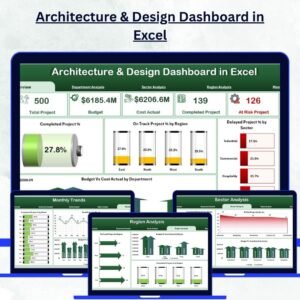
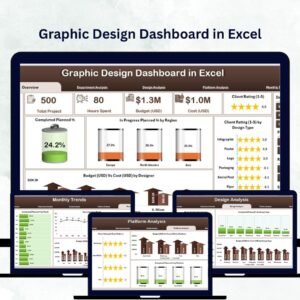
📊 5 Analytical Pages:
Includes Overview, Department Analysis, Platform Analysis, Region Analysis, and Monthly Trends — each offering a unique performance perspective.
🎯 Dynamic Page Navigator:
Switch between pages using the sidebar navigator for quick access and seamless navigation.
📈 Interactive Slicers:
Filter data by year, genre, region, platform, or department to analyze performance instantly.
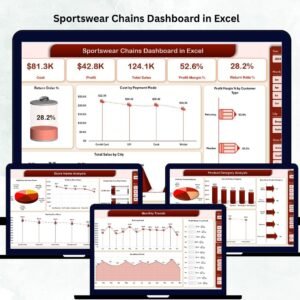
💰 Budget vs. Revenue Tracking:
Compare spending and earnings by department, region, or platform to understand profitability.
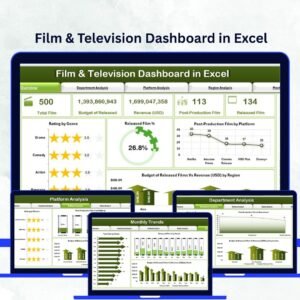
⭐ KPI Summary Cards:
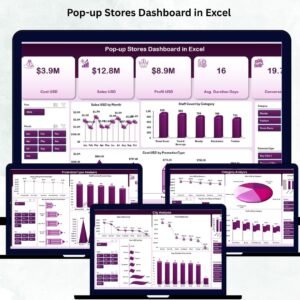
Instantly view Total Films, Released %, Post-Production Count, Total Budget, and Total Revenue at a glance.
📅 Monthly Trend Analysis:
Visualize how production volume, release patterns, and revenue evolve over time.
🎞️ Post-Production Insights:
Track ongoing projects and understand resource allocation by department or platform.
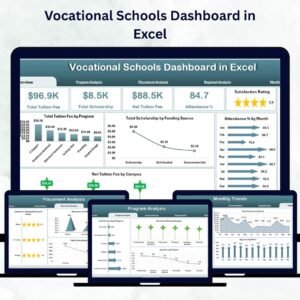
🌍 Regional Comparison:
Identify which regions deliver the best audience ratings, release rates, and financial returns.
🖌️ Customizable Layout:
Modify charts, slicers, and color themes to align with your studio or production branding.
🪄 No Coding Required:
100% Excel-based solution — ready to use without macros or technical setup.
📁 What’s Inside the Film & Television Dashboard in Excel
The dashboard is structured into five professional pages that cover all aspects of film and TV data management:
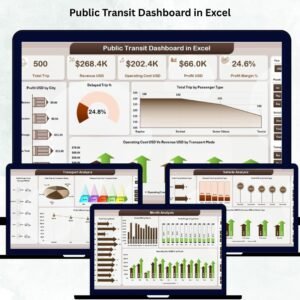
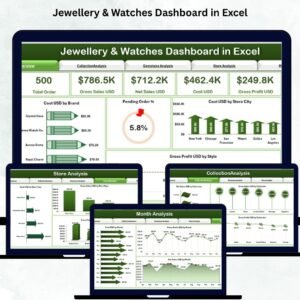
1️⃣ Overview Page:
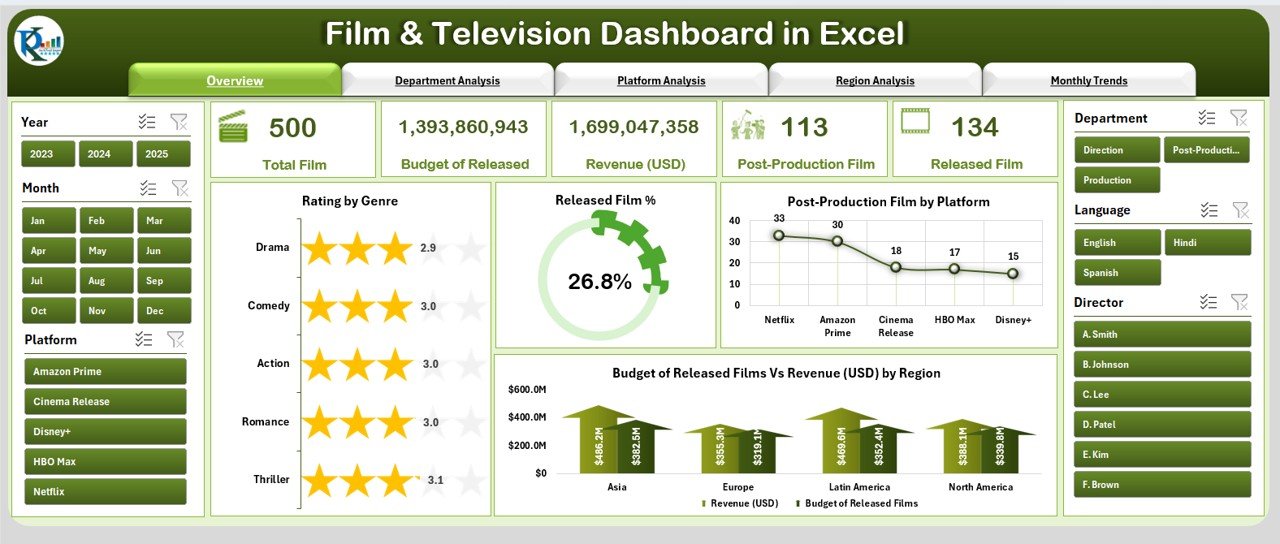
Get a complete snapshot of total films, post-production progress, revenue, and performance by genre and region.
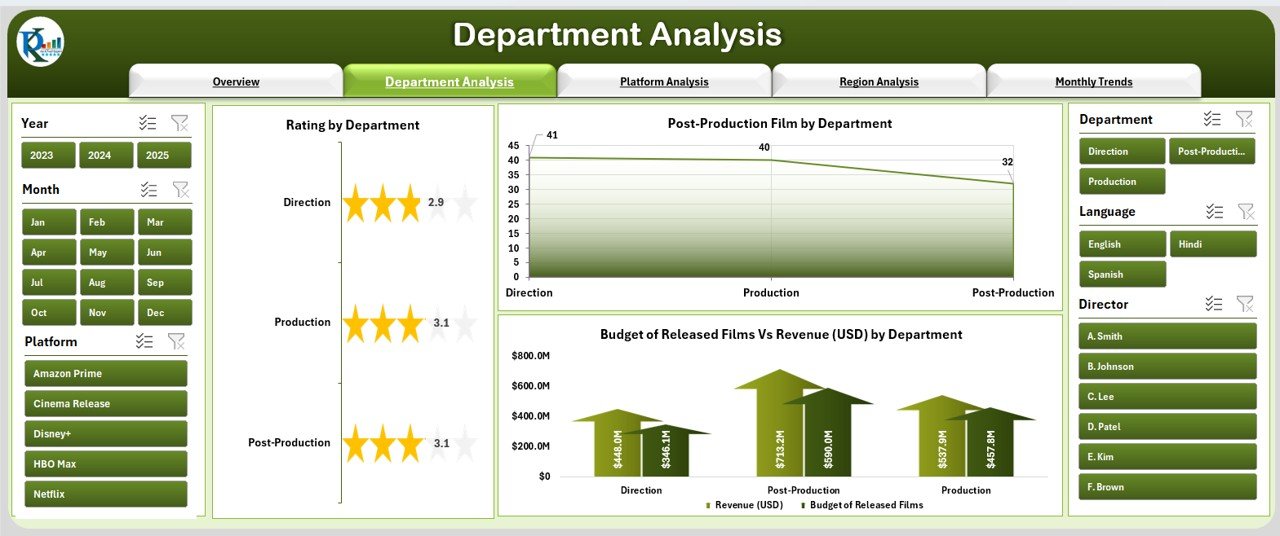
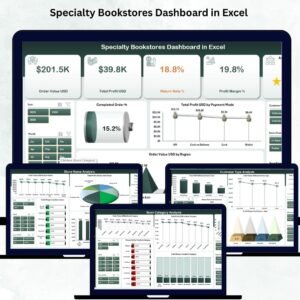
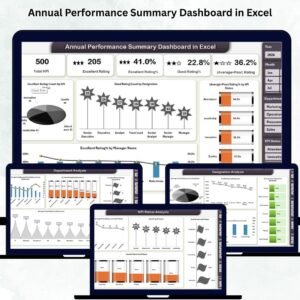
2️⃣ Department Analysis Page:
Evaluate how each department — from production to marketing — contributes to success.
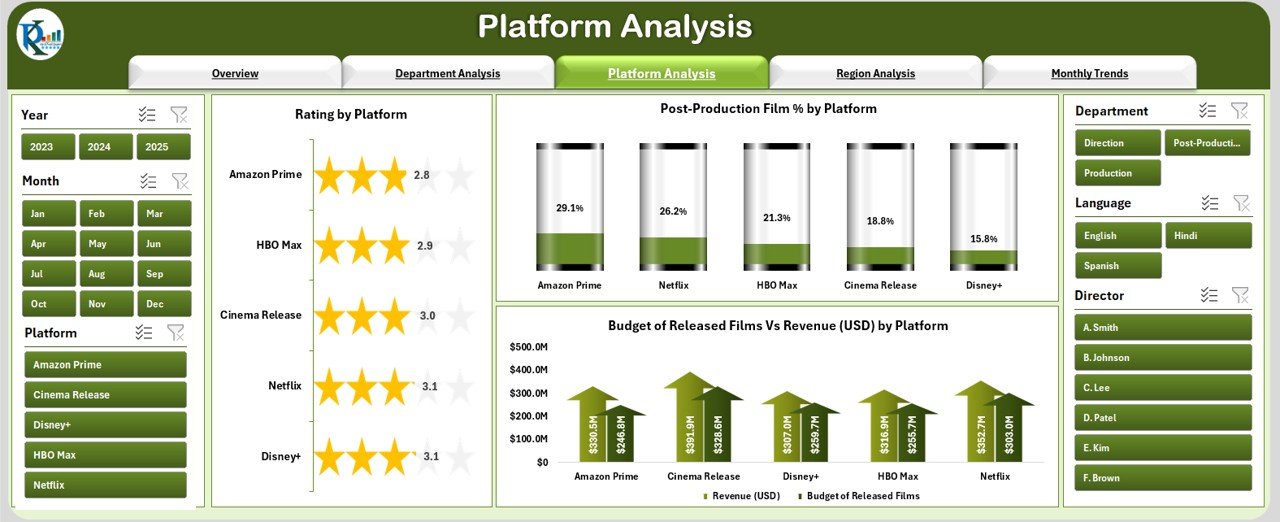
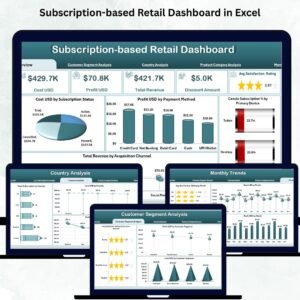
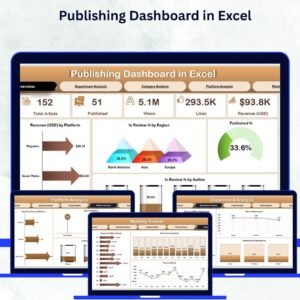
3️⃣ Platform Analysis Page:
Compare performance across streaming platforms like Netflix, Amazon Prime, Disney+, or Hulu.
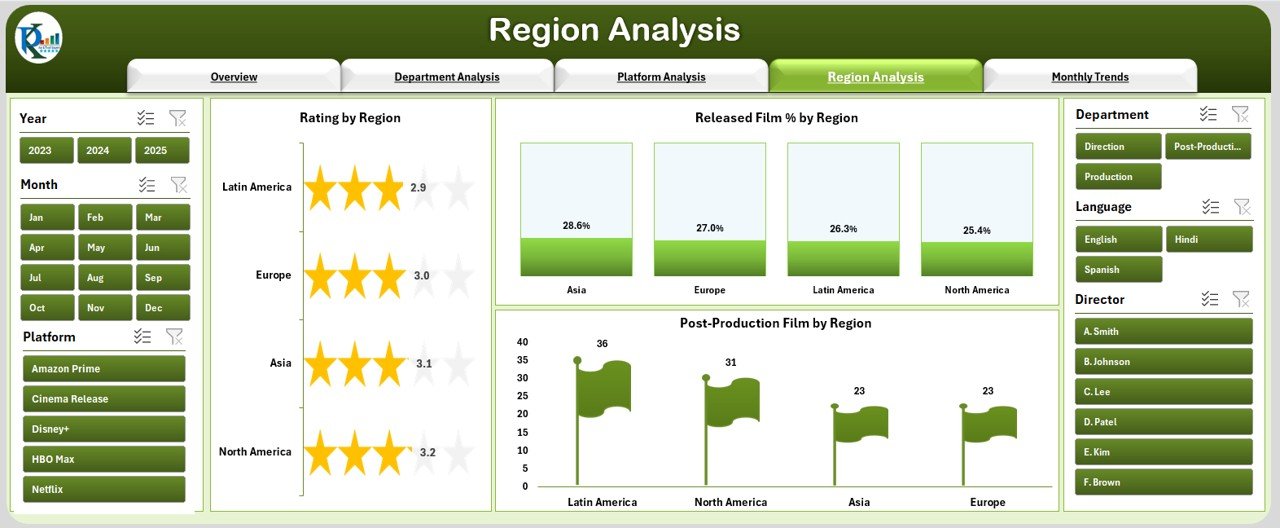
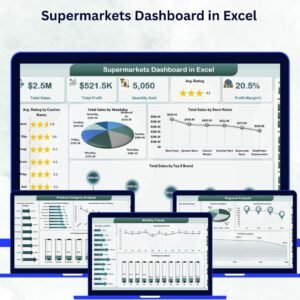
4️⃣ Region Analysis Page:
Analyze geographic trends, audience ratings, and release performance globally.
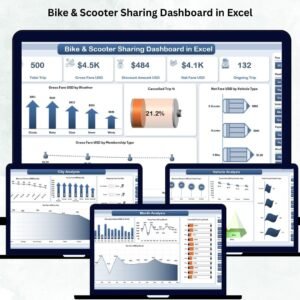
5️⃣ Monthly Trends Page:
Track monthly activity, releases, and revenue growth to identify seasonality and audience cycles.
All pages are powered by a single Support Sheet that houses your data and calculations, ensuring accuracy and easy updates.
🧭 How to Use the Film & Television Dashboard in Excel
🚀 Step 1: Enter or update your data in the Support Sheet (genre, region, department, etc.).
📊 Step 2: Open the Overview Page to view an instant summary of performance.
🎯 Step 3: Use slicers to filter data by time, genre, or platform.
📈 Step 4: Explore the Department and Platform Analysis pages for deeper insights.
🌎 Step 5: Review Region and Monthly Trends pages to plan releases strategically.
💡 Step 6: Customize charts and KPIs to suit your studio’s data tracking needs.
Within minutes, you’ll have a live snapshot of your film and TV performance — ready to share in meetings or presentations.
👥 Who Can Benefit from the Film & Television Dashboard in Excel
🎬 Film Producers: Manage projects, monitor budgets, and track production efficiency.
📺 Television Networks: Measure ratings, schedules, and department-level performance.
📽️ Streaming Platforms: Analyze audience trends, platform profitability, and regional reach.
🎞️ Production Houses: Optimize post-production timelines and resource utilization.
💼 Marketing & Distribution Teams: Align promotional efforts with performance insights.
💡 Finance Teams: Track cost-to-revenue ratios and assess ROI by project or region.
Whether you’re handling indie films or global productions, this Excel dashboard empowers you with the insights to maximize creativity and profitability.
🔗 Click here to read the Detailed Blog Post
🎥 Visit our YouTube channel to learn step-by-step video tutorials
🔗 YouTube.com/@PKAnExcelExpert


Reviews
There are no reviews yet.