Film production is exciting, creative, and fast-moving—but it is also risky, expensive, and highly unpredictable. Budgets can spiral quickly. Schedules often shift. Multiple teams work simultaneously. One small delay can impact the entire project timeline. Therefore, film production houses need more than gut feeling. They need clear numbers, real-time visibility, and structured control.
That is exactly where the Film Production Houses KPI Dashboard in Excel becomes a game-changer.
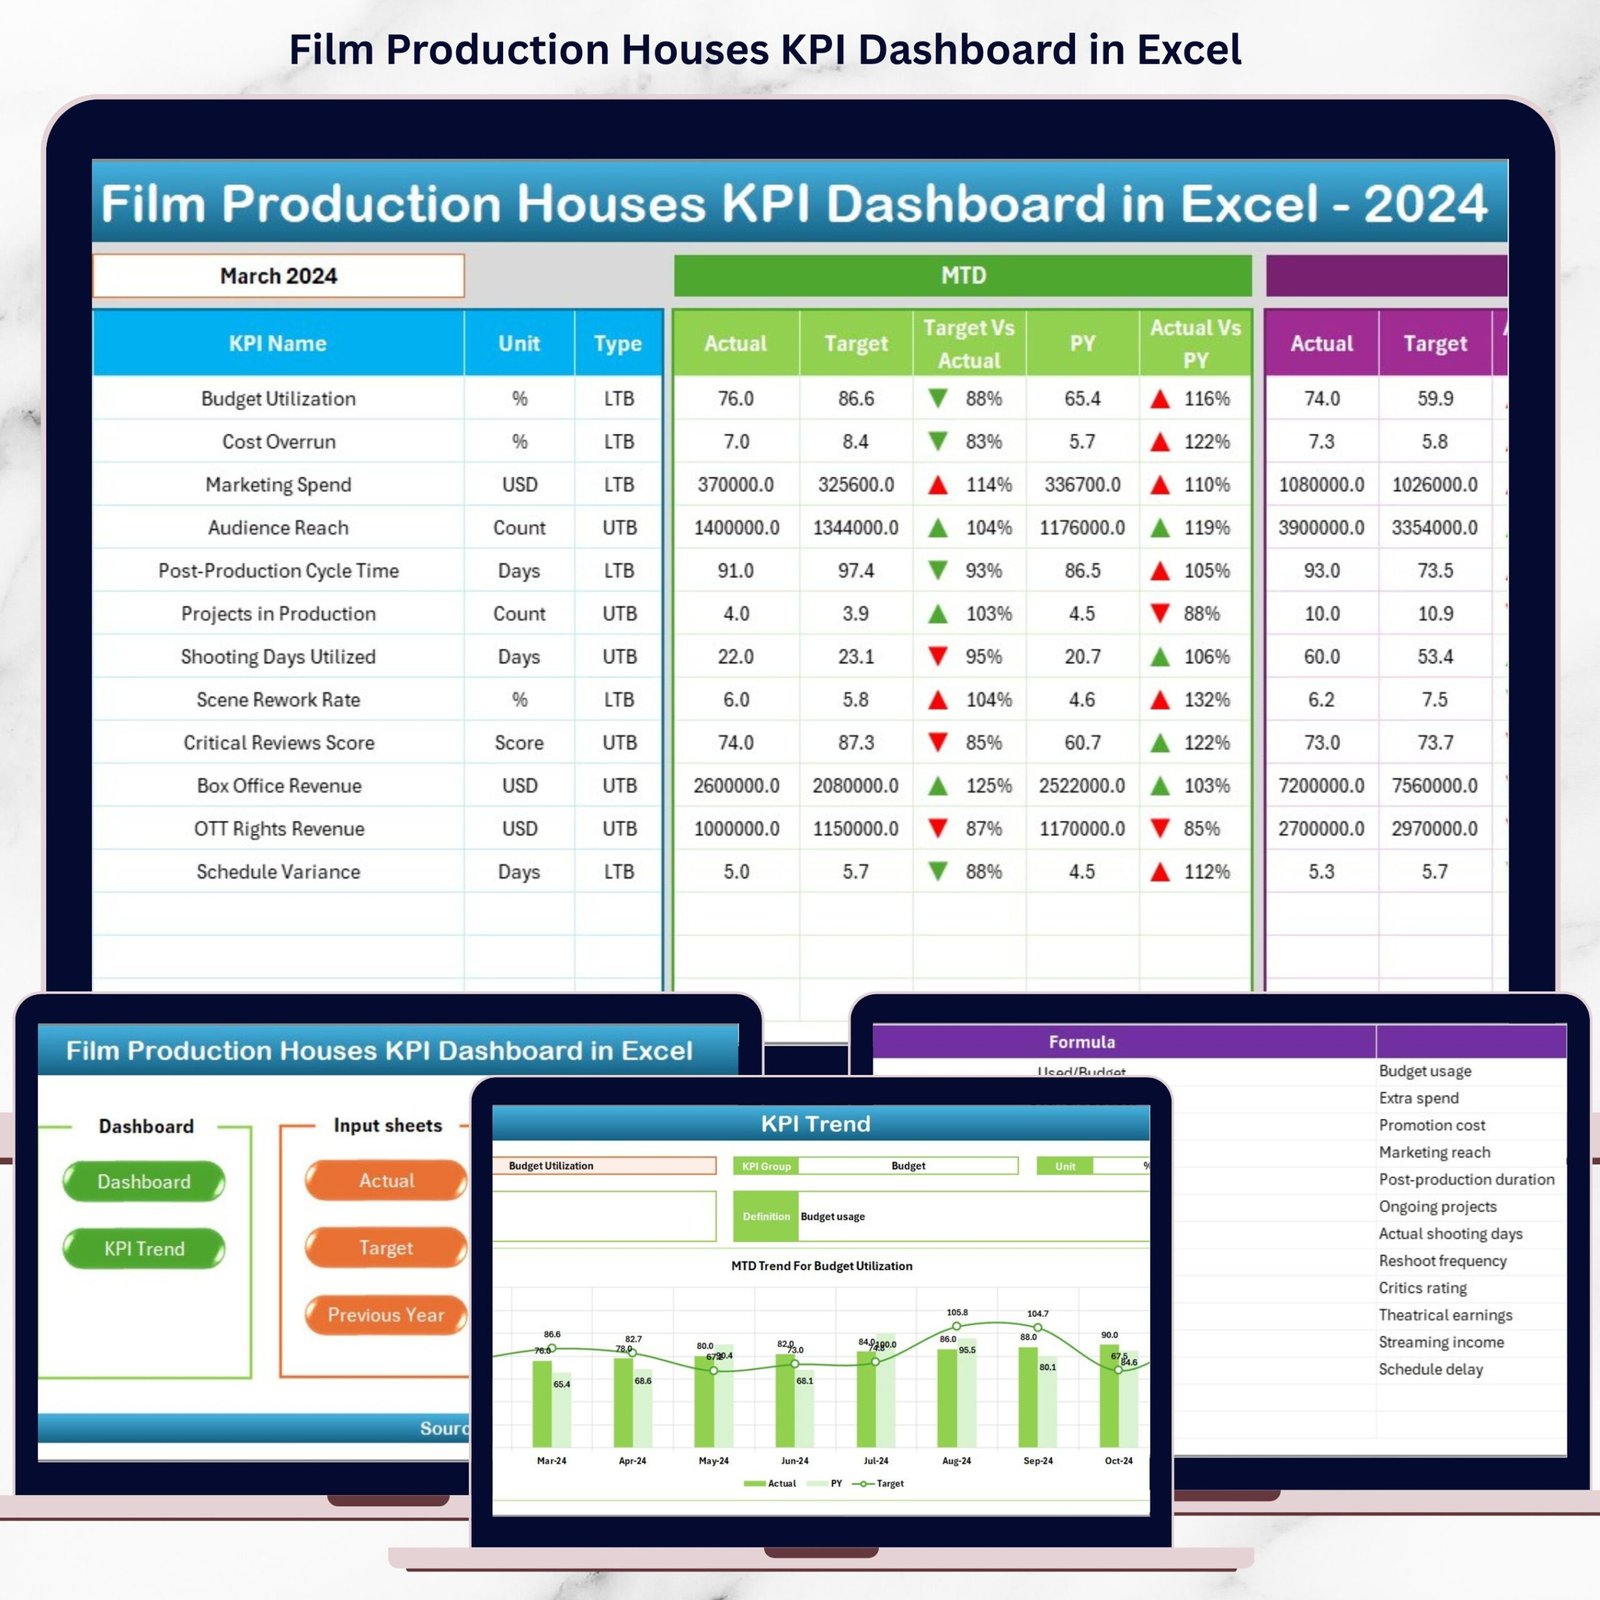
This powerful, ready-to-use Excel dashboard helps film studios, producers, and production managers track budgets, schedules, productivity, and performance from a single place. Instead of juggling multiple spreadsheets and manual reports, you get one centralized dashboard that transforms raw production data into clear, actionable insights.
🔑 Key Features of Film Production Houses KPI Dashboard in Excel
🎬 All KPIs in One Dashboard – Monitor production, financial, and operational KPIs from a single screen without switching files.
📅 Dynamic Month Selection – Instantly update the entire dashboard by selecting a month from a simple dropdown.
📊 MTD & YTD Performance Tracking – Track Month-to-Date and Year-to-Date performance with ease.
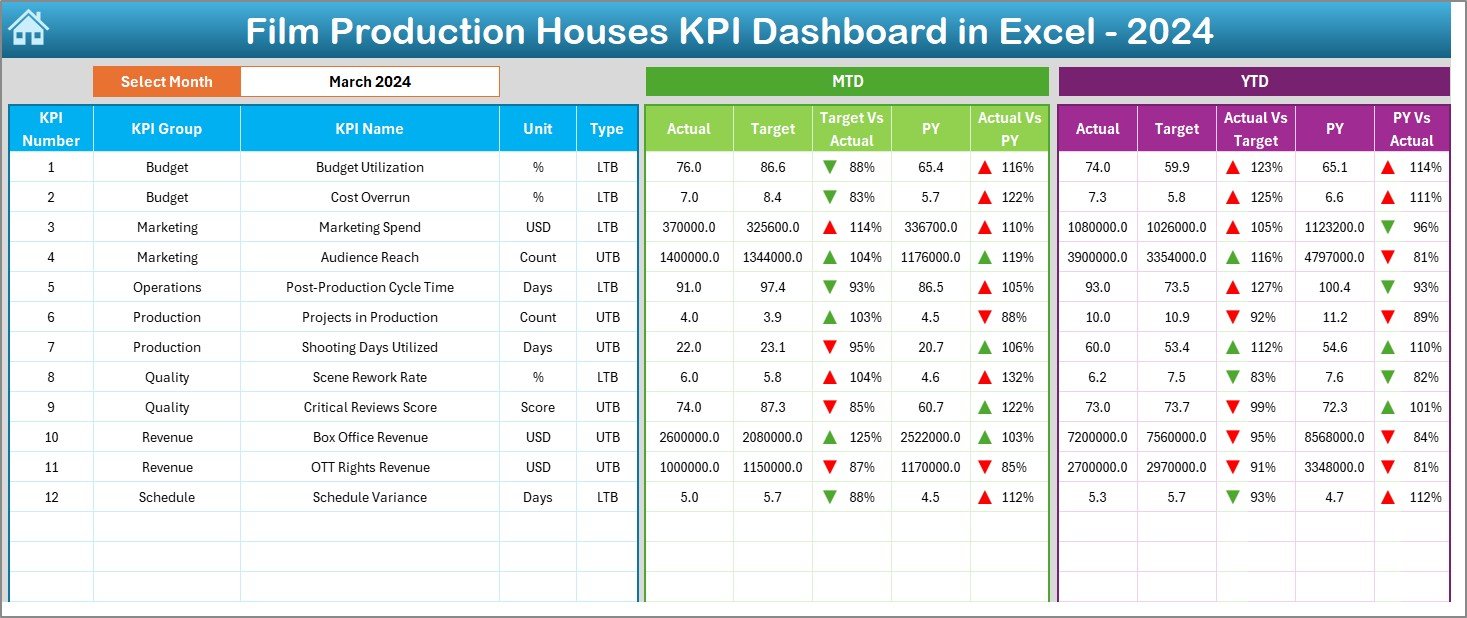
🎯 Target vs Actual Comparison – Identify cost overruns, delays, and inefficiencies instantly.
📈 Previous Year Analysis – Compare current performance with last year to spot trends and patterns.
⬆️⬇️ Visual Performance Indicators – Conditional formatting arrows make performance interpretation effortless.
🧠 Decision-Ready Insights – Turn complex production data into simple visuals that drive faster decisions.
🛠️ Fully Customizable – Add, remove, or modify KPIs as per project requirements.
📂 What’s Inside the Film Production Houses KPI Dashboard in Excel
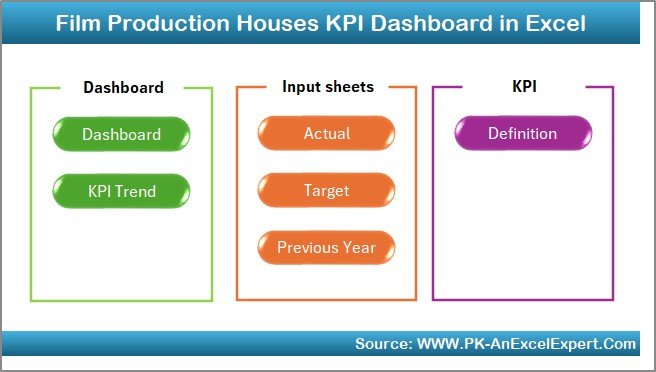
This dashboard is thoughtfully designed with 7 structured worksheets, each serving a specific purpose:
📌 Summary Page – An index sheet with navigation buttons for smooth and quick access to all sections.
📌 Dashboard Sheet – The core dashboard showing all KPIs with MTD, YTD, Target, and Previous Year comparisons.
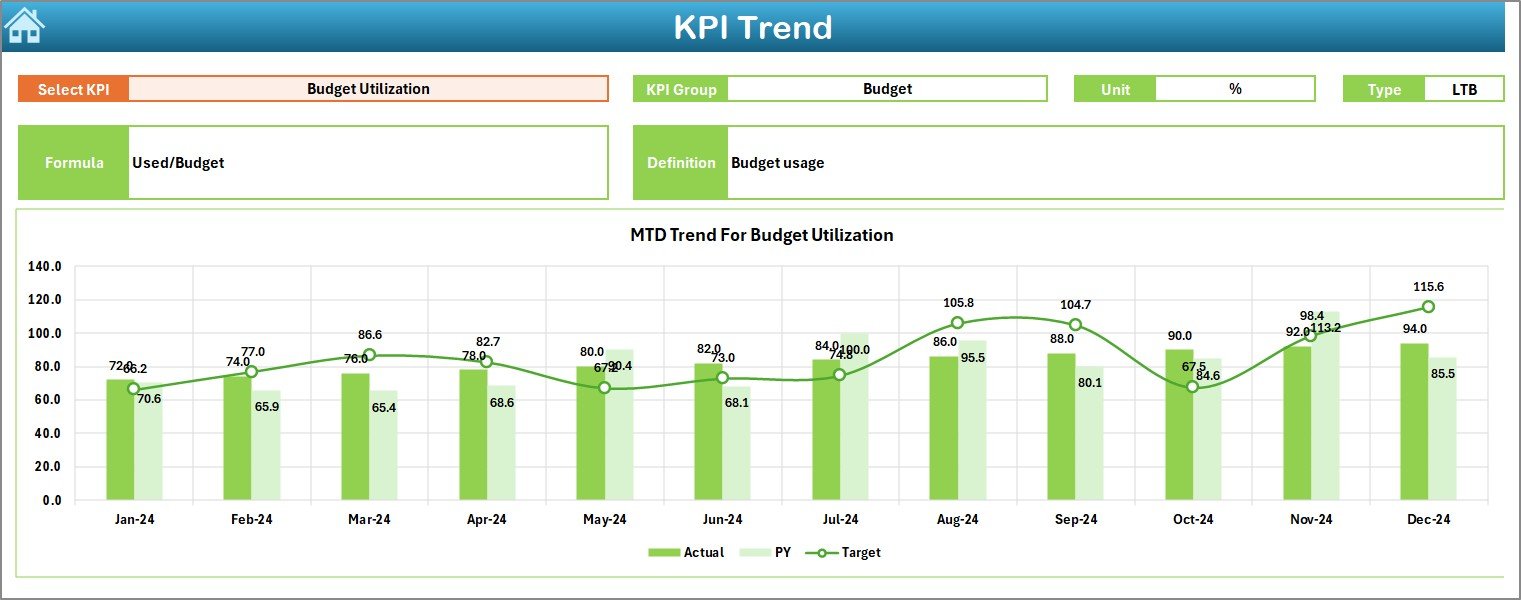
📌 Trend Sheet – Analyze KPI trends over time with interactive charts and KPI-level details.
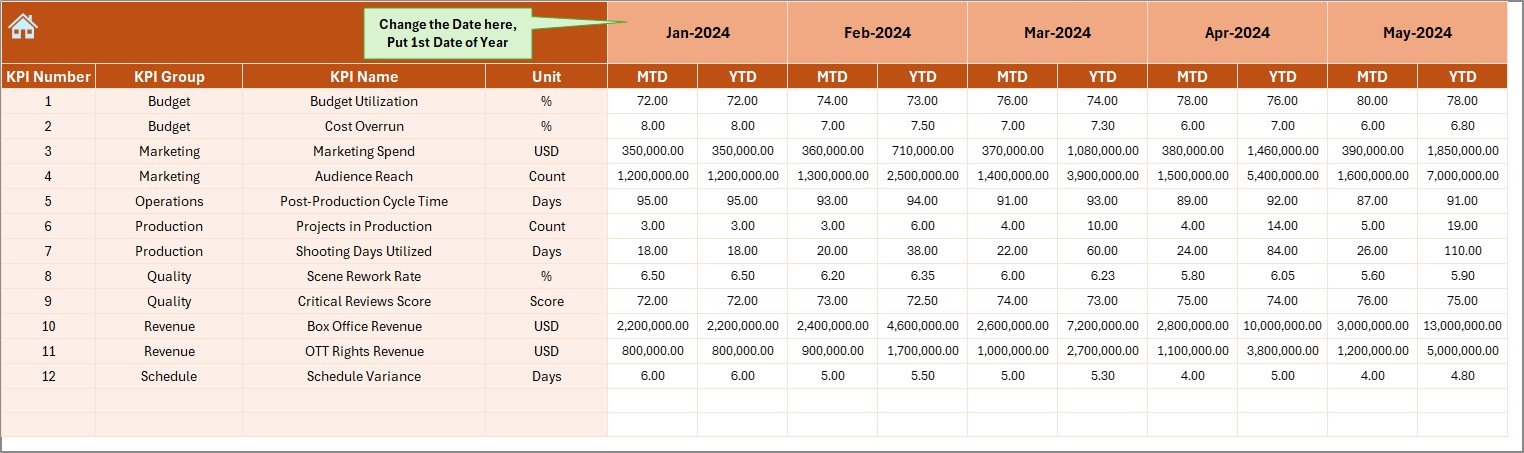
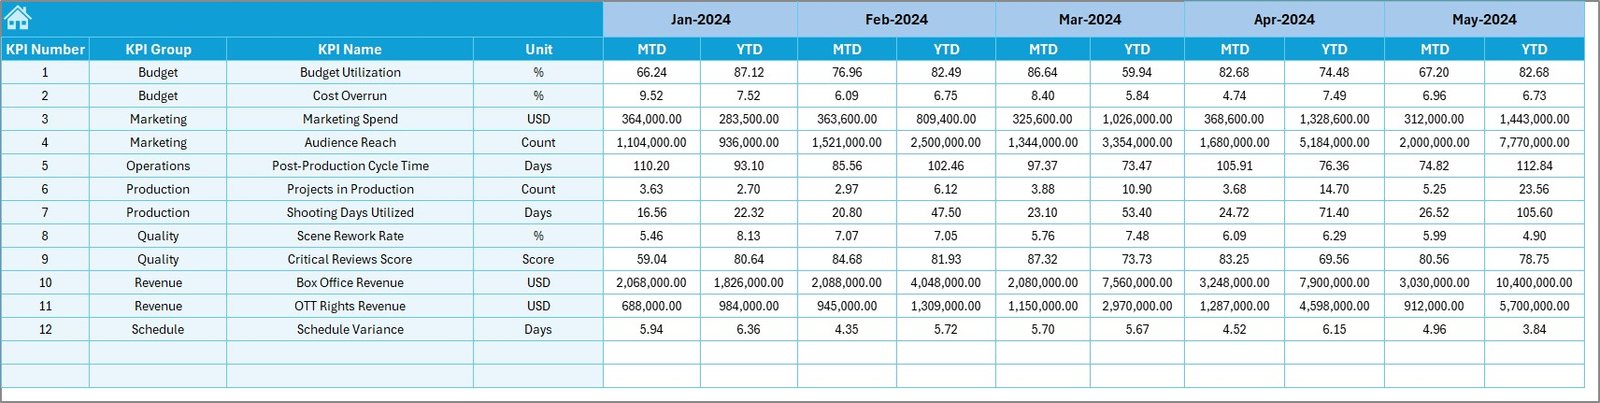
📌 Actual Numbers Sheet – Enter actual production values with minimal effort using a month-controlled structure.
📌 Target Sheet – Store and manage monthly and yearly KPI targets.
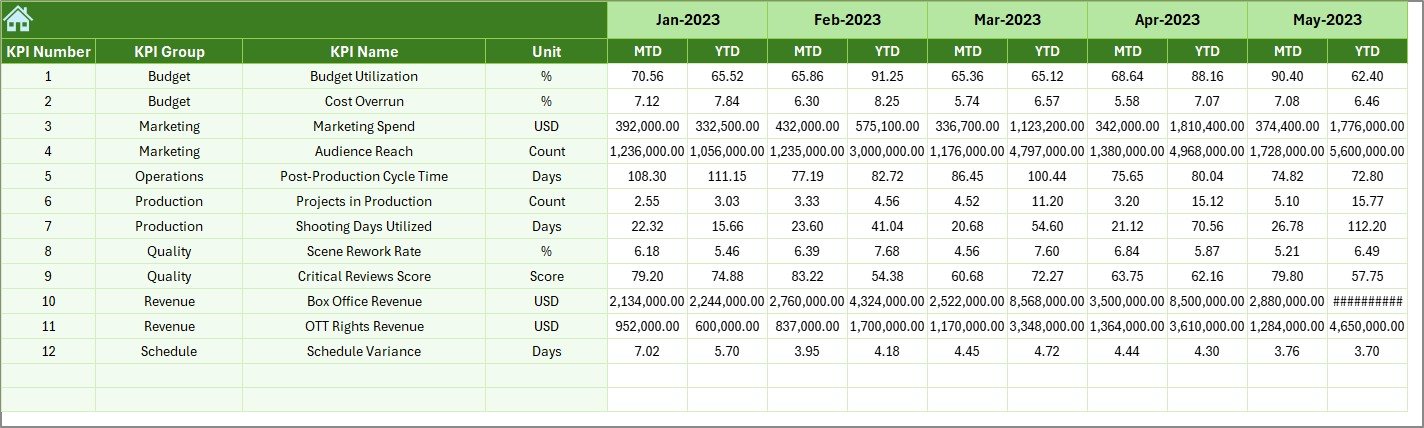
📌 Previous Year Sheet – Capture historical performance for year-over-year analysis.
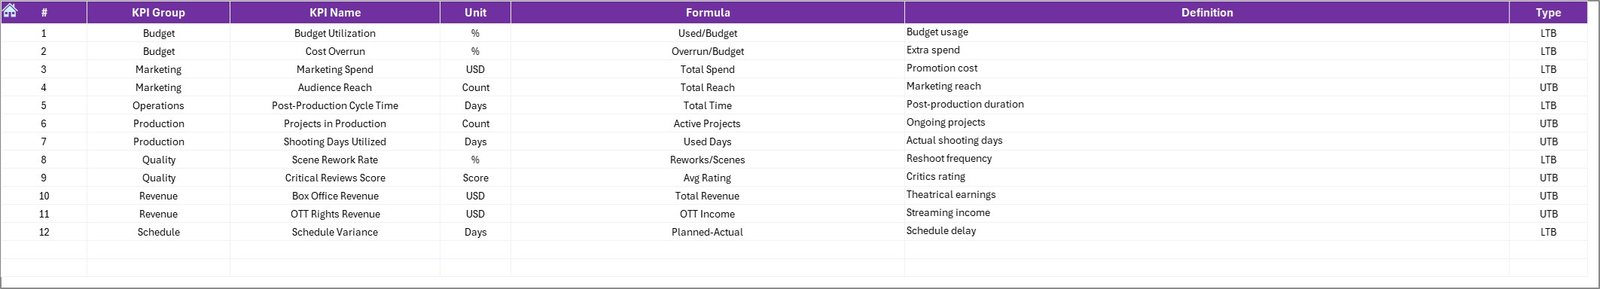
📌 KPI Definition Sheet – A clear reference guide explaining each KPI, its formula, unit, and purpose.
Together, these sheets deliver a complete performance management system for film production houses.
🛠️ How to Use the Film Production Houses KPI Dashboard in Excel
Using this dashboard is simple—even if you are not an Excel expert:
🎯 Step 1: Enter KPI definitions and targets in the respective sheets.
🎯 Step 2: Update actual production numbers monthly.
🎯 Step 3: Select the desired month using the dropdown.
🎯 Step 4: Instantly review performance on the Dashboard and Trend sheets.
🎯 Step 5: Use insights to control costs, schedules, and productivity.
Because everything is automated, you spend less time preparing reports and more time managing production.
🎥 Who Can Benefit from This Film Production KPI Dashboard?
This dashboard is ideal for:
🎬 Film Production Houses
🎥 Independent Film Producers
📋 Production Managers & Line Producers
💰 Finance & Budget Control Teams
🏢 Studio Executives & Decision-Makers
📺 Media & Entertainment Companies
Whether you manage a short film, web series, or big-budget production, this dashboard adapts effortlessly.
Click here to read the Detailed blog post
Watch the step-by-step video tutorial:


Reviews
There are no reviews yet.